

Abstract
The ability of kinesin to travel long distances on its microtubule track without dissociating has led to a variety of models to explain how this remarkable degree of processivity is maintained. All of these require that the two motor domains remain enzymatically “out of phase,” a behavior that would ensure that, at any given time, one motor is strongly attached to the microtubule. The maintenance of this coordination over many mechanochemical cycles has never been explained, because key steps in the cycle could not be directly observed. We have addressed this issue by applying several novel spectroscopic approaches to monitor motor dissociation, phosphate release, and nucleotide binding during processive movement by a dimeric kinesin construct. Our data argue that the major effect of the internal strain generated when both motor domains of kinesin bind the microtubule is to block ATP from binding to the leading motor. This effect guarantees the two motor domains remain out of phase for many mechanochemical cycles and provides an efficient and adaptable mechanism for the maintenance of processive movement.
Members of the kinesin family of molecular motors are capable of taking over 100 steps on their microtubule track without dissociating, a feature that would be necessary for a transport motor that operates in isolation (1–6). A variety of kinetic, structural, and mechanical studies have revealed that this processive behavior requires that two motors of kinesin remain in different structural and enzymatic states during a processive run (7–10, 11, 12). This would ensure that, at any given time, at least one of the two heads would remain strongly attached to its track, preventing the motor from prematurely detaching. Such coordination requires a way for the two motor domains to communicate their structural states to each other while walking processively. Several lines of evidence suggest that this allosteric communication is mediated through the internal load generated when both heads attach to the microtubule (1, 13–16). As illustrated below in Fig. 1, kinesin initiates its mechanochemical cycle with its attached head (green) nucleotide free and its tethered head (magenta) containing ADP in the active site. ATP binding to the attached head reorients its neck linker (blue), which swings the tethered head forward to the next tubulin-docking site. ADP is then released from the new, weakly bound leading head (magenta) to produce an intermediate in which both heads are strongly bound to the microtubule. This situation would generate rearward strain on the neck linker of the leading head, depicted as a left pointing arrow, and forward strain on the corresponding structure of the trailing head, depicted as a right pointing arrow.
Fig. 1. Kinesin’s first two steps.
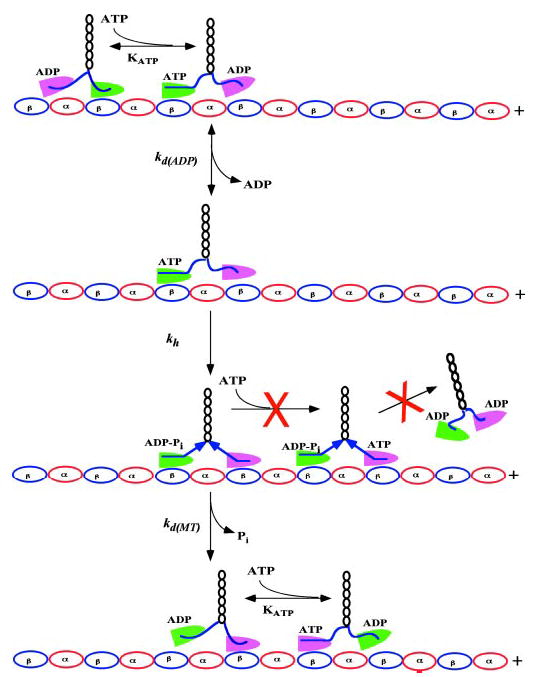
The two motor domains of kinesin are distinguished by magenta and green shading and are depicted walking on a track of tubulin dimers. The neck linkers are depicted by the blue lines that connect the motor domains to the black coiled coil dimerization segment. The mechanochemical cycle is initiated by ATP binding to the green, attached motor domain and is characterized by the equilibrium constant KATP. This leads to rapid (~800 s−1) docking of this motor domain’s neck linker (depicted as a straightening of the blue neck linker), which throws the tethered magenta motor forward toward the next tubulin docking site. Release of ADP from the new leading (magenta) motor, occurring with forward rate constant kdADP (170 ± 17s−1), is followed by ATP hydrolysis (kh, ~100 s−1), which leads to binding of both heads to the microtubule. This places the two neck linkers under mechanical strain (depicted as the rightward and leftward pointing blue arrows). In the absence of any mechanism to prevent it, ATP could then bind to the empty, leading motor domain (magenta) and then become rapidly hydrolyzed. This would produce motor dissociation from the microtubule after only two turnovers. That this does not happen (symbolized by the red X) implies that a mechanism must exist to prevent ATP from binding to the leading head while it is experiencing rearward strain (see text for details). Instead, hydrolysis is followed by dissociation of the rear head, characterized by rate constant kdMT, which occurs concomitantly with phosphate release.
It has been proposed that this strain generates processivity by accelerating release of the trailing head (13, 17). In this mechanism, release of the ADP-containing trailing head would be very slow in the absence of forward strain and fast in its presence. In such a system, the greater that forward strain accelerates kdMT, the greater the degree of processivity. However, there is an internal inconsistency with this scheme. If kinesin’s processivity were dependent solely on this mechanism, the motor would dissociate from the microtubule after only a few steps. The reasoning behind this is illustrated in Fig. 1. We have recently shown (18) that the effective rate of trailing head dissociation (kdMT ~ 50 s−1) is appreciably slower than that for ADP release (kdADP = 170 s−1, this work, and Refs. 8, 19–21), and ATP hydrolysis (kh, 100 s−1, Refs. 8, 19, 21, 22). This would lead to accumulation of a kinesin intermediate with both heads attached to the microtubule, with the leading head nucleotide free, and with ADP-Pi in the active site of the trailing head. Given millimolar intracellular ATP concentrations and an apparent second order rate constant of > 1 μm−1s−1 (2, 8, 15, 19, 20, 23), ATP would then rapidly bind to the new leading head (>1000 s−1) and be hydrolyzed. This would generate an intermediate with both heads weakly bound, and dissociation would rapidly follow, as indicated in Fig. 1 by the red X. The fact that kinesin is highly processive (1–6) argues that there is a mechanism that prevents it from proceeding down this pathway.
An alternative possibility is that rearward strain on the leading head slows ATP binding and subsequent hydrolysis, insuring that the leading head would remain strongly attached until the trailing head had dissociated. ATP would then rapidly bind to the leading head and cause the trailing head to swing forward to the next tubulin-docking site. Processive movement would be favored, because the rate of this forward stepping movement, at ~800 s−1, is nearly sixteen times faster than the rate of trailing head dissociation (18). Furthermore, blocking ATP binding to the forward head while it was experiencing rearward strain would prevent the motor from proceeding down the pathway marked by the red X in Fig. 1.
Determining whether processivity depends on the first mechanism, the second, or to some degree on both requires the ability to unambiguously measure the rates of key steps in the mechanochemical cycle and the effects of strain on these rates. These include the rates of trailing head dissociation, of ADP release from the tethered head after it attaches to the micro-tubule, and of ATP binding to the new, leading head. In this study, we apply the spectroscopic approaches developed in our prior work to make these measurements (15, 18, 23). This has allowed us to generate a model that provides an efficient yet adaptable mechanism for insuring processivity in this motor.
EXPERIMENTAL METHODS
Generation of K413FBIO
K413W340F, a cysteine-light recombinant kinesin construct with tryptophan 340 replaced by phenylalanine, consists of the first 413 amino-terminal residues of human kinesin, and was generated as described in our previous study (18). K413BIO is a construct in which K413W340F is fused at the carboxyl terminus to a biotinyl transferase recognition peptide, followed in turn by a hexahistidine tag for affinity purification. The peptide sequence, with its attached biotin, was incorporated into the K413 sequence to allow for attachment of the motor to streptavidin-coated beads used in motility assays in vitro. The plasmid containing the K413W340F mutant kine-sin construct served as a PCR template to amplify the kinesin insert with the following primers: upstream, 5′-AGATATACATATGGCGGA-CCTGGCC-3′; downstream, 5′-AAGTTGCATGTGCTCGAGAAAATTT-CCTATAACTCCAAT-3′. The underlined sequences are the NdeI and XhoI restriction sites, respectively. The fragment was cloned into pCR2.1-TOPO (Invitrogen, Carlsbad, CA) and excised with NdeI and XhoI. The fragment was purified and then ligated into a pET-21 vector with an in-frame biotinyl transferase recognition peptide sequence at the XhoI (carboxyl terminus) site. The resultant construct was verified by sequence analysis.
In Vitro Motility Studies of K413BIO
Single molecule kinesin bead motility assays were performed essentially as described previously (24). 500-nm diameter carboxy-modified latex beads (Bangs Laboratories, Fishers, IN) were covalently biotinated with biotin-x-cadaverine (Molecular Probes, Eugene, OR), coated with avidin-DN (Vector Laboratories, Burlingame, CA), and purified by repeated pelleting and resuspension followed by sonication to eliminate clumping. Diluted kinesin constructs were mixed with the beads and incubated at 4 °C for 4 h in assay buffer containing 80 mm PIPES,1 pH 6.9, 50 mm potassium acetate, 4 mm MgCl2, 2 mm dithiothreitol, 1 mm EGTA, 7 μm Taxol, various ATP concentrations, and 2 mg/ml bovine serum albumin as a blocking protein. The beads were diluted to 80 fm, and final kinesin dilutions were chosen such that, on average, fewer than half of the beads moved (typically 1:500,000 to 1:1,000,000 from ~100 μm stock). An oxygen-scavenging system (37) was added to the kinesin:bead mixture just prior to measurement.
Flow cells with a volume of −20 μl were constructed by using two strips of doubly adhesive tape to form a channel between a microscope slide and a No. 1½ coverslip (cleaned by sonication in 5 m ethanolic KOH and coated with polylysine). Ingredients were introduced in the following order: taxol-stabilized MTs (polymerized from purified bovine brain tubulin, Cytoskeleton, Inc., Denver, CO) followed by a 10-min incubation, assay buffer wash followed by a 10-min incubation, and then kinesin:bead mixtures. To ensure that measurements reflected single molecule properties, data was only collected from assays in which fewer than half of the tested beads moved. All chemicals used were from Sigma, except bovine serum albumin and the ingredients used in the oxygen scavenging system (Calbiochem, San Diego, CA). Kinesin velocities and run lengths were measured by centroid video tracking (25) with sub-pixel resolution using a commercial video tracking software package (Isee Imaging Systems, Raleigh, NC).
Fluorescence Methodologies
Labeling of K413W340F and K413W340FBIO with 5-(((2-iodoacetyl)amino)ethyl)aminonaphthalene-1 sulfonic acid or tetramethyl rhodamine maleimide was carried out as described previously (15, 18, 23). Labeling of phosphate-binding protein by MDCC was carried out as described previously (26). Transient kinetic measurements were made in an Applied Photophysics SX.18 MV stopped-flow spectrometer with instrument dead time of 1.2 ms as described previously (15, 18, 23). Unless otherwise described, complexes of kinesin and microtubules were formed with a 5- to 10-fold molar excess of microtubules over active sites. ADP was added to 3 μm to ensure that the tethered kinesin head of a kinesin-microtubule complex contained ADP in the active site. Experiments with phosphate-binding protein were carried out in phosphate mop (0.2 unit/ml purine nucleoside phosphorylase plus 1 mm 7 methylguanosine) with a 10-fold molar excess of MDCC-labeled phosphate-binding protein over kinesin active sites in both syringes.
RESULTS
In Vitro Motility of K413BIO
The experiments in this study utilize a cysteine-light dimeric kinesin construct (K413), and it was necessary to establish that this kinesin construct is processive. In our previous study, we provided enzymatic evidence that K413 is capable of undergoing multiple enzymatic cycles per diffusional encounter with the microtubule, a prerequisite for processivity (18). Furthermore, attaching the biotin transferase recognition sequence to the carboxyl terminus of K413 had no appreciable effect on kcat (20 ± 2 s−1), K0.5,MT (0.30 ± 0.1 μm), or kbi,ADP (1.28 ± 0.15 μm−1s−1) (data not shown). However, enzymatic measures of processivity are indirect. To directly assess processive behavior, we examined the in vitro motility properties of K413BIO.
As with wild-type kinesin, average in vitro velocities showed a Michaelis-Menten dependence on ATP concentration, defining values of Vmax and KmATP of 703 ± 73 nm/s and 23 ± 9 μm, respectively (Fig. 2A). These compare with values of 650–800 nm/s and ~80 μm for wild-type squid kinesin measured in our laboratory (6, 27). Fig. 2B illustrates the distribution of run lengths for K413BIO. Run length did not vary beyond experimental error over the range of ATP concentrations examined, and fitting data from all ATP concentrations to an exponential decay revealed a mean run length of 276 ± 22 nm. Thus, although in vitro velocities of K413BIO are similar to wild-type, mean run length is reduced by a factor of 2–3. Having established that K413BIO was processive, we decided to use it to test the two models of how kinesin uses strain to walk processively: that forward strain accelerates trailing head release or that rearward strain inhibits ATP binding to the leading head.
Fig. 2. In vitro motor properties of K413BIO.
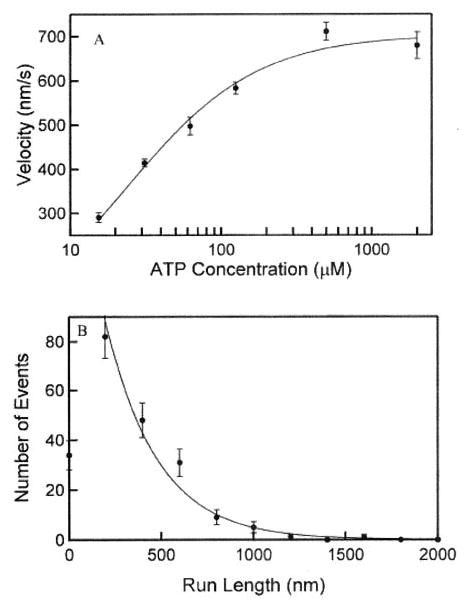
A, semi-logarithmic plot of bead velocity versus [ATP]. The smooth curve was fit to the Michaelis-Menten equation, defining values of Vmax and Km(ATP) of 703 ± 73 nm/s and 23 ± 9 mm, respectively. B, run length distribution of K413BIO. Run length did not vary beyond experimental error over the range of ATP concentrations examined, and fitting to an exponential decay revealed a mean run length of 276 ± 22 nm.
Evaluation of the Effect of Forward Strain on the Trailing Head
Dissociation of K413BIO:Microtubule by ATP
If forward strain on the trailing head accelerates its release, then we would predict that release of the trailing head of a processively moving kinesin dimer should be faster than that for a non-processive monomeric construct, because the latter is incapable of generating internal strain. The steps leading to ATP-induced dissociation from the microtubule are summarized in Fig. 1. In this scheme, the observed dissociation rate, λATP, depends on the binding constant for ATP (KATP) and on the effective rate constant for ATP-induced dissociation, ke. The value of ke depends in turn on the values of the forward rate constants for the two irreversible steps that lead to dissociation, ATP hydrolysis (kh), and subsequent dissociation from the microtubule (kdMT). Under these conditions, λATP is defined by the following,
| (Eq. 1) |
where ke = (kh·kdMT)/(kh + kdMT).
If strain accelerates trailing head dissociation, ke should be greater for K413BIO than for K349. We measured the rate of trailing head dissociation for K413BIO and compared these results to those for monomeric K349. For K413BIO, this was accomplished using two spectroscopic probes, AEDANS and TMR, whose use we have previously described (18), whereas for K349 we utilized AEDANS and turbidity. The solid line in Fig. 3 depicts the fitting of the AEDANS data (open boxes) for K413BIO to Equation 1, whereas the dotted line depicts the corresponding fitting of the AEDANS data (open diamonds) for K349. It is immediately apparent that λATP is consistently faster for monomeric kinesin than for trailing head dissociation by dimeric kinesin, the opposite of what would be expected if strain accelerated trailing head dissociation.
Fig. 3. Kinetics of ATP-induced dissociation of the trailing head of K413BIO, compared with K349.
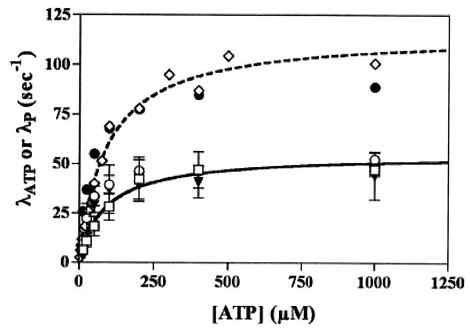
Dissociation of the trailing head of K413BIO was directly monitored by an AEDANS probe on the neck linker (open boxes), by a rhodamine probe on the neck linker (closed triangles), and by the rate of phosphate release in the first turnover (open circles). The observed rate of fluorescence decrease, λ ATP, or phosphate release, λP, was plotted as a function of [ATP]. Results were compared with those for a 1:3 K349-microtubule complex, using AEDANS FRET (open diamonds) and phosphate release (closed circles). Fitting of the AEDANS data for K413BIO (solid curve) and K349 (dotted curve) are shown in the figure. Results of fitting to Equation 1 for all data sets are summarized in Table I. Conditions: 100 mm KCl, 25 mm HEPES, 2 mm MgCl2, 1 mm EGTA, 1 mm dithiothreitol, pH 7.50, 20 °C.
The AEDANS probe monitors motor-microtubule association, and results with this probe for K349 are nearly identical to those using turbidity (data not shown). For K413BIO, the TMR probe monitors neck linker-neck linker reassociation, a step whose rate we have shown is kinetically controlled by dissociation of the trailing head (18). We would therefore predict that results using the TMR probe (closed triangles) should be superimposable on those using the AEDANS probe (open boxes), and Fig. 3 confirms this. Table I summarizes the values of KATP and ke for both probes. Nearly identical results were seen at 10 mm KCl (data not shown).
Table I. Rate and equilibrium constants for ATP-induced dissociation of K413 and K349.
Conditions: 100 mm KCl, 25 mm HEPES, 2 mm MgCl2, 1 mm EGTA, 1 mm DTT, pH 7.50, 20 °C. The kinesin preparations were 3 μm, and microtubules were 40 μm. KATP, ke, and kI are defined in the text and were determined by fitting to Equation 1.
| Sample | Probe | KATP | ke | kp |
|---|---|---|---|---|
| μm | S−1 | |||
| K349 | AEDANS | 91 ± 9 | 116 ± 4 | |
| K349 | Turbidity | 72 ± 16 | 97 ± 7 | |
| K349 | Pi release (100 mM KCl) | 34 ± 2 | 92 ± 1 | |
| K413 | AEDANS | 87 ± 29 | 55 ± 6 | |
| K413 | Rhodamine | 50 ± 21 | 48 ± 6 | |
| K413 | Pi release (10 mm KCl) | 25 ± 5 | 44 ± 2 | |
| K413 | Pi release (100 m M KCl) | 34 ± 10 | 53 ± 5 | |
Phosphate Release by K413BIO-Microtubule
Phosphate release occurs concomitantly with trailing head dissociation (1, 2, 20). Therefore, measuring its release kinetics should provide an independent measure of ke. We accomplished this by mixing a complex of K413BIO-microtubules with a range of ATP concentrations in the presence of a fluorescently labeled phosphate-binding protein (28) and compared our results to K349. The resulting fluorescence transient consisted of an initial exponential, burst phase, followed by a linear increase, which could be described by the following relationship,
| (Eq. 2) |
where F(t) is the time-dependent fluorescence, λp is the rate of phosphate release in the burst phase, and kss is the steady-state rate at the microtubule concentration achieved after mixing in the stopped flow. If phosphate release were tightly coupled to dissociation, values of λP and λATP should be nearly identical. This is confirmed in Fig. 3 for both K413BIO (open circles) and K349 (closed circles). Furthermore, the extrapolated value of λp at infinite [ATP], kp, should be essentially identical to ke. As Table I indicates, this is the case for both monomeric and dimeric kinesin constructs. Finally, our results with phosphate release kinetics confirm the results from turbidity and fluorescence, namely that the effective rate constant for trailing head dissociation is not accelerated by forward strain.
Dissociation of K413BIO-Microtubule by ADP
In the absence of added nucleotide, kinesin attaches to the microtubule via only one motor domain (7, 8, 29, 30). This is illustrated in Fig. 1 by the upper left kinesin-microtubule complex. If ADP is added, it will bind to the empty catalytic site of the attached (green) head and dissociate the complex (17). This reaction would occur in the absence of internal strain, because ADP does not induce forward stepping and strong attachment of the other, tethered (magenta) head. We would, therefore, predict that the kinetics of K413BIO and K349 dissociation from the microtubule should be identical. This is confirmed by comparing the solid (K413BIO) and dashed (K349) curves in the inset of Fig. 4. ADP-induced dissociation was monitored by turbidity and by the AEDANS probe. Data for turbidity (closed symbols) and AEDANS (open symbols) are nearly identical and showed a hyperbolic dependence on [ADP] for both K413BIO and K349, defining maximum rates and apparent dissociation constants of 201 ± 27 s−1 and 154 ± 58 μm and 219 ± 16 s−1 and 123 ± 19 μm, respectively.
Fig. 4. Kinetics of K413BIO dissociation from the microtubule by ADP.
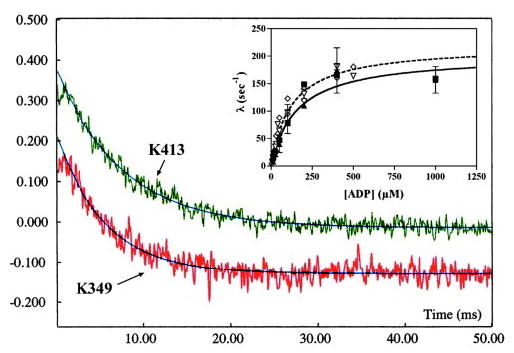
Fluorescence transients produced by mixing a 1:10 AEDANS-labeled K413BIO-microtubule (green) or a 1:10 AEDANS-labeled K349-microtubule (red) complex with 400 μm ADP (final concentration). The jagged curves are the fluorescence decays, and the black smooth curves are fits to a single-exponential process, defining rate constants for K413 and K349 of 161 and 174 s−1, respectively. Inset: a plot of the observed rate constant λ versus [ADP]. Fitting of the AEDANS data for K413BIO (solid curve) and K349 (dashed curve) to hyperbolae demonstrate nearly identical values for maximum rate and apparent affinity (see text for details). Rates for K413 AEDANS fluorescence (open triangles) and turbidity decrease (closed boxes) are nearly identical to each other, as are those for K349 AEDANS fluorescence (open diamonds) and turbidity (closed triangles). Conditions as in Fig. 3.
ADP dissociates wild-type kinesin from the microtubule at a rate of 312 s−1 (17, 31). This is considerably slower than kcat under processive conditions, under conditions where strain would be present, and this finding has been used to support the argument that trailing head dissociation is accelerated by forward strain (17). If processivity depended solely on this mechanism, it would follow that any mutation in kinesin that accelerates the rate of ADP-induced dissociation in the absence of strain should reduce average run length proportionally. Nevertheless, our data show that, although the rate of ADP-induced dissociation for K413BIO is nearly 19-fold larger than for wild-type, mean run length is only reduced 2- to 3-fold (Fig. 2).
Evaluation of the Effect of Rearward Strain on the Leading Head
We next set out to examine the effect of rearward strain on the leading head by measuring the kinetics of 2′-deoxy-mant-ATP (2′dmT) binding to a K413BIO-microtubule complex. Binding of 2′dmT was monitored by FRET from kinesin tyrosine residues to the mant fluorophor, as previously described (18), and the experimental design is illustrated in Fig. 5A.
Fig. 5. Kinetics of nucleotide binding to a processively moving kinesin dimer.
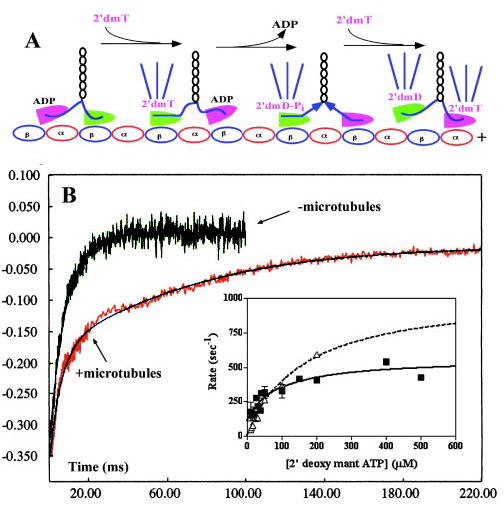
A, depiction of the expected changes in mant fluorescence emission produced by mixing a 1:10 K413BIO-microtubule complex with 2′-deoxy-mant-ATP (2′dmT) in the stopped flow. The fluorescent nucleotide is depicted by the magenta labeling, and the mant fluorescence emission is represented by the blue rays emanating from each motor domain. B, fluorescence transients produced by mixing a 1:10 K413BIO-microtubule complex (red transient) or an equimolar concentration of nucleotide-free K413BIO (green transient) with 100 mm 2′dmT (final concentration) in the stopped flow. Although the transient for K413BIO could be fit to a single-exponential process with rate constant of 362 s−1, which in the presence of microtubules consisted of two distinct phases separated by a lag. The smooth curve is the fit to two exponential processes plus a lag, with rate constants of 328 and 27 s−1 and an amplitude ratio of 0.58:0.42. Inset, plot of the rate of the faster phase (closed boxes and solid curve) for K413BIO-microtubules versus [2′dmT], compared with corresponding data for K413BIO alone (open boxes and dotted curve).
In the absence of microtubules, binding of 2′dmT to nucleotide-free K413BIO produced a fluorescence increase characterized by a single phase (Fig. 5B,–microtubules). The rate depended hyperbolically on [2′dmT], defining a maximum of 1033 ± 153 s−1 (Fig. 5B, inset, dotted curve). By contrast, mixing a 1:10 K413BIO-microtubule complex with 2′dmT produced a fluorescence increase that occurred in two distinct phases of similar amplitudes, separated by a lag (Fig. 5B,–microtubules). The rate of the first phase showed a hyperbolic dependence on 2′dmT concentration, defining a maximum rate of 457 ± 56 s−1, an apparent affinity of 80 ± 49 μm, and an apparent dissociation rate constant of 107 ± 50 s−1 (Fig. 5B, inset, solid curve). The amplitude of this phase is approximately half of that for an equal concentration of K413 in the absence of microtubules. Repeating these experiments in the presence of microtubules alone produced no fluorescence change (data not shown). These findings led us to conclude that the first phase in this transient is due to 2′dmT binding to the attached, nucleotide-free head. The rate of the second rising phase also showed a hyperbolic dependence on [2′dmT], defining a maximum rate of 39 ± 4 s−1 and an apparent affinity of 39 ± 10 μm (Fig. 6, inset, dotted curve). Given that the amplitudes and the apparent affinities of the two phases of the fluorescence transient are similar, we propose that the second phase in the transient is due to binding of 2′dmT to the leading head of a doubly attached kinesin-microtubule complex.
Fig. 6. Comparison of kinetics of 2′dmD release to 2′dmT binding to the leading head.
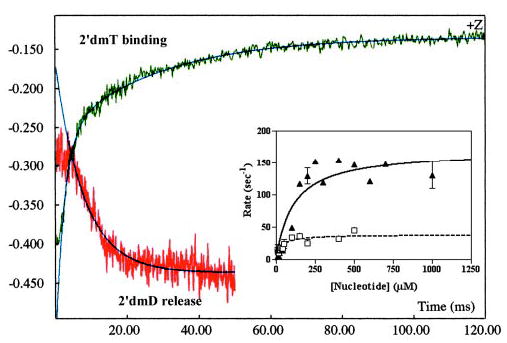
The fluorescence transient produced by binding of 2′dmT to processively moving kinesin is reproduced from Fig. 6 as the green transient in this figure. This is compared with the fluorescence transient associated with 2′dmD release from the leading head. This reaction fit a single-exponential decay whose rate constant showed hyperbolic dependence on [ATP] (inset and solid curve), defining a maximum rate of 170 ± 17 s−1. Fitting of the data for 2′dmT binding (green transient) to two exponential terms plus a lag demonstrated that the slower phase also fit a hyperbola, defining a maximum rate of 39 ± 4 s−1 (inset and dotted curve).
Why is the rate of ATP binding to the leading head so much slower than that for the trailing head? One possibility is that it is rate-limited by the dissociation of bound ADP. To determine if this is the case, we measured the rate of 2′dmD dissociation from the tethered head by mixing a complex of K413BIO-2′dmD plus a 10-fold molar excess of microtubules with varying concentrations of ATP in the stopped flow. The resulting fluorescence transient consisted of a single falling phase whose rate depended hyperbolically on ATP concentration, defining a maximum rate constant of 170 ± 17 s−1 (Fig. 6, inset, solid curve). This is over four times faster than the rate of binding of 2′dmT to this head (Fig. 6, inset, dotted curve). Thus, nucleotide binding to the leading head of a doubly attached kinesin-microtubule complex is rate-limited by some process other than ADP release, and we propose that this process consists of a rearward strain imposed on this head.
We can test our hypothesis that ATP binding to the leading head is strain-inhibited by examining the effect of AMPPNP on ADP-induced kinesin dissociation. Adding AMPPNP to a kinesin-microtubule complex induces the two neck linkers to separate from each other, in a manner similar to what is seen when kinesin takes a forward step with ATP binding (18). This occurs hand-in-hand with an acceleration of ADP release from the tethered head (8, 19) and leads to strong binding of both heads to the microtubule (29, 30) and to immobilization of both neck linkers (18). Furthermore, at equilibrium, the stoichiometry of nucleotide binding is 1 mol of AMPPNP:2.4 mol of active sites (32). Taken together, these results indicate that AMPPNP binding to the tethered head causes both heads to bind strongly, with the trailing head containing AMPPNP, with the leading head nucleotide-free, and with both heads under strain. This is illustrated in the left half of Fig. 7A. Furthermore, adding ADP to this system will cause one of the two heads to dissociate, leaving one head strongly bound, as illustrated in the right half of Fig. 7A (29, 30). If rearward strain inhibits nucleotide binding to the leading head, we would predict that mixing a kinesin-microtubule complex plus 1 mm AMPPNP in the stopped flow with ADP will dissociate from the leading head very slowly when compared with ADP-induced dissociation in the absence of AMPPNP (Fig. 4).
Fig. 7. Effect of AMPPNP on kinetics of ADP binding to the leading head.
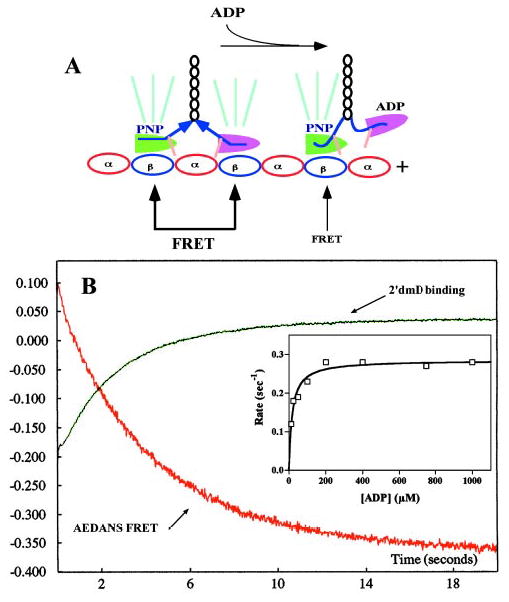
A, depiction of the expected changes in AEDANS FRET produced by mixing an AEDANS-labeled K413BIO-microtubule complex plus AMPPNP with ADP. The tan bars represent the AEDANS probe attached to cysteine 333 on the neck linker, and the green rays represent AEDANS emission induced by energy transfer from microtubule tryptophans. B, mixing a 1:10 AEDANS-labeled K413BIO-microtubule complex plus 2 mm AMPPNP with 400 mm ADP (final concentration) produced a decrease in AEDANS FRET emission (red transient) with a rate constant of 0.28 s−1. Mixing a similar but unlabeled complex with 400 mm 2′dmD (final concentration) produced a rise in mant fluorescence emission with a rate constant of 0.29 s−1. Inset, plot of the rate of the AEDANS fluorescence decrease versus [ATP]. Fitting to a hyperbola defines a maximum rate of 0.29 ± 0.008 s−1 and an apparent second order rate constant for ADP binding of 0.016 μm−1 s−1. This compares to a value of 1.31 μm−1 s−1 in the absence of AMPPNP (Fig. 3, inset).
We measured the kinetics of leading head dissociation by mixing a complex of 1:10 AEDANS-labeled K413BIO:microtuble plus 1 mm AMPPNP with a range of ADP concentrations, as illustrated in Fig. 7A. An example of the fluorescence transient produced by mixing with 400 mm ADP is depicted as the red jagged curve in the figure. Its rate demonstrated a hyperbolic dependence on ADP concentration, defining a maximum of 0.28 s−1, nearly three orders of magnitude slower than seen in the absence of AMPPNP (Fig. 4, inset). The apparent second order rate constant for this process, at 0.016 μm−1 s−1, compares to a value of 1.31 μm −1 s−1 in the absence of AMPPNP (Fig. 3, inset). Similar results were also seen using the rhodamine probe (data not shown).
To be sure that the fluorescence changes detected with the AEDANS probe are indeed due to the effects of ADP binding, we directly measured the kinetics of 2′dmD binding to a 1:10 kinesin-microtubule complex in the presence of 1 mm AMPPNP as described above (Figs. 5 and 6). As shown in Fig. 7B, the rate of the fluorescence rise produced by mixing with 400 μm 2′dmD (final concentration), at 0.29 s−1, was nearly identical to the rate of the fluorescence decrease seen with the AEDANS probe.
DISCUSSION
The most significant finding of this study is that strain appears to affect one discrete step in the kinesin mechano-chemical cycle: binding of ATP to the leading head. This conclusion is supported not only by direct evidence from 2′dmT binding kinetics (Figs. 5 and 6) but also from the effect of AMPPNP on nucleotide binding and nucleotide-induced dissociation (Fig. 7). If rearward strain effectively blocks ATP binding to the leading head, we can predict how fast ATP binding can occur by using the values of the rate constants we measured in this study. According to our model, ATP binding can only occur after ADP dissociation from the leading head (kdADP) and trailing head dissociation (ke). Because these two steps are irreversible under the conditions of our experiments, at infinite ATP concentration, the rate of binding will be equal to (kdADP · ke)/(kdADP + ke). Inserting the data from Table I and Fig. 6, we arrive at a value of 37 ± 2 s−1, which is in remarkable agreement with the measured value of 39 ± 4 s−1 (Fig. 6). Our conclusion is directly supported by recent single molecule mechanical studies, which show that external load imposed against the direction of motility reduces ADP binding (38). Hence, we conclude that internal load insures that the two heads of a processive kinesin remain out of phase for many mechanochemical cycles by hindering nucleotide binding to the leading head.
The inset of Fig. 7 demonstrates that the second order rate constant for ADP binding is reduced at least two orders of magnitude in the presence of rearward strain. This implies that strain makes the catalytic site relatively inaccessible to nucleotide. Furthermore, we have shown that kinesin:nucleotide is an equilibrium mixture of two states (15). Taken together, these results suggest that the effect of rearward strain is to drive an equilibrium distribution of catalytic site conformations to favor one that is relatively “closed” and inaccessible to nucleotide binding.
Our results also provide a critical test of a recently proposed “inchworm” model of kinesin movement (33). In this model, the leading motor is always leading, the trailing motor is always trailing, and one motor remains enzymatically inactive throughout a processive run. Our data show that binding of 2′dmT occurs in two distinct phases (Fig. 5B, red transient), and the rates of both of these phases are considerably faster than kcat. This means that a processive kinesin moving on a microtubule reaches the steady state after two nucleotide-binding events. This is both consistent with and required by a hand-over-hand mechanism, such as the one depicted in Fig. 1. However, it is inconsistent with an inchworm mechanism, which would predict only one nucleotide-binding event before the steady state is reached.
Our model explains how processive movement by kinesin can be both efficient and adaptable. By preventing ATP binding to the lead head, internal strain guarantees that this head will remain strongly attached to the microtubule at the moment that the trailing head dissociates. ATP would then bind rapidly to the leading head (>1000 s−1), but hydrolysis and subsequent dissociation would still be relatively slow (ke = 48–55 s−1, Table I). This disparity would give the trailing head time to swing forward and associate with the microtubule, because we have shown (18) that this process is very rapid (~800 s−1). Processivity would therefore result from two features of the mechanochemical cycle: blocking of ATP binding to the leading head by strain, and very rapid forward stepping of the trailing head and its concomitant docking to the microtubule surface (Fig. 1). A particular advantage of this arrangement is that, if the tethered head were to come across an obstacle during its forward swing, the entire kinesin molecule would dissociate at a rate defined by ke. This feature would enable kinesin to sidestep an obstruction, diffuse to another microtubule, and continue on with its journey.
Does forward strain have any effect on the trailing head? A variety of mechanical studies have suggested that it accelerates trailing head dissociation (1, 9, 29). However, our data with K413BIO does not support this. The effective rate constant for dissociation, ke, was in fact slower for dimeric kinesin than for a monomeric construct. As we have shown (Equation 1), ke is a composite rate constant and depends on the rates of ATP hydrolysis (kh) and microtubule dissociation (kdMT). Direct measurements using chemical quench methods have consistently shown that, although kh is ~100 s−1 for dimeric constructs, it is considerably faster for monomers, with estimates placing it at >250 s−1 (2, 20, 22). On the other hand, our previous studies with K349 show that the rate of docking of the neck linker places an upper limit on kh of ~800 s−1 (23). We have performed fitting to the data in Fig. 3 to obtain values of kdMT for monomeric and dimeric kinesins, using values of kh of 100 s−1 for K413 and the limiting values of 300 s−1 and 800 s−1 for K349. These reveal values of kdMT of 122 ± 27 s−1 for K413 and 143 ± 16 s−1 (kh = 300) and 111 ± 10 s−1 (kh = 800) for K349. Thus, even when correcting for differences in the kinetics of ATP hydrolysis between monomeric and dimeric constructs, we find that kdMT is relatively unaffected by forward strain.
However, K413BIO is a mutant construct that has eliminated all the surface-reactive cysteines. Hence, it may still be possible that forward strain has some effect on the processivity of wild-type kinesin. Our kinetic characterizations of K349 and K413 has shown that only one step in the mechanochemical cycle is affected (18, 23, and this work). This is the rate of ADP-induced dissociation, which is accelerated 19-fold compared with wild-type (Fig. 4). Furthermore, although K413BIO is processive and has near wild-type in vitro velocities, its mean run length is reduced ~2- to 3-fold (Fig. 2). Thus, it is possible that forward strain may accelerate trailing head dissociation in wild-type kinesin. However, even if this were the case, the degree of acceleration would be relatively small, amounting to no more than a factor of 2 or 3. This degree of acceleration is almost identical to the value predicted by Uemura et al. (29) using unbinding force measurements. Thus, our data with K413BIO clearly shows that, although a forward strain-induced dissociation mechanism may modulate the length of a processive run, it is not required for processivity.
In summary, this study has shown that the internal strain generated by kinesin during its mechanochemical cycle provides a mechanism that supports processivity. The major effect of strain is to markedly slow ATP binding to the leading head, an effect that guarantees that the two motor domains remain out of phase of each other during multiple mechanochemical cycles. Although strain may also accelerate dissociation of the trailing head, our results show that this effect is not necessary for processive movement. Finally, the strain-dependent mechanism that we describe may have more general applicability. Other molecular motors, such as myosins V and VI are also processive (34–36). Like kinesin, these motors need a mechanism to keep their individual motor units out of phase enzymatically to prevent premature dissociation from actin. Several of the methods developed in this study are directly applicable to these motors and may be useful in future studies to elucidate the mechanisms underlying their processivity.
Acknowledgments
We thank Dr. Shin’ichi Ishiwata (Waseda University, Japan) for his thoughtful review of our manuscript.
Footnotes
The abbreviations used are: PIPES, 1,4-piperazinediethanesulfonic acid; AMPPNP, 5′-adenylyl-b,g-imidodiphosphate; 2′dmD, 2′-deoxy-mant-ADP; 2′dmT, 2′-deoxy-mant-ATP; FRET, fluorescence resonance energy transfer; MDCC, N-[2-(1-maleimidyl)ethyl]-7-(diethylamino)-coumarin-3-carboxamide; TMR, tetramethyl rhodamine maleimide; AEDANS, S-(((2-acetyl)amino)ethyl)aminonaphthalene-1-sulfonic acid.
References
- 1.Hancock WO, Howard J. Proc Natl Acad Sci U S A. 1999;96:13147–13152. doi: 10.1073/pnas.96.23.13147. [DOI] [PMC free article] [PubMed] [Google Scholar]
- 2.Ma YZ, Taylor EW. J Biol Chem. 1997;272:717–723. doi: 10.1074/jbc.272.2.717. [DOI] [PubMed] [Google Scholar]
- 3.Vale RD, Milligan RA. Science. 2000;288:88–95. doi: 10.1126/science.288.5463.88. [DOI] [PubMed] [Google Scholar]
- 4.Jiang W, Stock MF, Li X, Hackney DD. J Biol Chem. 1997;272:7626–7632. doi: 10.1074/jbc.272.12.7626. [DOI] [PubMed] [Google Scholar]
- 5.Schnitzer MJ, Visscher K, Block SM. Nat Cell Biol. 2000;2:718–723. doi: 10.1038/35036345. [DOI] [PubMed] [Google Scholar]
- 6.Visscher K, Schnitzer MJ, Block SM. Nature. 1999;400:184–189. doi: 10.1038/22146. [DOI] [PubMed] [Google Scholar]
- 7.Hackney DD. Proc Natl Acad Sci U S A. 1994;91:6865–6869. doi: 10.1073/pnas.91.15.6865. [DOI] [PMC free article] [PubMed] [Google Scholar]
- 8.Ma YZ, Taylor EW. J Biol Chem. 1997;272:724–730. doi: 10.1074/jbc.272.2.724. [DOI] [PubMed] [Google Scholar]
- 9.Crevel I, Carter N, Schliwa M, Cross R. EMBO J. 1999;18:5863–5872. doi: 10.1093/emboj/18.21.5863. [DOI] [PMC free article] [PubMed] [Google Scholar]
- 10.Young EC, Mahtani HK, Gelles J. Biochemistry. 1998;37:3467–3479. doi: 10.1021/bi972172n. [DOI] [PubMed] [Google Scholar]
- 11.Kozielski F, Sack S, Marx A, Thormahlen M, Schonbrunn E, Blou V, Thompson A, Mandelkow EM, Mandelkow E. Cell. 1997;91:985–994. doi: 10.1016/s0092-8674(00)80489-4. [DOI] [PubMed] [Google Scholar]
- 12.Rice S, Lin AW, Safer D, Hart CL, Naber N, Carragher BO, Cain SM, Pechatnikova E, Wilson-Kubalek EM, Whittaker M, Pate E, Cooke R, Taylor EW, Vale R. Nature. 1999;402:778–784. doi: 10.1038/45483. [DOI] [PubMed] [Google Scholar]
- 13.Schief WR, Howard J. Curr Opin Cell Biol. 2001;13:19–28. doi: 10.1016/s0955-0674(00)00169-1. [DOI] [PubMed] [Google Scholar]
- 14.Cross RA, Crevel I, Carter NJ, Alonso C, Hirose K, Amos LA. Phil Trans R Soc Lond-Biol Sci. 2000;355:459–464. doi: 10.1098/rstb.2000.0587. [DOI] [PMC free article] [PubMed] [Google Scholar]
- 15.Xing J, Wriggers W, Jefferson GM, Stein R, Cheung HC, Rosenfeld SS. J Biol Chem. 2000;275:35413–35420. doi: 10.1074/jbc.M004232200. [DOI] [PubMed] [Google Scholar]
- 16.Derenyi I, Vicsek T. Proc Natl Acad Sci U S A. 1996;93:6775–6779. doi: 10.1073/pnas.93.13.6775. [DOI] [PMC free article] [PubMed] [Google Scholar]
- 17.Hackney DD. Biochemistry. 2002;41:4437–4446. doi: 10.1021/bi0159229. [DOI] [PubMed] [Google Scholar]
- 18.Rosenfeld SS, Xing J, Jefferson GM, Cheung HC, King PH. J Biol Chem. 2002;277:36731–36739. doi: 10.1074/jbc.M205261200. [DOI] [PubMed] [Google Scholar]
- 19.Gilbert SP, Moyer ML, Johnson KA. Biochemistry. 1998;37:792–799. doi: 10.1021/bi971117b. [DOI] [PubMed] [Google Scholar]
- 20.Moyer ML, Gilbert SP, Johnson KA. Biochemistry. 1998;37:800–813. doi: 10.1021/bi9711184. [DOI] [PubMed] [Google Scholar]
- 21.Brendza KM, Sontag CA, Saxton WM, Gilbert SP. J Biol Chem. 2000;275:22187–22195. doi: 10.1074/jbc.M001124200. [DOI] [PMC free article] [PubMed] [Google Scholar]
- 22.Farrell CM, Mackey AJ, Klumpp LM, Gilbert SP. J Biol Chem. 2002;277:17079–17087. doi: 10.1074/jbc.M108793200. [DOI] [PubMed] [Google Scholar]
- 23.Rosenfeld SS, Jefferson GM, King PH. J Biol Chem. 2001;276:40167–40174. doi: 10.1074/jbc.M103899200. [DOI] [PubMed] [Google Scholar]
- 24.Schnitzer MJ, Block SM. Nature. 1997;388:386–390. doi: 10.1038/41111. [DOI] [PubMed] [Google Scholar]
- 25.Gelles J, Schnapp BJ, Sheetz MP. Nature. 1988;331:450–453. doi: 10.1038/331450a0. [DOI] [PubMed] [Google Scholar]
- 26.Brune M, Hunter JL, Corrie JET, Webb MR. Biochemistry. 1994;33:8262–8271. doi: 10.1021/bi00193a013. [DOI] [PubMed] [Google Scholar]
- 27.Svoboda K, Block SM. Cell. 1994;77:773–784. doi: 10.1016/0092-8674(94)90060-4. [DOI] [PubMed] [Google Scholar]
- 28.Gilbert SP, Webb MR, Brune M, Johnson KA. Nature. 1995;373:671–676. doi: 10.1038/373671a0. [DOI] [PMC free article] [PubMed] [Google Scholar]
- 29.Uemura S, Kawaguchi K, Yajima J, Edamatsu M, Toyoshima YY, Ishiwata S. Proc Natl Acad Sci U S A. 2002;99:5977–5981. doi: 10.1073/pnas.092546199. [DOI] [PMC free article] [PubMed] [Google Scholar]
- 30.Kawaguchi K, Ishiwata SI. Science. 2001;291:667–669. doi: 10.1126/science.291.5504.667. [DOI] [PubMed] [Google Scholar]
- 31.Ma YZ, Taylor EW. Biochemistry. 1995;34:13242–13251. doi: 10.1021/bi00040a040. [DOI] [PubMed] [Google Scholar]
- 32.Schnapp BJ, Crise B, Sheetz MP, Reese TS, Khan S. Proc Natl Acad Sci U S A. 1990;90:10053–10057. doi: 10.1073/pnas.87.24.10053. [DOI] [PMC free article] [PubMed] [Google Scholar]
- 33.Hua W, Chung J, Gelles J. Science. 2002;295:844–848. doi: 10.1126/science.1063089. [DOI] [PubMed] [Google Scholar]
- 34.Veigel C, Wang F, Bartoo ML, Sellers JR, Molloy JE. Nat Cell Biol. 2002;4:59–65. doi: 10.1038/ncb732. [DOI] [PubMed] [Google Scholar]
- 35.Rief M, Rock RS, Mehta AD, Mooseker MS, Cheney RE, Spudich JA. Proc Natl Acad Sci U S A. 2000;97:9482–9486. doi: 10.1073/pnas.97.17.9482. [DOI] [PMC free article] [PubMed] [Google Scholar]
- 36.De La Cruz EM, Ostap EM, Sweeney HL. J Biol Chem. 2001;276:32373–32381. doi: 10.1074/jbc.M104136200. [DOI] [PubMed] [Google Scholar]
- 37.Block SM, Asbury CL, Shaevitz JW, Lang MJ. Proc Nat Acad Sci U S A. 2003;100:2351–2356. doi: 10.1073/pnas.0436709100. [DOI] [PMC free article] [PubMed] [Google Scholar]
- 38.Uemura S, Ishiwata S. Nat Struct Biol. 2003;10:308–311. doi: 10.1038/nsb911. [DOI] [PubMed] [Google Scholar]