Abstract
As part of the ongoing effort to study the mechanical behavior of biological material during cryopreservation processes, the current study focuses on thermal expansion of blood vessels at low cryogenic temperatures. The current paper (Part I) describes a new experimental device for thermal expansion measurements of blood vessels in typical conditions of vitrification, which are associated with rapid cooling rates. For validation purposes, the thermal strain of frozen arteries in the absence of cryoprotectants was measured, and found to be about 10% larger than that of polycrystalline water; this observation agrees with literature data. The companion paper (Part II) reports on experimental results of cryoprotectants permeated with VS55, DP6 and 7.05M DMSO at high cooling rates applicable to vitrification.
Keywords: Blood Vessels, Thermal Expansion, Vitrification, Cryopreservation, Continuum Mechanics, Thermo-Mechanical Stress
Introduction
Vitrification is an alternative to conventional cryopreservation of biological materials (vitreous in Latin means glass), first suggested by Luyet [4], but applied successfully only in recent years [13,15,16]. Here, ice formation, considered to be the basis of cryoinjury, is completely prevented due to the presence of high cryoprotectant concentrations, strongly interacting with water. No appreciable degradation occurs over time in living matter trapped within a vitreous matrix, and vitrification is potentially applicable to all biological systems.
The cooling rate threshold above which glass forms (also known as the “critical cooling rate”) is a physical property of the specific cryoprotectant and its concentration, and may vary significantly among different cryoprotectants. In bulky tissues and large organs, the critical cooling rate may not be achievable at the center of the specimen, due to heat transfer considerations, even when subjected to an extremely rapid cooling rate on the outer surface of the specimen. Moreover, when vitrification with a specific cryoprotectant is achievable in bulky tissues and organs, it is typically associated with large variations in temperature and cooling rate across the specimen. These variations lead to size limitations on tissues and organs during vitrification.
A dramatic effect associated with a significant temperature distribution in a specimen is the phenomenon of thermal expansion. All materials tend to change volume with the change in temperature, typically in the order of 0.01% per degree Celsius for biomaterials, as well as for many engineering materials. The thermophysical property representing this tendency is defined as the “thermal expansion,” and the amount of expansion (or contraction) with respect to the original size is defined as “thermal strain.” In the case of a non-uniform temperature distribution, a non-uniform tendency to expand (leading to a non-uniform thermal strain) develops. For example, the outer surface tends to contract more during an inward cooling process, as is the case in the cooling phase of cryopreservation. Since the outer layer of the material cannot overlap with inner layers, stress develops to make contraction of different layers compatible [9,11]. If this stress exceeds the strength of the material, structural damage follows, either in the form of plastic (permanent) deformations, or fractures. The mechanical stress originating from thermal strain is known as “thermo-mechanical stress.” Hence, reducing the thermo-mechanical stress during cryopreservation, on one hand, and increasing the cooling rate at the center of large biological specimens, on the other hand, represent competing needs.
As part of the ongoing effort to study the mechanical behavior of biological material in cryopreservation processes, the current study focuses on thermal expansion of blood vessels at low cryogenic temperatures. The current paper (Part I) describes a new experimental device for thermal expansion measurements of blood vessels in conditions typical of vitrification, which are associated with rapid cooling rates. The current paper also reports on a calibration technique using metallic specimens, and validation experiments on blood vessel specimens in the absence of cryoprotectants. The companion paper (Part II, [3]), reports on experimental results of cryoprotectants permeated with VS55, DP6 and 7.05M DMSO, where VS55 and DP6 are cryoprotectant cocktails of significant interest in the development of vitrification technology, and 7.05M DMSO has been established as a reference solution in previous studies [7].
Experimental Setup
With reference to Fig. 1, the experimental system consists of six units: (1) a cooling chamber; (2) a low pressure cooling unit for slow cooling or constant temperature holding; (3) a high pressure cooling unit for rapid cooling; (4) a close-loop electrical heating unit for thermal control of the cooling chamber; (5) a computerized sensory unit to record specimen elongation and thermal history; and (6) a specimen gripping unit and telescopic glass tubing for displacement measurements, where the displacement sensor operates at room temperature. A more detailed schematic illustration of the cooling chamber assembly is presented in Fig. 2. The experimental system was designed and constructed at the Biothermal Technology Laboratory at Carnegie Mellon University.
Figure 1.
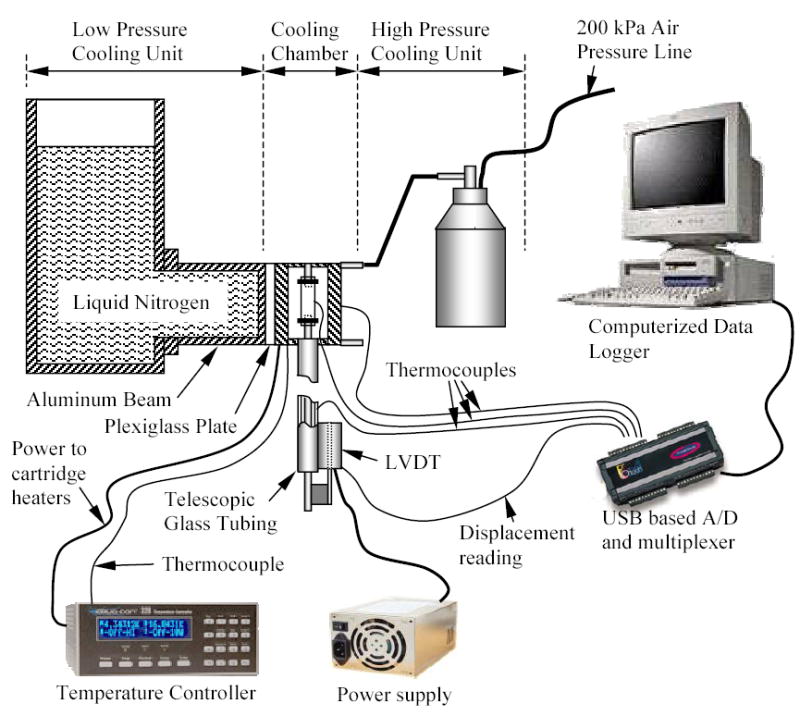
Schematic illustration of the experimental device for thermal expansion measurements
Figure 2.
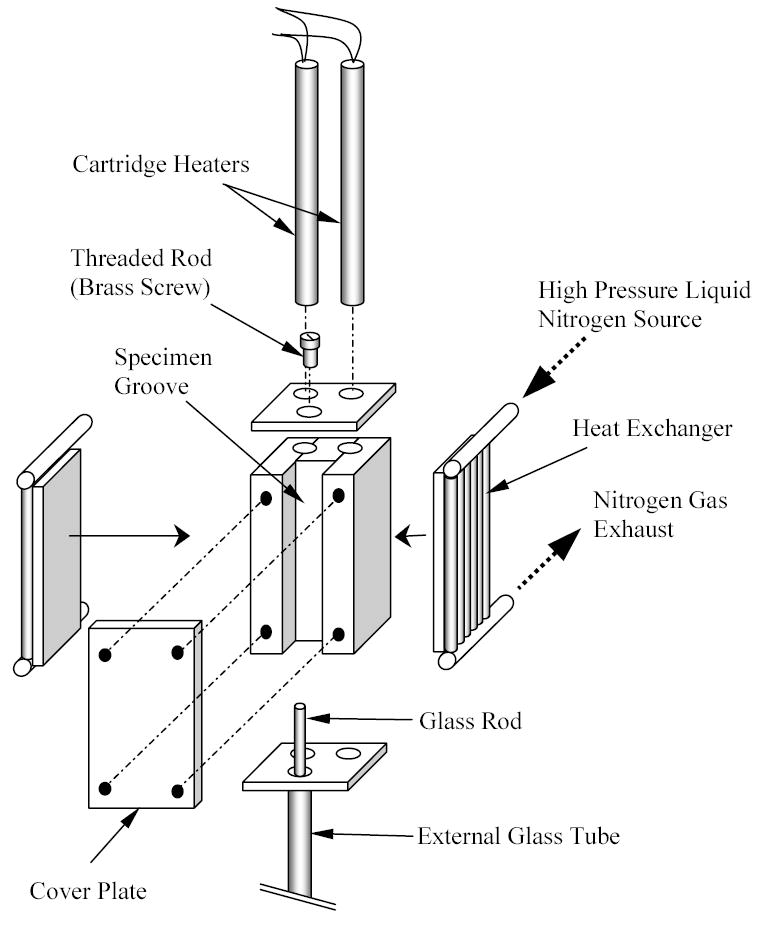
Schematic illustration of cooling chamber assembly
The cooling chamber is constructed of yellow brass block, having overall dimensions of 30 mm × 25 mm × 75 mm. Due to the high thermal conductivity of the brass (k=83 W/m-K) the cooling chamber behaves like a lumped system in the thermal sense. A groove is machined along one side of the block to accommodate the blood vessel specimen (groove dimensions are 10 mm × 14 mm × 75 mm). The specimen groove is covered with a 5 mm thick yellow brass plate, and connected with four screws. For slow cooling rates, the cooling chamber is screwed onto an aluminum beam extending from the low pressure cooling unit, which operates at standard atmospheric pressure. The contact face of the chamber with the aluminum beam is on the face opposite the chamber groove. A thin Plexiglass plate is placed between the cooling chamber and the aluminum beam at the surface of contact, acting as a thermal barrier. The Plexiglass plate passively controls the rate of heat conduction from the cooling chamber to the beam, and thereby controls the liquid nitrogen consumption in the low pressure cooling unit. Plexiglass plates in the thickness range of 1.5 to 3 mm were experimented on for this purpose, where a thicker plate decreases liquid nitrogen consumption, but also decreases the maximum possible cooling rate. The volume of the low pressure cooling system is 3 ℓ.
The high pressure cooling unit consists of two heat exchangers, a 2 ℓ vacuum insulated liquid nitrogen container, and a portable air pressure container. Each heat exchanger consists of a linear array of 14 tubes, 0.9 mm ID and 1.4 mm OD, soldered to a 3 mm thick copper base. One heat exchanger is connected on each side of the cooling chamber. The heat exchangers are connected in parallel to the high pressure liquid nitrogen container, which is pressurized to 200 kPa (~30 psi) by compressed air. The high pressure cooling system is operated manually by means of a spring-driven pressure valve, while the low pressure cooling unit is active continually throughout the experiment. The high pressure cooling system is set to reach a maximum cooling rate of 30ºC/min for the chamber. (The cooling rate for the current discussion is defined as the average rate of temperature change from 0ºC to −100ºC.) The same system can be set to cooling rates of up to 135ºC/min. Cooling rates higher than 30ºC/min were deemed unnecessary for the purpose of the current research, where the critical cooling rate for VS55 is 2.5ºC/min, which is higher than the critical cooling rate for DMSO [5,13]. The critical cooling rate for DP6 is largely unknown, but it is suggested to be around 40°C/min [12]. In general, cooling below the critical rate leads to volume expansion when water freezes--a far more dramatic effect than thermal expansion in a single phase (see discussion in the context of Fig. 6 below). The phase transition effect upon freezing was not observed for DP6 at 30°C/min. The minimum achievable temperature in this chamber is the liquid nitrogen boiling temperature of −196ºC.
Figure 6.
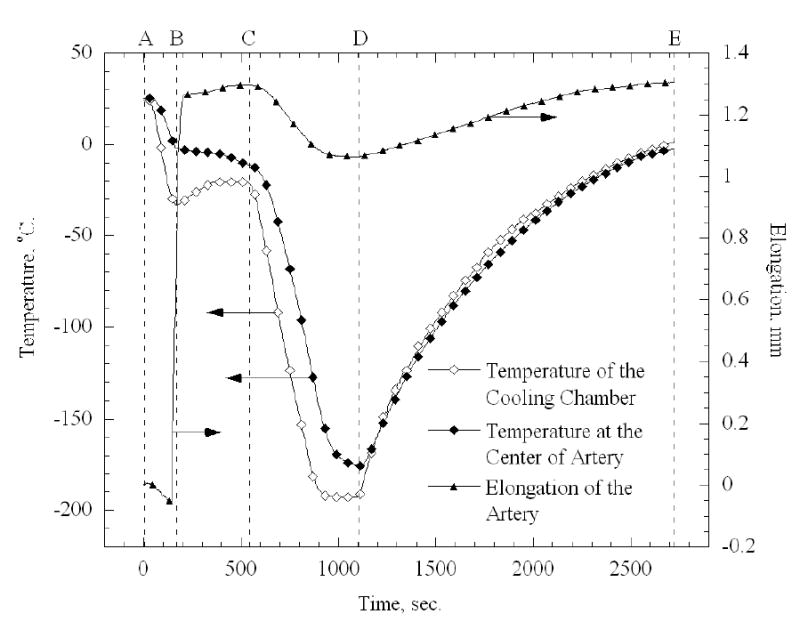
Thermal history of the cooling chamber and an artery sample during a typical thermal expansion experiment
Two cylindrical holes are drilled along the cooling chamber, to accommodate a pair of identical cartridge-electrical heaters (Gaumer, model A301-125), in the region between the groove and the side connected to the low pressure cooling unit. Each electrical heater has a diameter of 6.35 mm, a length of 75 mm, and an electrical resistance of 115Ω. The cartridge heaters are connected in parallel to a temperature controller and power supplier in one unit (Cryo-Con Model 32, with Kp set to 130), which supplies a maximum power of 45.5W under the resistance of these parallel heaters. A copper-constantan thermocouple (type T) is connected to the cooling chamber in a drilled hole between the electrical heaters and the groove of the chamber, which closes the feedback loop of the control system.
The computerized sensory unit is comprised of a regular desktop computer with a Universal Serial Bus (USB) port, a USB-based analog to digital (A/D) converter and multiplexer in one unit (OMEGA, OMB-DAQ 55, 0.015% uncertainty, 22 bit conversion), an array of T-type thermocouples (±0.5ºC uncertainty), a Linear Variable Differential Transformer (LVDT) sensor (OMEGA, LD400-5, 0.25% non-linearity, 56 mV/V-mm sensitivity), and a switched power supplier (Bestec, Model BPS-2004-4U, ±0.003V uncertainty) to excite the LVDT sensor at 12V. Temperature measurements at the cooling chamber and at the center of the blood vessel specimen were routinely recorded. For thermal analysis of the system, additional thermocouples were placed at various locations, as discussed below.
Since the output of the LVDT is sensitive to its temperature, and in order to maintain it at standard room temperature, a setup of telescopic glass tubing was used. The telescopic tubing is comprised of an external glass tube and a solid glass rod. The external tube is 290 mm long, 4 mm ID, and 6 mm OD. The glass rod is 400 mm long, and 3 mm in diameter. The external glass tube is vertically connected to the lower end of the cooling chamber groove, using a custom-made yellow brass connector. The LVDT coil is connected to the lower end of the same glass tube, and the core of the LVDT is connected to the glass rod. With reference to Fig. 3, the lower end of the blood vessel sample is connected onto the top end of the glass rod. The top end of the blood vessel sample is connected onto a threaded brass rod, which extends from a yellow brass plate, covering the top side of the cooling chamber groove.
Figure 3.
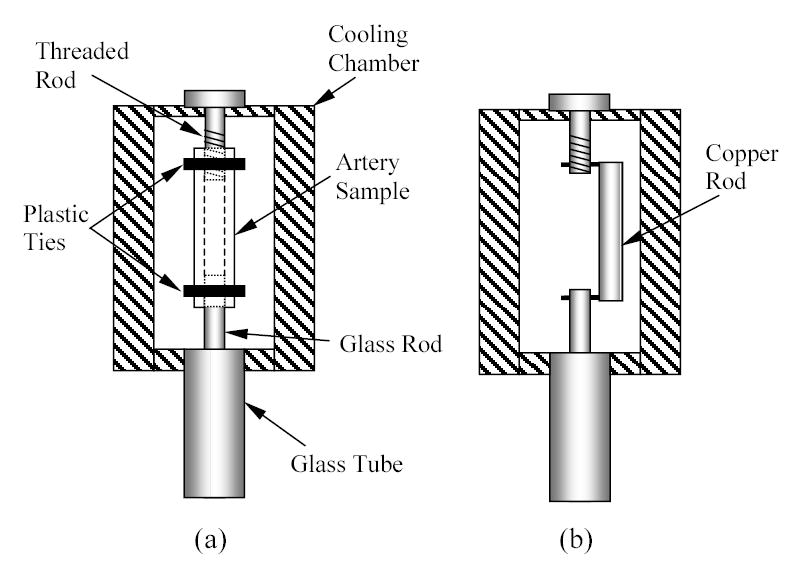
Schematic illustration of sample hookup of: (a) a blood vessel specimen, (b) a calibration copper rod
Both the cooling chamber and specimen contract with the decrease in temperature. The contraction of the cooling chamber, the telescopic tubing, and the blood vessel differ, which causes an axial movement of the glass rod inside the glass tube, which in turn moves the core of the LVDT with respect to its coil. The LVDT core movement is recorded through the USB-A/D converter and multiplexer, simultaneously with the thermal history of the specimen. This data is used to determine the thermal strain of the blood vessel and its thermal expansion coefficient, as described below.
Material and Methods
The new device is designed for thermal expansion during both crystallization and vitrification processes. The current paper focuses on the calibration procedure, and on experimental measurements of a goat artery model during crystallization, for validation purposes. The companion paper [3] focuses on thermal expansion during vitrification in the presence of various cryoprotectants.
Artery Samples Preparation
Tissue specimens from goats (which were sacrificed for other purposes), were donated by a local slaughterhouse. No animals were sacrificed specifically for the purpose of the current study. Artery segments were taken from either the main carotid artery (from smaller animals), or branches extending from the main carotid artery (from larger animals), where the emphasis was on the inner and outer diameters of the artery being compatible with the cooling chamber size. Tested samples had a diameter range of 4 to 6 mm, and a length range of 41 to 55mm. The wall thickness of the main carotid artery is about 1 mm, and the wall thickness of arteries extending from main carotid artery is about 0.5 mm. The wall thickness of the artery is expected to have no effect on the thermal expansion in a stress-free condition. Samples were immersed in a phosphate buffer saline solution (PBS) immediately after harvesting, and stored at 4ºC for a period between a few hours and five days. This time period was selected due to practical time constraints of specimen availability and duration of experiments. The emphasis in this study is maintaining the structure of blood vessels segment; viability post-thawing is deemed unimportant in this context. Moreover, thermal expansion measurements were essentially the same, whether after a few hours or after a few days of immersion in PBS. In total, ten experiments were performed on six blood vessel specimens, taken from six different animals. For the purpose of development of the current protocol and for training, seven additional experiments were performed, the data for which is not included in the current report.
Two experimental runs were repeated on each sample. Between every two consecutive runs, the artery sample was removed from the chamber and the process of preparation of the measurement setup repeated itself. The reason for repeated experiments on the same sample was to identify whether the thermal expansion property is affected by the number of freezing cycles. The reason for repeated preparations between consecutive experiments is to eliminate possible systematic errors due to preparation errors with the sample.
Method of Operation
First, the containers of both the low and the high pressure cooling units were filled with liquid nitrogen. A portable air pressure container was pressurized to 200 kPa, and connected to the high pressure liquid nitrogen container. The beam of the low pressure cooling unit was pre-cooled by filling the container with liquid nitrogen, until it reached steady state at its minimum temperature of −196ºC. During the pre-cooling stage, the electrical heating system was activated, and the cooling chamber temperature was maintained at the initial temperature of 20ºC.
During the pre-cooling stage, the blood vessel sample was connected with two plastic cable ties to the threaded brass rod and to the inner glass rod, as illustrated in Fig. 3(a). The cable ties were placed about 5 mm from each end of the sample. Next, the LVDT core holder was manually moved in the coil to a near-zero reading point. (The absolute zero point is not important and only the displacement is taken into account.) At least one thermocouple was attached to the center of the blood vessel sample. Two additional thermocouples were attached to the blood vessel sample in several experiments, adjacent to the top and bottom cable ties, to measure the actual temperature distribution along the sample (see discussion in the context of Fig. 9, below). Another thermocouple was attached to the glass tube near the LVDT coil, to verify that the coil temperature remains unchanged throughout the course of the experiment. The effective length of the specimen (the length between the plastic cable ties), was measured with a caliper, and the cooling chamber cover was screwed in place. At this point, the chamber containing the sample was ready for experimentation. The weight of the glass rod together with the LVDT core is 13.5 gr, which creates an average constant stress of less than 20 kPa in the blood vessel (the weight times free fall acceleration, divided by the average sample cross sectional area: 4 mm ID and 5 mm OD). This stress is at least two orders of magnitude smaller than the stress to fracture of the tissue, which is expected to be in the order of a few MPa [6,14]. The ability to measure thermal strain under such extremely low stresses was a design constraint for the current experimental system, where a device which creates significantly higher stresses in the sample has already been reported in the literature [10]. The low stress requirement is even more important for thermal expansion measurements during vitrification [3].
Figure 9.
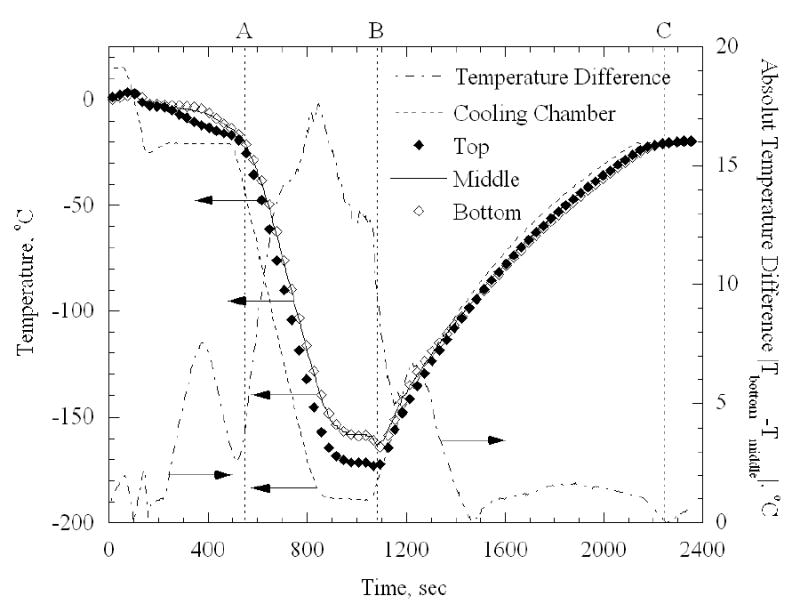
Measurements of the temperature distribution along a 42 mm artery sample at axial distances of 6, 20, and 35mm from the top plastic tie
In vitrification experiments, the experiment starts with the maximum possible cooling rate, down to about −90ºC (sample temperature). This high cooling rate is required to prevent crystallization and promote vitrification. An additional stage is performed in the absence of cryoprotectants, to compensate for the dramatic expansion upon crystallization (water crystallization is associated with about 3% linear thermal strain). Therefore, an additional temperature hold stage was added to the protocol for approximately 8 min at −20ºC, until crystallization of the sample is completed. Crystallization is assumed to be completed when the temperature at the center of the blood vessel (the warmest point in the specimen during cooling), reaches −20ºC.
Once the blood vessel specimen is frozen, the valve of the high pressure cooling chamber is manually opened, while the control system turns off the electrical heaters, leading to a maximum cooling rate. The pressure valve is turned off when the specimen temperature reaches a minimum temperature of −170ºC, and temperature control is taken over by the closed-loop electrical heating system. In the experiments reported here, the electrical heating system was operated at maximum power, yielding an initial warming rate of about 15ºC/min at −170ºC, which decays exponentially to about 2ºC/min at 20ºC. The reason for this decay in warming rate is that the low pressure cooling system continues to cool the system, while the resistance to heat transfer increases with the increase in temperature difference between the cooling chamber and the liquid nitrogen boiling temperature. Note that without the Plexiglass plate, the 45.5W supplied to the electrical heaters would not be enough to bring the cooling chamber temperature back to its initial temperature, while a thicker Plexiglass plate would lead to higher warming rates.
Data analysis
Under stress-free conditions (when neglecting the dead weight effect described above), the thermal strain is defined as:
| (1) |
where ΔL is the change in length, Lo is the initial length, and T is the temperature.
The thermal expansion coefficient is defined as the rate of change of thermal strain with temperature:
| (2) |
In the experimental device described above, the cooling chamber, a portion of the glass telescopic tubing, and the sample change their lengths. For the part of the telescopic tubing that is outside of the cooling chamber, both the glass rod and the external glass tube experience the same axial temperature distribution, and the change in length for both glass components is similar. Therefore, glass expansion outside of the cooling chamber does not contribute to the LVDT reading. Inside the cooling chamber however, the glass rod extends from the external tube, and the thermal expansion of this segment contributes to the displacement reading by the LVDT. The combined thermal expansion effect of the chamber and the glass rod is small compared to the tissue sample but not negligible, and it must be taken into account in data analysis. If the thermal expansion property of the specific glass material and brass are known to a high degree of certainty, their elongation can be predicted, and the thermal expansion of the sample can be determined from the LVDT reading. Unfortunately, the thermal expansion properties of those materials are not known to such a level of certainty, and the thermal expansion of that assembly must be found experimentally. The mathematical formulation to determine the thermal expansion of the sample is presented first, assuming that the thermal expansion of the system components is known. A calibration procedure is presented next, which was used to determine the thermal expansion of the system components.
The LVDT transient measurement is:
| (3) |
where ΔLs is the sample elongation, ΔLg is the elongation of the glass rod extending from the glass tube into the cooling chamber, ΔLc is the elongation of the cooling chamber, and t is time. Note that at the high cooling rates of experimentation (~30ºC/min), the temperatures of the sample, the glass rod, and chamber, are known (measured), but are significantly different from one another. Therefore, the analysis of the thermal expansion system is time-dependent. Equation (3) is rearranged to find the elongation of the sample:
| (4) |
where
| (5) |
where ΔL’g(Tc(t)) is the corrected elongation of the glass rod with respect to the chamber temperature, rather than with respect to the glass rod temperature, and C is a correction function based on the temperature difference between the chamber temperature and the glass rod temperature. This correction is cooling rate-dependent, and the calibration procedure takes this effect into account, as described below.
For data analysis purposes, Eq. (4) is rewritten in the form of:
| (6) |
where the corrected thermal strain of the glass, ɛ’g, and the thermal strain of the chamber, ɛc, were found experimentally, as discussed below. The length of the extended glass rod, Lg, is the difference between the overall length of the chamber, Lc, and the length of the sample, Ls. The term in brackets in Eq. (6) is referred to as the “calibration curve” in the current paper.
Calibration
In order to estimate the thermal strain of the assembly of the brass chamber and the glass rod, a calibration experiment was performed on a 99% pure copper rod as a sample, where the thermal expansion of copper is available in the literature [1]. Since two parameters are needed for an estimate, two copper rods of different lengths were used, yielding two equations and two unknowns in the mathematical sense. Rods in the length of 44 mm and 60 mm were selected for this purpose, which represent the length range of blood vessel segments experimented on in this study. In order to verify the quality of parametric estimation, the thermal strain of a third copper rod was measured, having a length of 51 mm. The third copper rod simulated the blood vessel sample, and results were compared with the known values for copper. The copper rods were connected to the glass rod and the brass threaded rod as illustrated in Fig. 3(b).
For calibration purposes, Eq. (4) was rearranged to the form:
| (7) |
where i equals 1 corresponds to a copper rod length of 44 mm, and i equals 2 corresponds to a copper rod length of 60 mm.
Both terms on the right hand side of Eq. (7) are known, where the thermal expansion coefficient of copper can be approximated using the coefficients listed in Table 1, and the elongation of the copper sample is calculated from:
Table 1.
Coefficients of best-fit polynomial approximation of thermal strain for various materials, approximated as ɛ = a4T4 +a3T3 +a2T2 +a1T, where R2 is the coefficient of determination. The zero-order term of thermal strain is omitted, since it represents a shift in strain, and is the only term dependent on the initial condition of the experiment. Furthermore, this term is typically not taken into account in solid mechanics analyses. Following Eq. (2), the thermal expansion coefficient is: β = 4a4T3 +3a3T2 +2a2T +a1
| a1×105 | a2×108 | a3×1011 | a4×1013 | R2 | Reference | |
|---|---|---|---|---|---|---|
| Water | 5.630 | 12.64 | - | - | 1.0000 | [8] |
| Copper | 1.658 | 1.344 | 7.340 | 3.923 | 0.9995 | [1] |
| Rabbit Muscle | 6.224 | 13.72 | −1.213 | - | 0.9999 | [10] |
| Chicken Muscle | 6.649 | 17.19 | 9.283 | - | 0.9994 | [10] |
| Beef Muscle | 7.225 | 19.17 | 7.800 | - | 0.9988 | [10] |
| Goat Arteries | 6.376 | 14.58 | - | - | 0.9999 | Current study |
| (8) |
Calibration experiments were performed down to a temperature of −185ºC. The experimental data of the left hand side term of Eq. (7) was represented using a second order best-fit polynomial approximation, compiling data from all n runs:
| (9) |
where values of 9.738×10⁻⁷, 1.202×10⁻³, 8.223×10⁻⁷, 1.283×10⁻³, were found for a2,1, a1,1, a2,2, a1,2, respectively. These values are based on n=5 for each copper rod, and are based on both the cooling and the rewarming stages (a total of 10 data sets). Experimental results and the best-fit polynomial approximation are show in Fig. 4. The initial value for calibration was taken when the cooling chamber reached a temperature of 0ºC. Note that the initial elongation is zero, and therefore the zero order term is excluded from Eq. (9).
Figure 4.
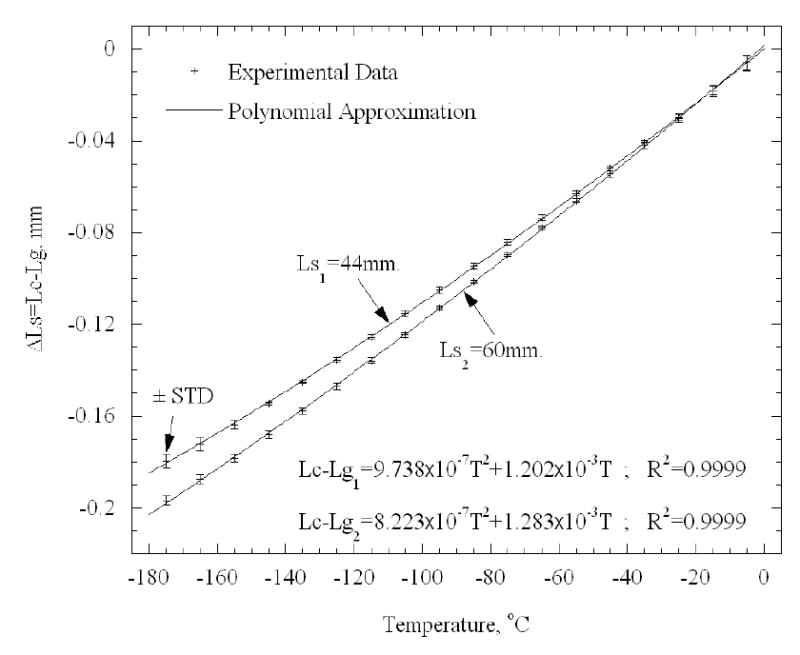
Calibration results for 44 mm and 60 mm copper rods
The elongation of the cooling chamber with respect to its temperature remains unchanged in different experiments. However, the elongation of the extended glass rod changes in different experiments, with the change in the length of its extended segment into the cooling chamber. Subtracting Eq. (9) of the first experiment from Eq. (9) of the second experiment, and rearranging the result, yields the glass thermal strain:
| (10) |
where the thermal expansion coefficient can be calculated from Eq. (2). Note that ɛ’g is the corrected thermal expansion of the glass, including the effect of the brass chamber, as defined in Eqs. (5)–(6). Going back to the results of one of the experiments, the thermal strain of the cooling chamber can now be found:
| (11) |
where i equals either 1 or 2.
Finally, the calibration and technique of measurement were verified by measuring the elongation of a third copper rod, having a length of 51 mm (Fig. 5). It can be seen from Fig. 5 that the agreement of experimental results and literature data [1] is better than 97% of full scale. For comparison, Fig. 5 also presents the elongation of the glass rod and of the brass chamber as a function of the cooling chamber temperature. Note that the elongation of the copper sample and the extended glass rod are about 40% and 10% of that of frozen water, respectively, where water was shown to have a thermal strain similar to that of frozen biological tissues in the absence of cryoprotectants [10]. It follows that the 3% difference shown in Fig. 5 is expected to have a negligible effect when thermal expansion of a tissue sample is measured. Uncertainty analysis for the new system is given in Appendix A of the current report.
Figure 5.
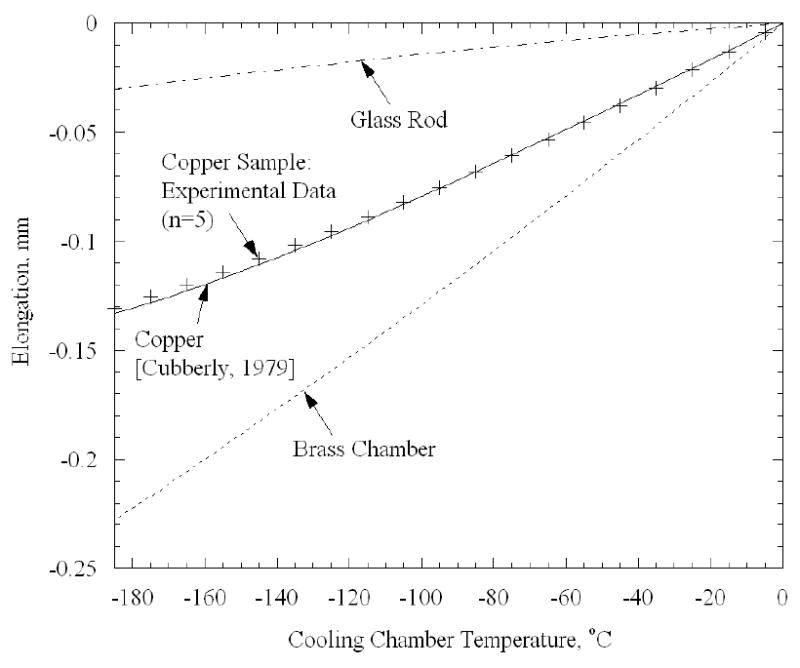
Comparison of experimental measurements of elongation and literature data for a 51 mm copper rod, as a verification of the calibration curve.
Results and Discussion
Figure 6 presents a typical thermal history of the cooling chamber and the sample for a 42 mm long artery sample. Point A indicates the beginning of the experiment at room temperature (zero elongation). Next, the desired cooling chamber temperature is set to −20ºC for 8 min. Overshooting of the control system is observed around point B, when the cooling chamber temperature reaches −33ºC after about 3 min; eventually the temperature of the cooling chamber stabilizes on the desired value of −20ºC. A dramatic elongation of the specimen is observed around point B, which is the result of the expansion of water upon crystallization. The elongation of the sample with time decays just before point C, which is an indication that crystallization has been completed. Next, the temperature controller turns off the electrical heaters while the operator activates the heat exchangers of the high pressure cooling unit, and the elongation of the tissue is monitored while the sample is cooled down to its minimum temperature (point D). Both the chamber and the specimen approach steady state at point D. Finally, the controller turns on the electrical heaters, while the operator turns off the high pressure cooling system, and the rewarming stage prevails up to about 0ºC (point E). Figure 7 presents the calculated thermal strain for a typical tissue sample, based on the measured data and computation of Eq. (5). High repeatability is observed between the cooling and rewarming phases in Fig. 7 (a maximum difference of 2% of full scale), which indicates the quality of both the experimental system and the data analysis technique.
Figure 7.
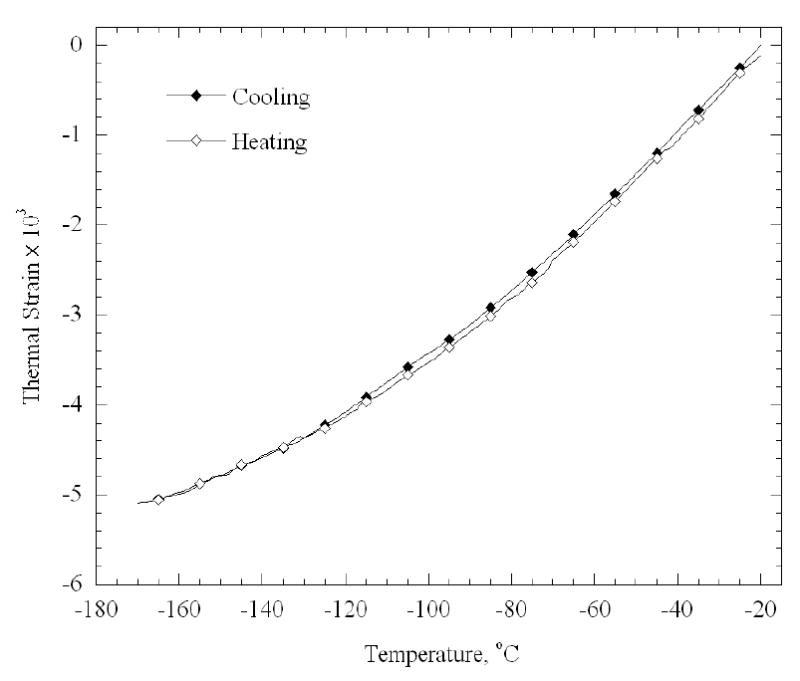
Calculated thermal strain during cooling and subsequent rewarming, for the experimental data shown in Fig. 6
Figure 8 presents average experimental data of thermal strain for all samples (n=5), taking into account both cooling and rewarming phases. Figure 8 also presents literature data on thermal strain of muscles [10]. The coefficients of best-fit polynomial approximation for all data presented in Fig. 8 are listed in Table 1. It can be seen that the thermal strain in the artery is about 10% larger than that of polycrystalline water [8] over the entire temperature range of −170ºC to −20ºC, which is consistent with previously reported data on other soft tissues in the absence of cryoprotectants [10] (listed in Table 1). It can further be seen from Fig. 8 that the standard deviation of experimental data is about 5% of full scale. This standard deviation represents the repeatability in measurements, which is affected by both variation in properties between different samples (and between animals), as well as by the quality of the experimental system. The standard deviation, however, represents only a part of the uncertainty in measurements. A detailed analysis of uncertainty is given in Appendix A.
Figure 8.
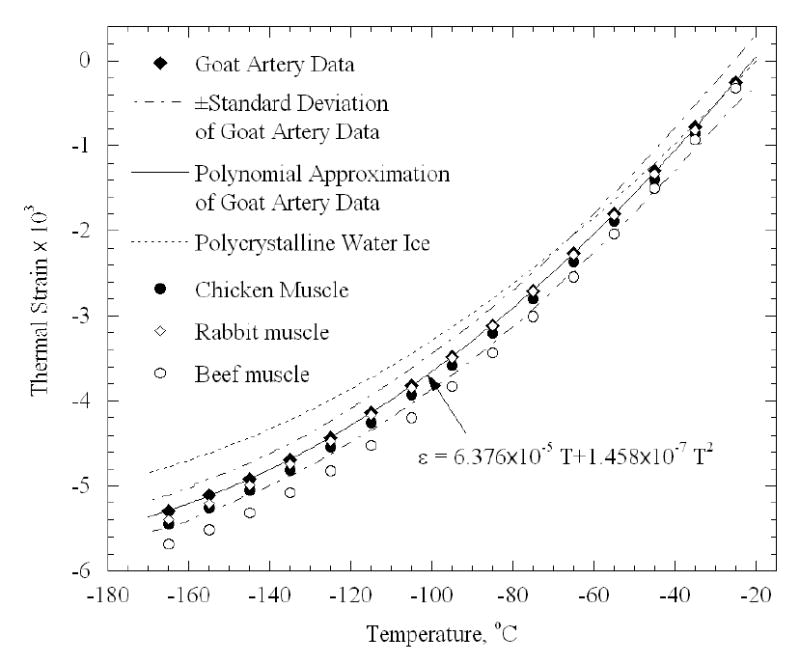
Thermal strain results of goat artery samples (current study) in comparison with literature data on polycrystalline water ice [8] and muscle tissues [10] (Table 1).
The data analysis presented above is based on the assumption that the temperature distribution in the sample is uniform. This assumption was verified during the calibration testing stage along the copper sample, and a maximum temperature difference of 3ºC was measured using an array of thermocouples. In the blood vessel however, a more significant non-uniformity in temperature is expected, due to dramatically lower thermal conductivity of the blood vessel, which is two orders of magnitude lower than that of copper. This temperature non-uniformity calls for a more detailed analysis of its possible effect on the computed thermal strain. For this purpose, an additional experiment has been conducted, in which three thermocouples were placed along a 42 mm long artery sample, at axial distances of 6, 20 and 35mm from the top plastic tie (top, middle, and bottom points in Fig. 9, respectively).
It can be seen from Fig. 9 that the temperature difference between the cooling chamber and the middle point of the artery sample increases during cooling, decreases during rewarming, and reaches a maximum value of about 40ºC. It can further be seen that the maximum temperature difference between top and bottom of the sample reaches a maximum of about 17.5ºC, but there is no significant temperature difference between the center and the bottom of the sample. The latter observation can be explained by the fact that heat is being conducted from the blood vessel to the chamber through the threaded brass rod, while no significant amount of heat is being conducted through the glass rod from the surroundings.
Another effect of the temperature difference between the sample and the chamber is related to the correction factor in Eq. (4). As was verified experimentally, the glass rod temperature is the same as the bottom of the sample, which yields a 40ºC difference at the minimum temperature, over a full range of about 180ºC. Overlooking such a temperature difference would lead to over estimation of the elongation of the glass rod by about 28% (proportional to the temperatures ratio). As can be seen from Fig. 5, the elongation of the glass rod is about 10% of that of the sample. Hence, overlooking the above temperature difference leads to uncertainty of up to 2.8% in thermal strain calculation of the sample. Since the above temperature difference is taken into account in the course of calibration, Eqs. (4)–(10), this uncertainty is compensated for. However, since data analysis is cooling rate-dependent, a value of 2.8% can be taken as the upper limit of uncertainty, because the experiment was conducted at a different cooling rate than the one used for calibration.
Only the bulk thermal expansion of the sample can be measured with the new experimental system and technique. However, due to non-uniformity of temperature along the sample, as presented in Fig. 9, a non-uniform thermal expansion is expected to develop. For the purpose of sensitivity analysis of this effect (and for this purpose only), it is assumed that the thermal expansion coefficient of the artery is the same as that of water [8]. From Eqs. (1)–(2), the strain of the sample can be calculated as:
| (12) |
The right side term of Eq. (12) represents a first-order approximation of elongation, where the sample is subdivided into three equal segments, each having a uniform temperature distribution, equal to the measured temperatures presented in Fig. 9.
Figure 10 presents the computed strain based on a uniform temperature distribution equal to the middle point temperature in Fig. 9, and also a more detailed calculation of a distributed system, calculated from Eq. (12). No significant difference can be observed between both cases. This observation can be explained by the fact that the different segments are thermally strained with respect to their initial temperature, the maximum temperature difference is found at the minimum temperature, and that the thermal expansion coefficient decreases by a factor of four with the decrease in temperature over the entire temperature range. For the same reason, no significant strain difference is observed between the cooling and the rewarming phases of the temperature-distributed case.
Figure 10.
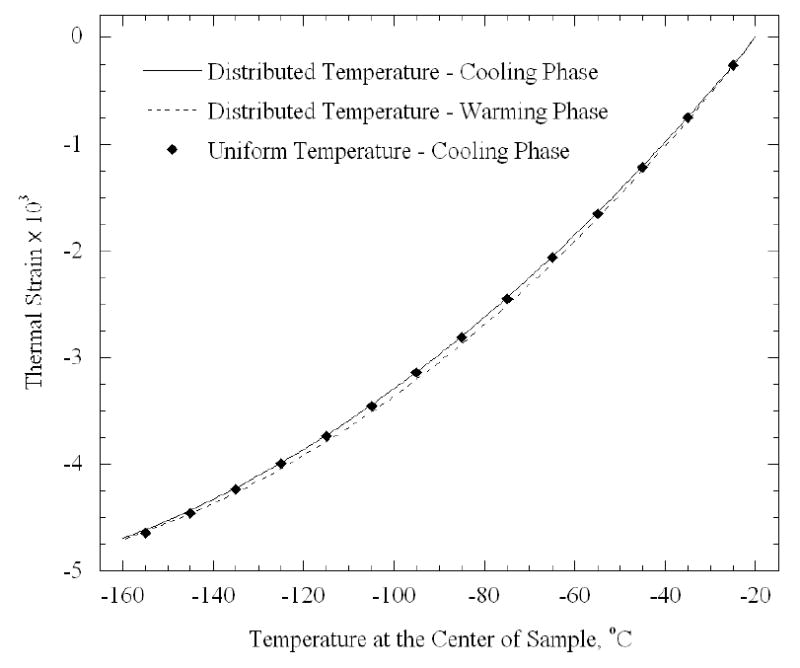
Computed thermal strain for the experiment shown in Fig. 9 for two cases: (1) taking into account the temperature distribution, and (2) assuming a uniform temperature distribution along the sample, represented by the middle point in Fig. 9
Finally, it is noted that a variety of Thermo-Mechanical Analyzer devices (TMA), for measurement of thermal expansion, are commercially available (for example: TMA 202, Netzsch Instruments, Inc., Germany). TMAs are available for either solid samples (including commercial glass) or, in some specific cases, for liquid samples. To the best of our knowledge, no measurement device is commercially available for thermal expansion measurements during the actual process of vitrification, where the material gradually transitions from liquid-like to solid. The maximum cooling rate achievable with the new device is 135ºC/min, although it is set to work at 30ºC/min in the current study (see experimental setup section for more detail). Those rates are much higher than the commercially available TMAs (typically in the range of up to 10ºC/min). Moreover, the cooling rate is typically specified for the chamber, whereas the cooling rate history of the sample is driven not only by the cooling rate of the chamber, but also by the chamber design and operation parameters. For example, the thermal resistance to heat transfer by natural convection, between the sample and the chamber, dramatically affects the cooling rate difference between the chamber and the sample. The dimensions of the specimen groove, illustrated in Fig. 2, are designed specifically to accommodate a blood vessel sample, with a minimum air gap between the sample and the inner walls, and therefore for a minimum cooling rate difference. Working with a series of brass blocks having various groove dimensions would ensure the best fit between the sample and the chamber (not used in the current study).
As an alternative, it is possible to modify some commercially available TMAs to circulate the air inside the chamber, which would improve the heat transfer between the sample and the cooling chamber wall, and increase the cooling rate of the sample. However, when the sample behaves like a low viscosity material, such air circulation has the undesired side effect of vibrating the sample, leading to a dramatic reading noise, and the danger of mechanically straining the sample as a result drag forces. This air circulation feature is not needed with the design of the new device presented in the current study.
Summary
As part of the ongoing effort to study the mechanical behavior of biological materials in cryopreservation processes, the current study focuses on thermal expansion of blood vessels in low cryogenic temperatures. This report describes a new experimental device for thermal expansion measurements of blood vessels in conditions typical of vitrification, which are associated with rapid cooling rates. The current paper also reports on a calibration technique using copper specimens, and validation experiments on blood vessel specimens in the absence of cryoprotectants.
Repeatability of better than 98% was found during calibration testing between the cooling and rewarming phases of the same experiment, which reflects the quality of the experimental system and the data analysis technique. For validation purposes, the thermal strain of frozen arteries was measured and found to be about 10% higher than that of polycrystalline water ice; this observation is consistent with previously reported data in the literature. Standard deviation of about 5% of full scale was found in experiments on arteries, which is affected by both variation in properties between different samples (and possibly between different animals of the same species), as well as by the quality of the experimental system. Detailed analysis revealed an uncertainty level of 7% in the experimental system. Repeated thermal strain experiments on the same sample did not demonstrate observable differences in thermal strain values.
Acknowledgments
This study has been supported in part by NHLBI, grant numbers R01 HL069944-01A1, R01 HL069944-02, R01 HL069944-03. The authors wish to thank Mr. Jim Dillinger, Mr. John Fulmer, and Mr. Edward Wojciechowski, of the Machine Shop, Department of Mechanical Engineering, Carnegie Mellon University, Pittsburgh, PA, for assistance and advice in constructing the experimental device.
Appendix A: Uncertainty Analysis
Consistent with engineering analysis of uncertainty [2] the uncertainty of a dependent variable F is:
| (A.1) |
where xi are all the independent variables. Detailed calculations yield uncertain values of 1.47×10⁻⁴, 1.01×10⁻⁴, and 4.11×10⁻⁴, for ɛ’g, ɛc, and ɛs, respectively. It follows that the relative error is estimated as 3%, 2%, and 7% of full scale, respectively.
Parameters, which are not specified in the manuscript, but taken into account in uncertainty calculations are: A/D conversion (22 bits at 0.333Hz) in the data acquisition module, nonlinearity of the displacement sensor (0.25% of full scale), overall error from the LVDT (2 mV, which is equivalent to 3 μm), and threaded brass rod length of 3 mm (Fig. 2). The effective length of the artery sample is the distance between the two cable ties used to hook the specimen, and an uncertainty interval of 1 mm (the thickness of a cable tie) is assumed to be associated with this measurement.
References
- 1.W.H. Cubberly, Metals Handbook, 9th ed., American Society of Metals, Ohio, USA, Vol 2, p. 277, 1979
- 2.J.P. Holman, Experimental Methods for Engineers, 7th ed., McGraw-Hill, 2001.
- 3.J. Jimenez, Y. Rabin, Thermal expansion of blood vessels in cryogenic temperatures, Part II: Vitrification with VS55, DP6, and 7.05M DMSO, Cryobiology (2005), submitted (companion paper) [DOI] [PMC free article] [PubMed]
- 4.Luyet BJ. The vitrification of organic colloids and of protoplasm. Biodynamica. 1937;1(29):1–14. [Google Scholar]
- 5.Mehl P. Nucleation and crystal growth in a vitrification solution tested for organ cryopreservation by vitrification. Cryobiology. 1993;30:509–518. doi: 10.1006/cryo.1993.1051. [DOI] [PubMed] [Google Scholar]
- 6.M. Palastro, J.P. Steif, Y. Rabin, Predictions of cracking during vitrification of cryoprotectants, CRYO2005 – The 42nd Annual Meeting of the Society for Cryobiology, Minneapolis, MN, July 24–27 (2005).
- 7.Plitz J, Rabin Y, Walsh JR. The effect of thermal expansion of ingredients on the cocktails VS55 and DP6. Cell Preservation Technology. 2004;2(3):215–226. [Google Scholar]
- 8.Powell RW. Thermal conductivity and expansion coefficients of water and ice. Adv Phys. 1958;7:276–297. [Google Scholar]
- 9.Rabin Y, Steif PS. Thermal stresses in a freezing sphere and its application to cryobiology. ASME Journal of Applied Mechanics. 1998;65(2):328–333. [Google Scholar]
- 10.Rabin Y, Taylor MJ, Wolmark N. Thermal expansion measurements of frozen biological tissues at cryogenic temperatures. ASME Journal of Biomechanical Engineering. 1998;120(2):259–266. doi: 10.1115/1.2798310. [DOI] [PubMed] [Google Scholar]
- 11.Rabin Y, Steif PS. Thermal stress modeling in cryosurgery. International Journal of Solids and Structures. 2000;37:2363–2375. [Google Scholar]
- 12.Rabin Y, Taylor MJ, Walsh JR, Baicu S, Steif PS. Cryomacroscopy of vitrification, Part I: A prototype and experimental observations on the cocktails VS55 and DP6. Cell Preservation Technology. 2005;3(3):169–183. doi: 10.1089/cpt.2005.3.169. [DOI] [PMC free article] [PubMed] [Google Scholar]
- 13.Song YC, Khirabadi BS, Lightfoot FG, Brockbank KGM, Taylor MJ. Vitreous cryopreservation maintains the function of vascular grafts. Nature Biotechnology. 2000;18:296–299. doi: 10.1038/73737. [DOI] [PubMed] [Google Scholar]
- 14.Steif PS, Palastro M, Wen CR, Baicu S, Taylor MJ, Rabin Y. Cryomacroscopy of vitrification, Part II: Experimental observations and analysis of fracture formation in vitrified VS55 and DP6. Cell Preservation Technology. 2005;3(3):184–200. doi: 10.1089/cpt.2005.3.184. [DOI] [PMC free article] [PubMed] [Google Scholar]
- 15.M.J. Taylor, Sub zero preservation and the prospect of long term storage of multicellular tissues and organs, in: R.Y., Calne, (Ed.), Transplantation Immunology: Clinical and Experimental Oxford, New York, Tokyo: Oxford University Press, 1984, pp. 360 390.
- 16.M.J. Taylor, Y.C. Song, K.G.M. Brockbank, Vitrification in tissue preservation: New developments, in: B.J., Fuller, N., Lane, E.E., Benson, (Eds.), Life in the Frozen State, CRC Press, New York, 2004, pp 603–641.


