Since the late 1990s, the possible adverse effects of the combined measles, mumps, and rubella (MMR) vaccine have caused intense public debate. After the vaccine was introduced in 1988, coverage was high, increasing from 80% in 1989 to 92% in 1997. After 1997 coverage began to decline,1 and by 2001 had fallen by 4.1%, which gave some cause for concern.2 We examined the extent to which these trends reflect different patterns of uptake in affluent and deprived areas and changes in the equitable coverage of immunisation for MMR.
Participants, methods, and results
We selected 60 health authorities in England (defined by 1999 boundaries). The boundaries of these authorities remained stable over a decade. We calculated the Townsend material deprivation index for each area and used these scores to categorise authorities in to three groups of 20 authorities3: deprived (1.27 to 10.59), neither deprived nor affluent (−2.41 to 1.13), or affluent (−4.51 to −2.79). For each year from 1991 to 2001, we calculated coverage of MMR as the percentage of children who had been immunised by their second birthday.
As explanatory variables we chose characteristics of general practitioners and practices that are known to be associated with inequity in coverage of preventive interventions. We calculated mean coverage for each group for each year and estimated inequality between the three groups of areas and change in inequality over time using log variances. Analysis of variance showed significant (P<0.05) differences in mean coverage for affluent and deprived areas from 1991 to 1996 but not from 1997 to 2001. We examined changes in coverage over time separately for each group, using a cross sectional time series random effects regression model with general practitioner and practice variables as explanatory variables.
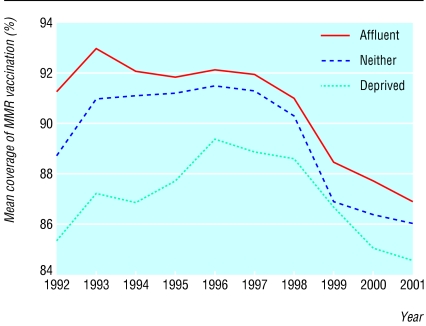
Coverage was consistently higher in affluent authorities than in deprived authorities. We saw two distinct trends in coverage (figure). Between 1991 and 1997, coverage of MMR immunisation improved, increasing more rapidly in deprived areas (by 3.5%) than in affluent areas (0.7%). Inequality decreased over time, with log variance falling from 0.62 to 0.33 between 1991 and 1997. During this period, increases in the coverage of MMR in deprived areas were associated with a decrease in general practitioners aged 65 and older and an increase in the number of practice nurses per 10 000 population. We found no significant (P>0.05) associations between the characteristics of practices and coverage in affluent areas.
From 1997 to 2001, coverage of MMR immunisation declined in all areas, but it decreased by a slightly greater proportion in affluent areas (by 5%) than in deprived areas (4.2%); and inequality decreased—log variance fell from 0.33 to 0.19 between 1997 and 2001. Over this period there were no significant (P>0.05) associations between practice variables and changes in the coverage of MMR immunisation for either affluent or deprived areas.
Comment
Coverage of MMR vaccination was, in the first half of the 1990s, moving towards maximum levels and becoming more equitably distributed between affluent and deprived areas. This was associated with improvements in the staffing of general practices in deprived areas. Changes in the perceptions of the MMR vaccine (from being protective of child health to being of potential damage) have counteracted these trends.
Affluent populations are, in general, the first to take up practices that are perceived as protective of child health4; in the latter part of the decade, this meant declining immunisation. Inequality in the coverage of MMR immunisation continued to decrease, but this was not because of improvement in deprived areas. Rather it reflected declines in coverage that were initially more pronounced in affluent areas. Interpreting this trend as indicating an improvement in equity of distribution of MMR immunisation would, therefore, be contentious.5
Figure.
Mean coverage of MMR immunisation (percentage of children younger than 2 years immunised) in England from 1991 to 2001
Footnotes
Funding: Department of Health.
Competing interests: None declared.
References
- 1.Communicable Disease Surveillance Centre. MMR vaccine coverage falls in the United Kingdom. Commun Dis Rep CDR Wkly. 1999;9:37. [PubMed] [Google Scholar]
- 2.Marshall H. Measles outbreaks on the horizon. Trends Immunol. 2001;22:14. doi: 10.1016/s1471-4906(00)01846-9. [DOI] [PubMed] [Google Scholar]
- 3.Townsend P, Simpson D, Tibbs N. Inequalities in the city of Bristol: a preliminary review of statistical evidence. Int J Health Serv. 1985;15:637–663. doi: 10.2190/AN09-8R52-UE6B-VWUU. [DOI] [PubMed] [Google Scholar]
- 4.Victora C, Vaughan J, Barros F, Silva A, Tomasi E. Explaining trends in inequities: evidence from Brazilian child health studies. Lancet. 2000;356:1093–1098. doi: 10.1016/S0140-6736(00)02741-0. [DOI] [PubMed] [Google Scholar]
- 5.Baker D, Illsley R. Studies of inequality in health need careful interpretation. BMJ. 1998;317:1659. [PubMed] [Google Scholar]


