Abstract
Timing is a fundamental part of sensory and motor processing. However, little is known about the neural mechanisms underlying timing in the range of tens to hundreds of milliseconds. Although many theoretical hypotheses have been put forth on the possible underpinnings of temporal processing, there is little cellular experimental data, particularly in vitro, as to the neural mechanisms that could potentially function as timers. We use organotypic cortical slices to show that reliably timed action potentials (or excitatory postsynaptic potentials) can be observed up to 300 ms after a single stimulus. There was no relationship between the latency of the late responses and distance from the stimulating electrode. Paired recordings and pharmacological manipulations suggest that the timed late responses are the result of the propagation of activity throughout functionally defined networks. These results show that cortical networks may be intrinsically able to process temporal information.
Temporal information on the time scale of tens to hundreds of milliseconds is a fundamental part of many forms of sensory and motor processing, most notably of speech recognition and animal vocalizations (1–3), and fine motor coordination (for reviews, see refs. 4–6). However, even for simple tasks such as determining whether a pair of brief tones are separated by a 100- or 150-ms interval (7, 8), little is known about the neural mechanisms underlying timing.
Various hypotheses have been put forth regarding the potential mechanisms underlying timing. These include delay lines (9–11), oscillators/internal clocks (12–15), or slow biochemical processes (16–18). It has also been proposed that certain types of timing may rely on the intrinsic dynamics of local neural circuits (19–22). However, to date there have been few experimental studies that examined whether timed responses can be observed in vitro, and the underlying mechanisms.
Here we use cortical organotypic slices to study the timing and propagation of neural responses within local cortical networks. Our results show that stimulation elicits reproducible temporal patterns of activity in response to a single stimulus. The latency of the first spike occurred at intervals up to 300 ms after stimulation, indicating that a memory trace capable of producing suprathreshold responses is present in the network for a few hundred milliseconds. The accuracy of the responses were within the ranges observed at the behavioral level. The dynamics did not reflect simple spatial propagation or “waves,” and paired recordings revealed that neighboring neurons could exhibit distinct temporal firing patterns. Our results suggest that the timing of the late response is generated by local propagation of activity through circuits defined by their functional connectivity.
Materials and Methods
Organotypic Slices.
Cortical organotypic slices were prepared by using the interface method (23, 24). Briefly, 7-day-old Sprague–Dawley rats were anaesthetized with halothane and decapitated, and the brain was removed and placed in cutting media. Coronal slices containing the auditory cortex (350–400 μm) were cut on a vibratome, and placed on a Millipore filter (MillicellCM) with 1 ml of culture media. Culture medium was changed 1 and 24 h after cutting, and three times a week thereafter. Cutting medium was composed of EMEM (MediaTech no. 15-010) to which we added (final concentration) 3 mM MgSO4, 10 mM glucose, 25 mM Hepes, and 10 mM Trisbase. Culture medium was composed of EMEM plus glutamine plus 0.55 mM CaCl2, 1.85 mM MgSO4, 25.5 mM glucose, 30 mM Hepes, 0.5 mM ascorbic acid, and 20% horse serum. We also included penicillin (10 units/ml) and streptomycin (10 μg/ml). Slices were incubated in 5% CO2 at 35°C for 10–28 days.
Electrophysiology.
Recordings were made from large pyramidal shaped neurons by using IR/DIC visualization. The mean (±SD) resting membrane potential and input resistance were −71 ± 6.6 mV and 183 ± 56 MΩ, respectively. Experiments were carried out at 30–32°C in artificial cerebrospinal fluid (ACSF) composed of 125 mM NaCl, 2.5 mM KCl, 2 mM MgSO4, 26.2 mM NaHCO3, 1 mM NaH2PO4, 25 mM glucose, and 2.5 mM CaCl2. Whole cell recordings were made with 3–10 MΩ pipettes by using an Axoclamp 2B amplifier. The internal solution was composed of 100 mM K-gluconate, 20 mM KCl, 4 mM ATP-Mg, 10 mM phospho-creatine, 0.03 mM GTP, 10 mM Hepes (adjusted to pH 7.3 and 310 mOsm). Recordings were made from the upper layers (within the first 500 μm) from the “external” surface of the slice. Single-unit extracellular recording were made by using the loose cell-attached method (25). Briefly, the same pipettes used for whole-cell were used to form a “loose” seal (50–500 MΩ). Forming a loose seal that did not eventually break-in to the cell was accomplished by using “dirty” pipettes (that had already been used to make a loose or tight seal).
One or two bipolar stimulating electrodes were placed in the upper cortical layers. A single (100-μs) pulse was applied every 15–30 s to elicit synaptic responses. Stimulation intensity ranged from 30 to 100 μA. In the studies where stimulation intensity was varied, the low intensity was set at 5–10% below that of the high intensity. In some experiments 50 μM 2-amino-5-phosphonovaleric acid (APV) (Sigma), 1–5 μM bicuculline (Sigma) or high divalent ACSF (4 or 8 mM Ca2+/Mg2+) was used.
Data Analysis.
To quantify the polysynaptic response in the intracellular experiments we calculated the area of the postsynaptic potential (PSP) by using custom written software in matlab. The area of the PSP was defined as the integral of the PSP above baseline between 50 and 400 ms after the stimulus.
Conduction speed was estimated by dividing the distance between two neurons by the difference in the onset latency of the monosynaptic excitatory PSP (EPSP). The resulting measure provides a lower bound to the conduction speed because it assumes a linear axonal path. Conduction velocity was also estimated from the relationship between the distance between the stimulating and recording electrode, and monosynaptic latency (see Fig. 3A). Correlations between the PSPs of two simultaneously recorded cells were calculated by determining the correlation coefficient between the averaged traces (at least 15 sweeps). Data analysis was performed by using custom matlab code.
Figure 3.
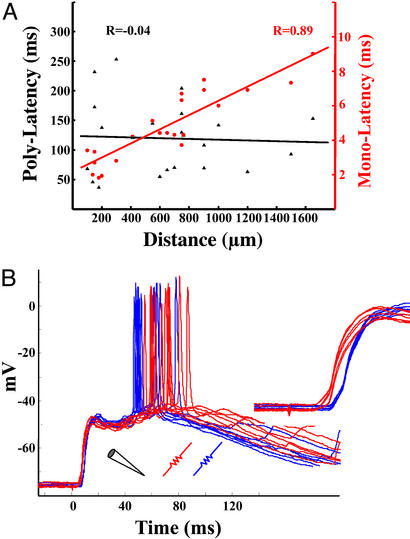
Spatial relationship between stimulating and recording electrodes and the late and monosynaptic latency. (A) Correlations between the distance of the stimulating and recording electrode versus the monosynaptic EPSPs (circles) and spike latencies (triangles) (n = 21). In four experiments two stimulating electrodes were present, allowing for simultaneous comparisons. There was a significant correlation between distance and monosynaptic latency, but not between distance and latency of the peak response. The inverse of the slope of the red line provides an estimate of axonal conduction velocity (0.24 mm/ms). (B) Example of a cell that fired sooner to distant stimulation. Raw traces in response to a close stimulating electrode (“red,” 650 μm) and far electrode (“blue,” 1,200 μm). The mean latency to the first spike in response to red stimulation was longer then that of blue stimulation; in contrast, the monosynaptic onset latency was shorter (same data magnified are shown in Inset). The mean first-spike latencies in response to blue and red stimulation were 74 and 87 ms, respectively. Note that in some cases the cell spiked twice in response to blue stimulation and that these spikes overlap with the red ones. Also note that the size of the monosynaptic response was similar, suggesting comparable network activation.
Results
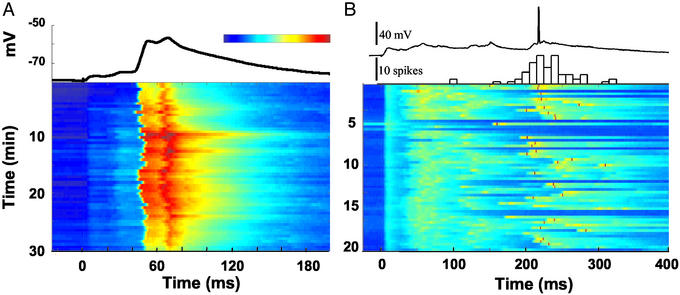
Fig. 1A shows an example of an intracellular response to a single stimulus. The initial monosynaptic EPSP is followed by a second small EPSP, and a third larger EPSP. The voltage plot, obtained over 30 min, shows that the peak response is consistent across trials and is reliably elicited between 45 and 55 ms. The profile and timing of the late responses, was variable from cell to cell, and slice to slice. Fig. 1B shows an example from a different experiment, in which the cell exhibited a mean latency of 232 ms after the stimulus, as shown by the poststimulus time histogram (PSTH). Thus, a single stimulus can generate a pattern of activity resulting in delayed responses that far exceed delays produced by monosynaptic transmission.
Figure 1.
Timing of late responses. (A) Timing of subthreshold EPSPs. Each horizontal sweep represents the voltage changes in response to a stimulus at time 0. A stimulus was presented every 30 s. The trace above represents the average response over the 60 trials shown below. Note that in both the average and individual responses a small monosynaptic EPSP (mean onset of 2.7 ms) and a second small EPSP (mean onset 18.5 ms) can be observed before the large EPSP with average onset and peak latency of 42.2 and 52.5 ms, respectively. (B) Timing of suprathreshold responses from a different slice. A 20-min sample of an experiment is shown in the voltage plot. Although excitatory synaptic events can be seen at most intervals, spikes occur at a mean latency of 232 ms. Note that in some sweeps there were no spikes; these are referred to as “failures.” The intertrial interval was 20 s. (Upper) Spike latency is plotted as a PSTH (time bin 10 ms) along with a sample voltage trace. Color bar represents the range of voltages. In A, the range is from −80 to −50 mV. In B, the range is from −80 to −30 (and higher) mV; thus, the red dots represent spikes.
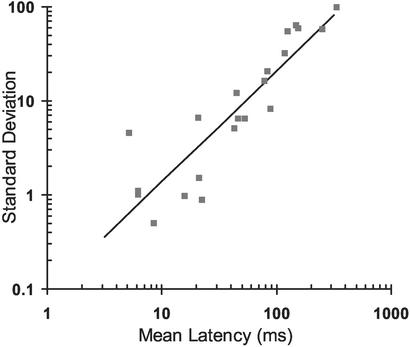
To determine the range and accuracy of the timed responses, we examined the mean and the SD of the latency of the first spike by using extracellular recordings. The latencies of the 21 cells shown in Fig. 2 ranged from 5 to 340 ms. There was a strong correlation between the mean latency and the SD (r = 0.94, P < 0.0001), indicating that accuracy of the timed response decreases as the interval increases.
Figure 2.
Mean latency of the first spike versus the SD. The mean latency and SD of the first spike are plotted on the x and y axes, respectively. Each point was obtained from at least 30 trials. All points were best fit with a linear regression (y = 1.18x − 1.04; black line). There was a highly significant correlation between latency and SD (r = 0.94; P < 0.0001).
Latency Is Not Correlated with Distance from the Stimulating Electrode.
Previous studies have observed waves of activity in acute cortical slices (26). In such experiments there is a correlation between the response latency and distance from the stimulating electrode. To determine whether this relationship was observed here, we examined the distance between the stimulating and recording electrodes, and the action potential or peak PSP latency. Fig. 3A shows that there was no correlation (R18 = −0.04) between latency and distance from the stimulating electrodes. As a control analysis, we examined the relationship between distance and the monosynaptic latency in the same cells. As expected there was a high correlation between latency and distance (R18 = 0.89, P < 0.0001).
To further examine the relationship between latency and distance from the site of stimulation, some of the experiments were performed with two stimulating electrodes, making it possible to compare the input produced by two different stimulation sites in the same cell. An example of such an experiment is shown in Fig. 3B. Spike latency was shorter in response to the “blue” stimulating electrode as opposed to the “red” stimulating electrode. However, the blue electrode was 1,200 μm from the cell, whereas the red electrode was 650 μm. Consistent with this spatial relationship the inset shows that the monosynaptic latency in response to the red electrode was 2.5 ms shorter. Furthermore, note that the amplitude of the monosynaptic EPSP produced by both sites was similar in amplitude, indicating that intensities were set at equivalent levels.
N-Methyl-d-Aspartate (NMDA)-Dependency of Late Responses.
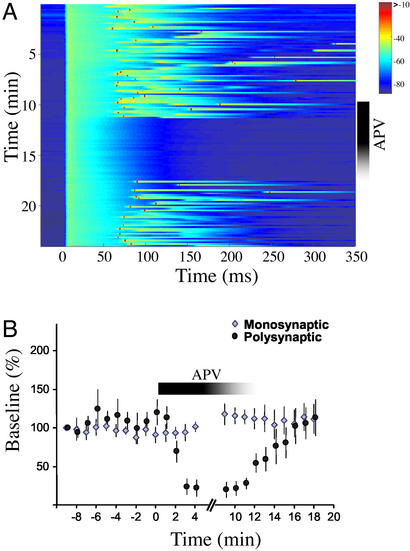
The multicomponent temporal profiles of the late responses suggest that neurons are receiving polysynaptic inputs from other neurons in the network. Sensitivity to NMDA receptor blockade has been used to determine whether a response depends on network mechanisms (27). We performed a similar analysis, Fig. 4A shows that late response was completely abolished by APV but reappeared on washout. Note, that consistent with the notion that APV abolishes a polysynaptic response, the late response disappears in an all or none fashion. As shown in Fig. 4B, APV dramatically decreased the late response, whereas the slope of the monosynaptic EPSP remained unaltered (n = 7). We also examined the role of inhibition (data not shown). During wash on, the γ-aminobutyric acid type A (GABAA) antagonist bicuculline altered the PSP profile, either shortening or prolonging the latency of the peak response. In the continued presence of 1–5 μM bicuculline spontaneous and evoked paroxysmal discharge shifts were produced. These results indicate that inhibition is playing an important role in preventing a brief stimulus from eliciting epileptiform activity and in shaping network dynamics.
Figure 4.
Late responses are dependent on NMDA receptors. (A) Example of an experiment in which application of APV abolished the late polysynaptic response. Before and after APV, a polysynaptic response occurred on average at 75 ms (sometimes producing a spike); no late sub- or suprathreshold responses were observed in the presence of APV. (B) Average data from seven APV experiments. The slope of the monosynaptic EPSP was unaffected by APV. In contrast, the polysynaptic responses (as measured by the integral of the PSP) were abolished.
Paired Recordings.
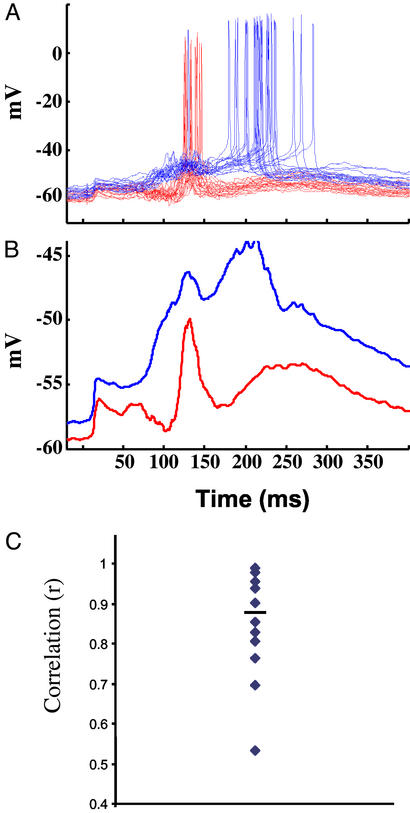
To determine whether different cells exhibit similar responses to the same stimulus, we recorded simultaneously from two neurons. The distance between the neurons ranged from 20 to 900 μm. Fig. 5 shows an example of paired intracellular recordings from two nearby neurons (50 μm apart). Stimulation elicited complex excitatory/inhibitory profiles in both cells, however, the spike latency was different (129 vs. 205 ms). Thus, consistent with the lack of a correlation between distance from the stimulating electrode and latency (Fig. 3), nearby neurons could exhibit different temporal profiles and latencies. Fig. 5B shows the average subthreshold response after the spikes have been filtered out. To measure the similarity between the postsynaptic responses in both cells we calculated the correlation between the subthreshold waveforms. The correlation coefficient was 0.7. Fig. 5C shows the average and distribution of the correlation coefficients between pairs of neurons (n = 10; mean, 0.84; range, 0.53–0.98). If the neurons being recorded from were identical, the correlation coefficient would reflect the number of shared inputs. Nevertheless, the correlation data suggests that pairs of neurons share many of their inputs, resulting in similar subthreshold responses, but that there are significant differences that result in distinct suprathreshold responses, as observed in Fig. 5A.
Figure 5.
Paired recordings reveal different temporal profiles. (A) Twenty overlaid traces from two simultaneously recorded neurons. Both neurons received a short-latency monosynaptic input of approximately the same size. However, the red neuron consistently fired 65 ms before the blue cell. (B) Averaged subthreshold responses of the data shown in A, after removal of the action potentials. Note that both cells have a first peak at approximately the same time, suggesting shared input from other neurons in the circuit. In this pair the red cell elicited a monosynaptic EPSP in the blue cell (1.2 mV; data not shown), and the connection was not reciprocal. Neurons were 50 μm apart and ≈750 μm from the stimulating electrode. (C) Average and distribution of the correlation coefficients among 10 pairs of neurons.
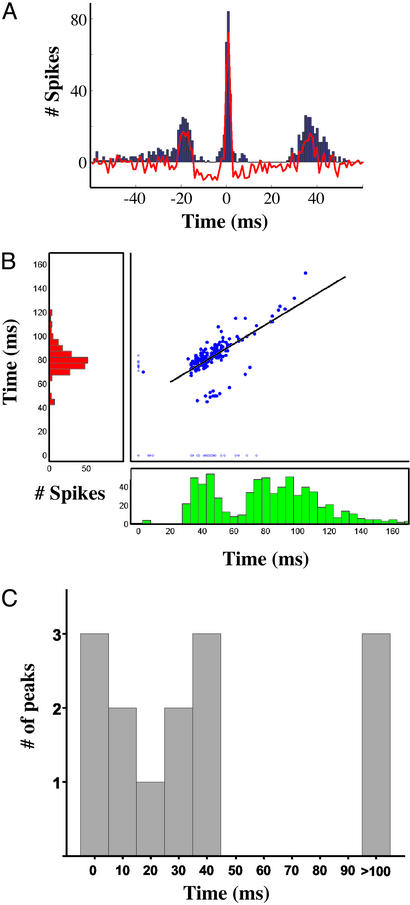
We also recorded from 10 pairs of neurons extracellularly, and analyzed the spike cross-correlation structure. Fig. 6A shows an example of the cross-correlation between one pair of neurons. Interestingly, three peaks were observed at approximately −20, 0, and 40 ms. Fig. 6B shows the PSTHs of the two neurons, and a scatter plot of the first-spike latency. The scatter plot indicates that there is a strong correlation between the first spike in the red and green neuron (r = 0.7, P < 0.001; df = 171), suggesting that activity in the green cell is contributing to the firing of the red cell. Together, the paired recordings (n = 10) revealed a primary cross-correlation peak at intervals ranging from 0 to 40 ms, and 5 of the 10 pairs revealed a secondary or tertiary peak at intervals ranging from 18 to 200 ms. The distribution of the cross-correlation peaks is shown in Fig. 6C. Peaks well over the time scale of monosynaptic transmission are generally not observed in cross-correlations, their presence suggests that although activity in one neuron is involved in the activation of the other, that a direct monosynaptic connection is not the underlying mechanism.
Figure 6.
First-spike latency between neurons that fire at different intervals is correlated. (A) Cross-correlation between two extracellularly recorded neurons. The raw cross-correlation is plotted in blue, and after subtraction of the shuffled cross-correlation is shown in red. The peaks occur at −18, 2, and 36 ms. Peaks ≈0 ms are commonly observed in cross-correlations, and suggest shared input and/or direct connection. (B) The PSTHs from the neurons above are shown in green and red. The red cell exhibited a single peak at ≈80 ms, whereas the green cell exhibited a first-peak at ≈40 ms, followed by a second peak at 80 ms. The scatterplot shows first-spike latency of each cell. The open circles show the cases in which one of the cells did not fire (latency plotted as 0). The black line shows the linear regression (y = 45.36 + 0.8x; r = 0.7, P < 0.001). Data are from 230 trials, with a 20-s intertrial interval. The two neurons and stimulating electrode were approximately linearly aligned with a spacing of 250 μm (stimulating electrode → red neuron → green neuron). (C) Distribution of cross-correlation peaks from 10 pairs of neurons. Some pairs exhibited more than one peak.
Discussion
The results described above show that cortical networks are intrinsically able to generate timed responses on the order of a few hundred milliseconds in response to a single stimulus. Thus, if as in Fig. 1B, an action potential occurs 230 ms after the stimulus, a memory or activity trace that lasts for 230 ms, must be present. The mechanisms underlying these late responses, and their potential physiological relevance are discussed below.
Mechanisms.
The mechanisms underlying the timing of long-latency responses could rely primarily on cellular or network properties. The results presented here suggest that the long latency responses are the result of polysynaptic propagation of activity through functionally defined circuits.
Two traditional criteria to establish that responses are polysynaptic, are that they not follow high-frequency stimulation, and that they are preferentially abolished in the presence of high Ca2+/Mg2+ ACSF (28). The highest stimulation frequency used in the experiments shown here was 0.05 Hz, the late responses were very sensitive to stimulation frequency, and the generally disappeared at frequencies above 0.2 Hz. Furthermore, the late responses were abolished by high Ca2+/Mg2+ solutions (data not shown). Numerous other observations indicate that the late responses are polysynaptic in nature. First, the complex temporal profile of the PSPs suggest that activity from other cells in the network is shaping the response (Fig. 1). Second, APV blocked the late response in an all or none manner without altering the monosynaptic EPSP (ref. 27, Fig. 5). Third, changing the intensity of stimulation altered the timing, suggesting that responses were not the result of hard-wired delay lines or time constants (see Fig. 7, which is published as supporting information on the PNAS web site, www.pnas.org). Fourth, the lack of a correlation between the timing of the responses and distance between the neuron and the stimulating electrode, is also consistent with propagation through networks defined by their functional connectivity (see below). Fifth, the between-cell correlation data and the correlation between latency and the SD, are also more consistent with network properties (Fig. 2, see below). These data suggest that the late responses are produced by network properties. However, we cannot eliminate the possibility that cellular properties are contributing to the generation of the timed responses. For example, it is possible that timing could be imposed by a special subset of neurons that always fire at range of long latencies because of intrinsic properties (sensitive to APV and stimulation intensity), and that these cells connect at random to the neurons we are recording from.
Spatial Relationships.
Previous reports have described waves of activity in acute cortical slices, which propagate outwards from the stimulating electrode. Tanifuji et al. (26) observed activity propagating at a velocity of ≈0.2 mm/ms, this value is similar to the axonal conduction velocity we and others (31–32) observed for monosynaptic EPSPs. Sanchez-Vives and McCormick (34) have observed slow oscillations propagating centrifugally at ≈0.02 mm/ms.
In contrast, we did not observe a relationship between the peak polysynaptic response and distance from the stimulating electrode. However, as expected there was a strong correlation between the latency of the monosynaptic EPSP and distance (Fig. 3B). Indeed, as mentioned above, in paired recordings the neuron farther from the stimulating electrode could fire before the closer neuron (Fig. 3A).
The independence of distance between the cell and the stimulating electrode and timing is expected given the hypothesis that the timed responses are a result of propagation through networks defined by their functional connectivity. Assuming that the synaptic strength between two neurons is not solely determined by their distance, it is the strength of the connections onto a given neuron that will determine when a neuron will fire rather than the proximity to the stimulating electrode. Note also that even if the strength of the excitatory synapses is determined solely by distance, the same may be true of the strength of inhibitory synapses. Thus, in contrast to the monosynaptic latency, the polysynaptic latency would be a complex function of the balance between these opposing forces for each neuron, rather than simple spatial relationships.
Network Propagation.
The simplest network mechanism that could underlie timing consists of sequential activation of different groups of neurons. In this scenario, activity propagates through functionally connected groups of neurons arranged in a feed-forward manner, e.g., A → B → C → … , much in the manner proposed in the “synfire chain” hypothesis (29). Our observation that there is a correlation between latency and variance (spike jitter) is consistent with a synfire chain model, because the variance in firing would be expected to increase as the number of “synapse steps” increases.
The circuitry present in slices is much more complex then that of simple synfire chains because of the presence of recurrent excitatory connections. However, if excitation and inhibition are balanced, network activity could potentially generate dynamic changes in the population of active neurons during different time windows. Indeed, recent theoretical studies have shown that a simple local learning rule, synaptic scaling, can account the emergence of timed late responses in recurrent networks.† The resulting dynamics results in the implementation of a population code for time, or a “population clock,” as suggested to be occurring in the cerebellum (19). In such a model, different neurons are active at specific time windows, and time can be determined from the active population vector.
Relevance to Temporal Processing.
We have shown that cortical responses can produce timed events in vitro, whether the same mechanisms occur in vivo is not known. It is of interest to note that the mean accuracy of the responses was in the same range as observed in psychophysical experiments. Specifically, psychophysically there is a linear relationship between accuracy and interval. The relationship approximately follows a Weber fraction, meaning that the coefficient of variation is constant for different intervals (5, 30, 31). In the current experiments, the mean coefficient of variation was 0.23 ± 0.04, which is within the range observed behaviorally (5). Thus the temporal profile observed in vitro is at least consistent with the experimental constraints obtained from behavioral data.
Conclusions
We have shown that local cortical circuits can generate timed responses on the order of tens to hundreds of milliseconds. These results indicate that the balance of excitation and inhibition is regulated to allow controlled propagation of activity in recurrently connected networks. These results also show that cortical networks are capable of generating timed responses that far exceed the delay produced by monosynaptic transmission, and suggest that under some circumstances cortical networks may be intrinsically able to processes temporal information in the absence of specialized timing mechanisms such as oscillators or delay lines.
Supplementary Material
Acknowledgments
I thank Jack Feldman, Uma Karmarkar, Peter Latham, Sheila Nirenberg, and Tom O'Dell for reading earlier versions of this manuscript. This research was supported by the Alfred P. Sloan and EJLB Foundations, the National Science Foundation, and the National Institutes of Health.
Abbreviations
- PSP
postsynaptic potential, EPSP, excitatory PSP
- APV
2-amino-5-phosphonovaleric acid
- PSTH
poststimulus time histogram
Footnotes
This paper was submitted directly (Track II) to the PNAS office.
Buonomano, D. V. (2002) Soc. Neurosci. Abstr. 28, 187.1 (abstr.).
References
- 1.Tallal P. In: Temporal Coding in the Brain. Buzsaki G, Llinas R, Singer W, Berthoz A, Christen Y, editors. Berlin: Springer; 1994. pp. 291–299. [Google Scholar]
- 2.Shannon R V, Zeng F G, Kamath V, Wygonski J, Ekelid M. Science. 1995;270:303–305. doi: 10.1126/science.270.5234.303. [DOI] [PubMed] [Google Scholar]
- 3.Doupe A J, Kuhl P K. Annu Rev Neurosci. 1999;22:567–631. doi: 10.1146/annurev.neuro.22.1.567. [DOI] [PubMed] [Google Scholar]
- 4.Ivry R. Curr Opin Neurobiol. 1996;6:851–857. doi: 10.1016/s0959-4388(96)80037-7. [DOI] [PubMed] [Google Scholar]
- 5.Gibbon J, Malapani C, Dale C L, Gallistel C R. Curr Opin Neurobiol. 1997;7:170–184. doi: 10.1016/s0959-4388(97)80005-0. [DOI] [PubMed] [Google Scholar]
- 6.Buonomano D V, Karmarkar U R. Neuroscientist. 2002;8:42–51. doi: 10.1177/107385840200800109. [DOI] [PubMed] [Google Scholar]
- 7.Wright B A, Buonomano D V, Mahncke H W, Merzenich M M. J Neurosci. 1997;17:3956–3963. doi: 10.1523/JNEUROSCI.17-10-03956.1997. [DOI] [PMC free article] [PubMed] [Google Scholar]
- 8. Karmarkar, U. & Buonomano, D. V. (2003) Learn. Mem., in press. [DOI] [PMC free article] [PubMed]
- 9.Braitenberg V. Prog Brain Res. 1967;25:334–336. doi: 10.1016/S0079-6123(08)60971-1. [DOI] [PubMed] [Google Scholar]
- 10.Tank D W, Hopfield J J. Proc Natl Acad Sci USA. 1987;84:1896–1900. doi: 10.1073/pnas.84.7.1896. [DOI] [PMC free article] [PubMed] [Google Scholar]
- 11.Bankes S C, Margoliash D. J Neurophysiol. 1993;69:980–990. doi: 10.1152/jn.1993.69.3.980. [DOI] [PubMed] [Google Scholar]
- 12.Treisman M. Psychol Monogr. 1963;77:1–31. doi: 10.1037/h0093864. [DOI] [PubMed] [Google Scholar]
- 13.Fujita M. Biol Cybern. 1982;45:195–206. doi: 10.1007/BF00336192. [DOI] [PubMed] [Google Scholar]
- 14.Miall C. Neural Comput. 1989;1:359–371. [Google Scholar]
- 15.Treisman M, Faulkner A, Naish P L N, Brogan D. Perception. 1990;19:705–743. doi: 10.1068/p190705. [DOI] [PubMed] [Google Scholar]
- 16.Fiala J C, Grossberg S, Bullock D. J Neurosci. 1996;16:3760–3734. doi: 10.1523/JNEUROSCI.16-11-03760.1996. [DOI] [PMC free article] [PubMed] [Google Scholar]
- 17.Beggs J M, Moyer J R, McGann J P, Brown T H. J Neurophysiol. 2000;83:3294–3298. doi: 10.1152/jn.2000.83.6.3294. [DOI] [PubMed] [Google Scholar]
- 18.Hooper S L, Buchman E, Hobbs K H. Nat Neurosci. 2002;5:552–556. doi: 10.1038/nn0602-838. [DOI] [PubMed] [Google Scholar]
- 19.Mauk M D, Donegan N H. Learn Mem. 1997;3:130–158. doi: 10.1101/lm.4.1.130. [DOI] [PubMed] [Google Scholar]
- 20.Medina J F, Garcia K S, Nores W L, Taylor N M, Mauk M D. J Neurosci. 2000;20:5516–5525. doi: 10.1523/JNEUROSCI.20-14-05516.2000. [DOI] [PMC free article] [PubMed] [Google Scholar]
- 21.Buonomano D V, Merzenich M M. Science. 1995;267:1028–1030. doi: 10.1126/science.7863330. [DOI] [PubMed] [Google Scholar]
- 22.Buonomano D V. J Neurosci. 2000;20:1129–1141. doi: 10.1523/JNEUROSCI.20-03-01129.2000. [DOI] [PMC free article] [PubMed] [Google Scholar]
- 23.Muller D, Buchs P A, Stoppini L. Dev Brain Res. 1993;71:93–100. doi: 10.1016/0165-3806(93)90109-n. [DOI] [PubMed] [Google Scholar]
- 24.Musleh W, Bi X, Tocco G, Yaghoubi S, Baudry M. Proc Natl Acad Sci USA. 1997;94:9451–9456. doi: 10.1073/pnas.94.17.9451. [DOI] [PMC free article] [PubMed] [Google Scholar]
- 25.Barbour B, Isope P. J Neurosci Methods. 2000;103:199–208. doi: 10.1016/s0165-0270(00)00318-6. [DOI] [PubMed] [Google Scholar]
- 26.Tanifuji M, Sugiyama T, Murase K. Science. 1999;266:1057–1059. doi: 10.1126/science.7973662. [DOI] [PubMed] [Google Scholar]
- 27.Metherate R, Cruikshank S J. Exp Brain Res. 1999;126:160–174. doi: 10.1007/s002210050726. [DOI] [PubMed] [Google Scholar]
- 28.Berry M S, Pentreath V W. Brain Res. 1976;105:1–20. doi: 10.1016/0006-8993(76)90919-7. [DOI] [PubMed] [Google Scholar]
- 29.Abeles M. Corticonics. Cambridge, U.K.: Cambridge Univ. Press; 1991. [Google Scholar]
- 30.Gibbon J. J Math Psychol. 1992;36:283–293. [Google Scholar]
- 31.Allan L G, Kristofferson A B. Percept Psychophys. 1974;16:26–34. [Google Scholar]
Associated Data
This section collects any data citations, data availability statements, or supplementary materials included in this article.


