Abstract
Based on adaptive control of thought-rational (ACT-R), a cognitive architecture for cognitive modeling, researchers have developed an information-processing model to predict the blood oxygenation level-dependent (BOLD) response of functional MRI in symbol manipulation tasks. As an extension of this research, the current event-related functional MRI study investigates the effect of relatively extensive practice on the activation patterns of related brain regions. The task involved performing transformations on equations in an artificial algebra system. This paper shows that the base-level activation learning in the ACT-R theory can predict the change of the BOLD response in practice in a left prefrontal region reflecting retrieval of information. In contrast, practice has relatively little effect on the form of BOLD response in the parietal region reflecting imagined transformations to the equation or the motor region reflecting manual programming.
It has been a major challenge to understand how different brain regions are involved in the performance of a complex task. Anderson et al. (1) examined the performance of two variations of symbol manipulation tasks: an algebraic transformation task studied by Anderson et al. (2) and an abstract symbol manipulation task studied by Blessing and Anderson (3). Information-processing models that predict the latency patterns in these tasks exist in the adaptive control of thought-rational (ACT-R) cognitive architecture (4). These models require activity in an imaginal buffer to make changes to the problem representation, in a retrieval buffer to hold information from declarative memory, and in a manual buffer to hold information about motor behavior. Activity in the imaginal buffer predicted the blood oxygenation level-dependent (BOLD) response of functional MRI (fMRI) response in a left, posterior parietal region [Brodmann areas (BA) 39/40]; activity in the retrieval buffer predicted the BOLD response in a left prefrontal region (BA 45/46); and activity in the manual buffer predicted activity in a motor region (BA 4/3).
This prior study (1) looked at performance of participants over a brief period. The goal of the current study was to explore the change of the brain activation patterns with learning, especially in those three regions. Numerous studies have reported that, with practice, the participants' accuracy will increase and reaction time will decrease. Even though the accuracy reaches asymptotically high levels, the reaction time will still decrease gradually in a negatively accelerated manner; that is, each unit of practice produces a smaller and smaller improvement in performance (compare ref. 5). Newell and Rosenbloom (6) surveyed 16 experiments across rather a broad range of fields, from perceptual-motor skills to memory to problem solving, and postulated a ubiquitous power-law of learning (compare ref. 7):
 |
where, T is the reaction time, A is the intercept, B is the amount of the latency that can be reduced by practice, N is the number of the units of practice, and α is an exponent that reflects learning rate. A, B, and α are parameters varied among different kinds of experiments. Since then, abundant experiments have offered positive evidence to support this theory (compare ref. 7). On the other hand, before and after Newell and Rosenbloom (6), there were other theories to explain the negative acceleration in practice, such as exponential learning function (e.g., refs. 8 and 9) and mixtures of different power functions (e.g., refs. 10 and 11). It is beyond the scope of this article to deal with these arguments. The most important thing is that all of these arguments agree that reaction time decreases gradually in a negatively accelerated manner with practice.
In ACT-R, practice increases the base-level activation of information in memory, and this increase produces a power-law decrease in retrieval time. We predicted that this decrease in retrieval time would be reflected in a decrease in prefrontal activation. On the other hand, we did not expect an effect of practice on either the manual portion of the task reflected in the motor region or the representational portion of the task reflected in the parietal region. This expectation that the effect of practice would show up in decreased prefrontal activation is consistent with other studies of practice in memory retrieval-related tasks (12, 13). We will present an ACT-R model of this task in detail after describing the experiment and the results.
Experiment
The task of this experiment is similar to experiment 2 in Anderson et al. (1), which was adapted from the paradigm of Blessing and Anderson (3). Participants in this experiment performed an artificial algebra task in which they had to solve “equations.” For example, suppose that the equation to be solved was
 |
where solving means isolating the ℘ in the left side of the ↔. The circled numbers represent operators, and the other numbers are operands. Several transformation rules are involved to move an operator or an operator-operand pair from one side of ↔ to the other side. In this case, the first step is to move the ③4 over to the right, inverting the ③ operator to a ②, the equation now looks like:
 |
Then the ② in front of the ℘ is eliminated by converting ②s on the right side into ③s. So that the “solved” equation looks like:
 |
Participants were asked to perform these transformations in their heads and just key out the final answer. This involved keying a thumb press (denoted “1”) to indicate that they had solved the problem and then keying on a data-glove of 3, 5, 3, and 4 (mapped onto the fingers of the hand) in this example. The experiment varied the number of transformations required to solve the equation: 0, 1, or 2 as in the above example, which were called the complexity conditions.
The data were collected from eight participants (right-handed, native English speakers, six males/two females, aged from 19 to 27, average 23.4) who participated in a 5-day experiment. On the day before day 1, there was a pre-scan session that lasted about 45 min. Participants were introduced to the set of transformation rules, practiced finger-to-key mappings, and practiced actual problem solving. To acquaint participants with the new set of rules, the early part of practice involved producing detailed step-by-step solutions on the computer screen. They first practiced 12 two-transformation problems, and then 24 problems consisting of 8 for each complexity condition. In the later part of practice, participants practiced 12 more problems (4 from each complexity condition) producing only the final solution while solving the equation in their heads, which is the actual procedure used in the experiment.
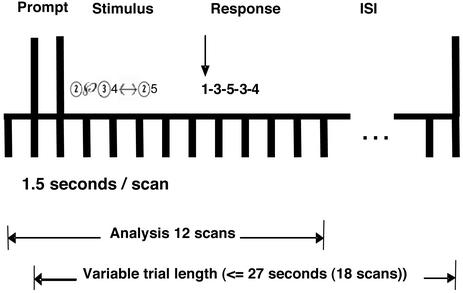
On the next 5 days, participants performed 10 blocks (days 1 and 5, which were the scanning sessions) or 15 blocks (days 2, 3, and 4, which were behavioral sessions) of problems. Each block consisted of a different set of problems. The length of a block was fixed at 5.5 min, in which a series of problems were presented. The trial procedure was the same on all days and is illustrated in Fig. 1. The trial began with a prompt, which was a column of two rectangles. The upper rectangle showed an indication of the complexity of the upcoming problem, such as “1-step,” and the lower rectangle was empty at this period. After 1.5 s, the upper rectangle was filled with the given expression. Participants were instructed to solve the problem mentally, remember the answer, and then press the thumb key when they were ready to key in the final solution. The thumb key press provided a measure of the plan time. If the plan time exceeded 18 s, the trial was scored as incorrect. After the thumb key press, the given expression in the upper rectangle disappeared, and the participants were to press keys as soon as possible for each of four symbols in the answer (the time limitation for each key was ≈1 s). The correct answer appeared in the lower rectangle as the participants typed, even when they typed in a wrong answer or missed the time limitation for the key. The full answer remained on the screen for another 1.5 s, followed by a 6-s rest period with a visual stimulus as a column of two empty rectangles. Because the plan time was variable, the length of a trial (and therefore the number of trials in a block) depended on the performance of the subject, with the maximum as 27 s (18 scans): the faster the plan time, the more opportunities to solve equations. Participants were instructed to try to solve as many equations as possible.
Figure 1.
The protocol of a scan trial. In the response, 1 represents the thumb press.
Event-related fMRI data were collected by using a single-shot spiral acquisition on a General Electric 3T scanner, 1,500-ms repetition time, 18-ms echo time, 70° flip angle, 20-cm field of view, 28 axial slices per scan with 3.2-mm thick, 64 × 64 matrix, and with anterior commissure-posterior commissure on the eighth slice from the bottom. Images acquired were analyzed by using the nis system (http://kraepelin.wpic.pitt.edu/nis/).To explore the practice effect on the BOLD signal, we needed some way to compare the BOLD signal in day 1 and day 5. For this purpose, all of the images were cross-registered to a common reference brain by minimizing signal intensity difference, after which functional images were set to a standard mean intensity, smoothed (6-mm full-width half-maximum 3D Gaussian kernel), and pooled across participants to improve signal-to-noise ratio.
Results
Behavior.
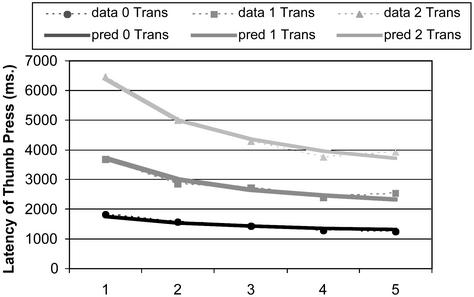
Subjects' interkey times after the thumb key were brief and constant (means = 294.34 ms, SD = 132.96 ms), and therefore we will concentrate our analysis on the latency of the thumb key, which reflects planning time. Mean accuracy across the days was 86.8%, and mean latency of correct trials was 2,858 ms. Fig. 2 shows the decrease in average latency of planning time from day 1 to day 5. Subjects showed both strong effects of practice (P < 0.001 for accuracy, P < 0.0001 for the latency of planning time) and complexity (both P < 0.0001). Fig. 2 also shows best-fitting power functions to the three conditions, assuming a constant intercept (A) of 855 ms and exponent (α) of 0.414 for each condition. Separate scale parameters (B) were estimated for each condition: 912 ms for the 0 transformation condition, 2,845 ms for the 1 transformation condition, and 5,539 ms for the 2 transformation condition. These B parameters reflect the amount that can improve due to speed up in the three conditions. The values A, α, and Bs were estimated to minimize the squared deviations of fitted functions to observed functions.
Figure 2.
Mean latency of planning time (thumb key pressing) as a function of practice time (days) for three transformation conditions.
fMRI.
In exploratory analysis, regions of interest (ROIs) were selected according to the interaction term in a 6 conditions × 12 scans ANOVA. Six conditions came from two levels of practice (days 1 and 5) and three levels of the complexity of trials. The 12 scans consisted of 2 scans before presentation of the equation and the 10 scans afterward (see Fig. 1). To have a conservative test that dealt with non-independence of scans, we used the Greenhouse-Geisser correction of assigning only 5 degrees of freedom to the numerator in the F-statistic for the interaction term. The interaction was examined in each voxel. To ignore the small particles, we selected regions that met the criteria of a minimum of 15 contiguous voxels with significant interaction at P ≤ 0.01. According to Forman et al. (14), the probability of false positive should be much lower than 0.01. Fig. 3 and Table 1 give the seven regions that achieve this level of significance, which are consistent with the major regions reported in experiment 2 of Anderson et al. (1).
Figure 3.
Activation map for slice 3 to slice 14 with a significant interaction between scan and six conditions (two of practice levels × three of transformation levels). Only regions with 15 or more contiguous voxels and P < 0.01 (degrees of freedom = 5) are shown. See Table 1 for identification of regions. The anterior commissure-posterior commissure line is six slices below slice 14 in this figure. Right side of the image is the left side of the brain.
Table 1.
ROI, locations of centroid, and significances
| ROI | Voxel count | Center Talairach coordinates | Max F (avg F) |
|---|---|---|---|
| Left motor (BA 4/3) | 123 | −36, −24, 49 | 7.98 (4.73) |
| Cingulate gyrus (BA 32/34) | 62 | 1, 2, 47 | 6.00 (4.35) |
| Left posterior parietal (BA 39/40) | 165 | −21, −61, 41 | 6.82 (4.74) |
| Precuneus (BA 7) | 96 | 4, −64, 39 | 7.37 (4.55) |
| Right posterior parietal (BA 40) | 61 | 28, −63, 42 | 5.49 (4.15) |
| Left prefrontal (BA 45/46/9) | 72 | −42, 19, 26 | 6.08 (4.30) |
| Polar frontal (BA 10) | 19 | −2, 58, 16 | 4.74 (3.03) |
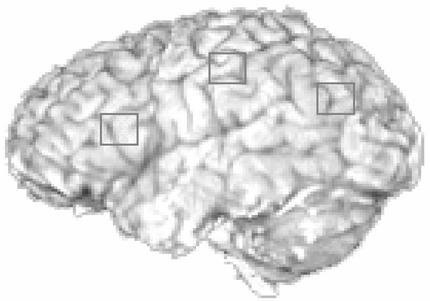
We paid more attention to the confirmatory analysis, in which we focused on three ROIs: a left motor area (BA 4/3), a left poster parietal area (BA 39/40), and a left prefrontal area (BA 45/46) (see Fig. 4). Each region was defined as 100 voxels (5 wide × 5 long × 4 deep), ≈16 × 16 × 13 mm3. The centers of these regions were set based on our previous work (1). This method gives the analysis the advantage of working with a priori defined regions. Nonetheless, the motor area overlaps substantially with the ROI 1 in Table 1 from the exploratory analysis. The posterior parietal region overlaps substantially with the ROI 3 in the exploratory analysis. It is well known that lateral posterior parietal areas (BA 7/40/39) are involved in visual-spatial mental imagery (compare ref. 15). Recently, Hirsch et al.** found evidence for common activity associated with imagery without external stimuli in two sensory modalities, visual and tactile, within both left and right hemispheres in the inferior parietal lobule (BA 40) among other areas in the left frontal lobes. Reichle et al. (16) found greater activation in this area when participants engage in an imagery strategy during language processing and that this is more concentrated in the left parietal regions. Perhaps it is concentrated on the left because of its connection with symbolic processing in their task, which is consistent with the task in our experiment. The posterior parietal region that we chose is lower than the posterior superior parietal lobe (PSPL) of Dehaene et al. (ref. 17; mean maxima −22, −68, 56) and more medial than their angular gyrus (AG; mean maxima −41, −66, 36). Our prefrontal particle is close to ROI 6 in the exploratory analysis. It is somewhat ambiguously located with respect to the ventral dorsal distinction, because it is across BA 45 and BA 46 along the inferior frontal sulcus. However, the retrieval function that we attribute to it is clearly more in keeping with the kinds of functions attributed to ventrolateral prefrontal cortex (18–20).
Figure 4.
An illustration of the three left ROIs for modeling. The Talairach coordinates of the left motor area is (−37, −25, 47), of the left posterior parietal lobe is (−23, −64, 34), and of left prefrontal region is (−40, 21, 21).
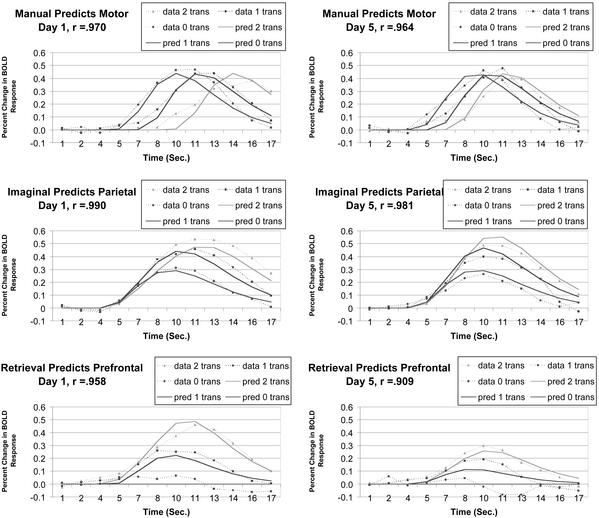
Fig. 5 displays the behavior of these three regions on day 1 and day 5 (percent change of BOLD response relative to the baseline defined by the average BOLD response of scans 1 to 3), along with the predictions of the ACT-R model to be presented. The motor region gives basically identical BOLD functions whose onset varies with the timing of the response. Thus, the BOLD function rises later when there are more transformations and the effect of practice on the motor particle is only to move the peaks together and forwards, which reflects shorter plan latencies after practice. The parietal particle is thought to reflect the mental imagery involved in transforming the equation. It is quite responsive to the number of transformations, but the effect of practice on the parietal particle is minimal, which is consistent with the idea that there is relatively little change in the imaged transformations. There is considerable reduction in left prefrontal cortex, which is thought to reflect retrieval of the facts about the new algebra. The prefrontal particle also shows a strong effect of number of transformations (note that the function is almost flat in the condition of no transformations).
Figure 5.
The ability in day 1 (Left) and day 5 (Right) of the manual buffer to predict the left motor particle, of the imaginal buffer to predict posterior parietal particle, and of the retrieval buffer to predict the left prefrontal particle.
ACT-R Modeling
ACT-R.
The ACT-R theory, a model of cognitive architecture (4), has made itself open to brain-imaging data in its current 5.0 version by postulating an association of its components with brain regions. It is possible to make a priori predictions about the level of activation in these regions. According to the theory, the external world and the internal system interact through a set of cortical buffers that hold information. Particularly important for the current experiment are the imaginal buffer, the manual buffer, and the retrieval buffer. The imaginal buffer holds a representation of the equation. The manual buffer, based on the EPIC system of Meyer and Kieras (21), is involved in programming finger actions on the data-glove. The retrieval buffer requests information from declarative memory and holds the retrieval results. The ACT-R 5.0 specifies when these buffers will be active during the performance of a task and for how long. Anderson et al. (1) described how to combine this information with the function of the BOLD response to an event to predict the BOLD signal. In the beginning of the next section we will review this methodology briefly.
The Prediction of BOLD Signal.
A number of researchers (e.g., refs. 22–24) have proposed that the BOLD response to an event varies according to the following function of time, t, since the event:
 |
where estimates of the exponent, a, have varied between 2 and 10. This is essentially a gamma function that will reach maximum at t = a time units after the event.
It was proposed that, while a buffer is active, it is constantly producing a change that will result in a BOLD response according to the above function. The observed fMRI response is integrated over the time that the buffer is active. Therefore, the observed BOLD response will vary with time as
 |
where M is the magnitude scale for response, s is the latency scale, and i(x) is 1 if the buffer is occupied at time x, and 0 otherwise. Note, because of the scaling factor, that the prediction is that the BOLD function will reach maximum at roughly t = a × s seconds.
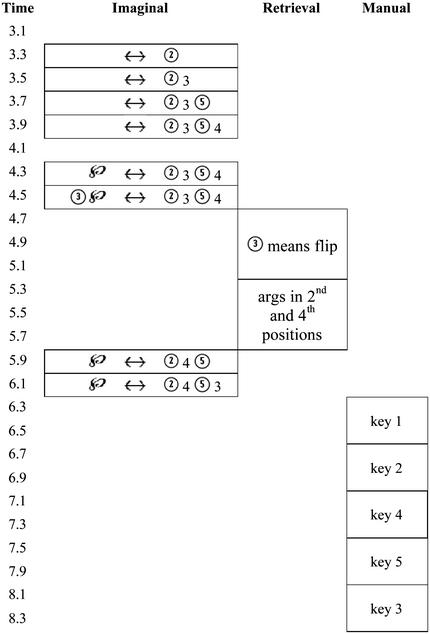
Fig. 6 shows the activity of the ACT-R buffers solving an equation
 |
that involves a single transformation to reach the solution
 |
The encoding begins with the identification of the ↔ sign and then the encoding of the symbols to the right of this sign. Then, it begins the process of encoding the elements to the left of the sign and their elimination to isolate the ℘. In the example in Fig. 6, six operations are required to encode the string and an additional two operations to perform the transformation. Each of these requires activity in the imaginal buffer. There are 5 such operations in the case of zero transformations and 10 in the case of two. With respect to retrievals in Fig. 6, two pieces of information have to be retrieved for the transformation that must be performed. One piece is the operation to perform (“flip” in Fig. 6) and the other is the identity of the terms to which to apply this operation (argument position in Fig. 6). There are five retrieval operations in the case of two transformations and none in the case of zero transformations. In all cases, there are final five motor operations, but their timing varies with how long the overall process takes.
Figure 6.
The approximate time line for the buffer activity in the ACT-R model for solving an equation.
The assumption is that the BOLD response in our left parietal particle will reflect the timings of activity in the imaginal buffer, the BOLD function in our left prefrontal particle will reflect the timings of the activities in the retrieval buffer, and the BOLD function in the motor particle will reflect the timing of the activities in the manual buffer. As developed in Anderson et al. (1), the timings of all of the buffer activities except the retrieval buffer are already constrained by the theory. The timing of the retrieval operations in the retrieval buffer remains a free parameter to be estimated to fit the latency data. Once the timings of the buffer actions are all set, we can predict the BOLD functions by estimating the magnitude parameter M, the exponent a, and the latency scale s for each brain region. The estimates of these parameters and the measurement of the quality of the prediction are given in Table 2. Note that the same parameters are being used to predict performance on both day 1 and day 5.
Table 2.
Parameters and the quality of the BOLD function prediction
| Imaginal | Retrieval | Manual | |
|---|---|---|---|
| Scale (s) | 1.634 | 1.473 | 1.353 |
| Exponent (a) | 4.379 | 4.167 | 4.602 |
| Magnitude | |||
| M Γ(a + 1)* | 2.297 | 1.175 | 1.834 |
| Chi-square† | 86.85 | 73.18 | 74.02 |
This is a more meaningful measure because the height of the function is determined by the exponent as well as M.
In calculating these chi-squares, we divided the summed deviations by the variance of the means calculated from the condition-by-subject interaction. The chi-squares measure has 69 degrees of freedom (72 observations minus 3 parameters). None of these reflect significant deviations.
We assumed that, in the circumstance of the current experiment, the practice will not change the procedure of the information processing, but the latencies of the retrievals were faster on day 5 than day 1. According to the base-level activation learning mechanism in ACT-R, we assume a power-law function describing speed up of the retrieval process with an exponent of 0.414 (estimated from Fig. 2); after 5 days of practice, the time for retrieval should be 5−0.414 = 0.514 of what it originally was. The retrieval time was estimated as 0.650 s on day 1 and 0.334 s on day 5. Although we had two separate retrieval times for day 1 and day 5, there is only one degree of freedom in their estimates, because one is constrained to be 0.514 of the other. Note also that we predict the amount of decrease in the BOLD function for the prefrontal region on day 5 as a parameter-free prediction derived from our fit to the latency function in Fig. 2.
Conclusions
This experiment replicated the findings of Anderson et al. (1) with respect to the involvement of the three cortical areas in this task but extended the study by looking at the effect of practice on the BOLD function and latency. As in past research, we confirmed a power-law speed up in the latency to answer the problems. The base-level activation learning mechanism proposed in ACT-R can predict the decrease of the latency of retrieval with practice, which in turn predicts well the change of BOLD response in the prefrontal area. Therefore, we were able to predict the behavior of these three regions with the ACT-R model. Specifically, first, motor area tracks activity of manual buffer. The form of the BOLD function is not sensitive to cognitive complexity or practice. The effect of these variables is to move identical BOLD functions forward or backward in time according to the timing of the response. Second, parietal area tracks activity in the imaginal buffer. The form of the BOLD function is sensitive to cognitive complexity but not practice. The only effect of practice is to somewhat compress the differences between the peaks of the different functions. Third, prefrontal area tracks activity of the retrieval buffer. The form of the BOLD function is sensitive to cognitive complexity and decreases with practice. We were able to predict the decrease in the BOLD function according to the same parameter that predicted the decrease in latency. This is strong evidence that the speed up reflects a decrease in retrieval time.
Along with Anderson et al. (1), this study shows that, with the guidance of a strong information-processing model and well-trained participants, one can not only interpret but also predict the BOLD response in various regions of the brain. It also shows that connecting an information-processing model like ACT-R with fMRI data will benefit research in both fields.
The technique by which the ACT-R model was fit to the BOLD function reflects some relatively new ideas. The basic methodology is not specific to ACT-R and can be used to fit a variety of models. The mathematics in this analysis is basically the same as what underlies the frequent image-analysis technique of correlating the BOLD signal with the temporal profile created by convolving the trial structure with a hypothetical hemodynamic function. Among the differences/elaborations are: (i) The temporal structure generated by an ACT-R model (or any information-processing model) is more fine-grained, generated from the internal operations of different components of the cognitive architecture. (ii) Each condition has a natural baseline, which is, in this study, defined by the beginning of the trial before the BOLD function has begun to rise; hence, there is no need to subtract out some neutral control condition. (iii) There is the additional assumption that the magnitude of the response reflects the duration of activation of that component. Combined with point ii, the theory becomes subject to strong parametric tests. (iv) There is an association of different regions of the brain with different components of the cognitive architecture. (v) One can estimate the parameters a and s of the BOLD function for a specific region rather than having to fit a single assumed BOLD function to all regions.
Acknowledgments
We thank Julie Fiez and Tim Rickard for their comments on this paper. This work was supported by National Science Foundation Research on Learning and Education Grant REC-0087396 (to J.R.A. and C.S.C.).
Abbreviations
- BOLD
blood oxygenation level-dependent
- fMRI
functional MRI
- BA
Brodmann areas
- ROI
region of interest
- ACT-R
adaptive control of thought-rational
Footnotes
Hirsch, J., Pratt, A., Mueller, B. & Park, C.M. (2002) Soc. Neurosci. Abstr., 714.1 (CD-ROM).
References
- 1. Anderson, J. R., Qin, Y.-L., Sohn, M.-H., Stenger, V. A. & Carter, C. S. (2003) Psychon. Bull. Rev., in press. [DOI] [PubMed]
- 2.Anderson J R, Reder L M, Lebiere C. Cognit Psychol. 1996;30:221–256. doi: 10.1006/cogp.1996.0007. [DOI] [PubMed] [Google Scholar]
- 3.Blessing S B, Anderson J R. J Exp Psychol Learn Mem Cognit. 1996;22:576–598. [Google Scholar]
- 4.Anderson J R, Lebiere C. The Atomic Components of Thought. Mahwah, NJ: Erlbaum; 1998. [Google Scholar]
- 5.Anderson J R. Learning and Memory. 2nd Ed. New York: Wiley; 2000. pp. 187–197. [Google Scholar]
- 6.Newell A, Rosenbloom P S. In: Cognitive Skills and Their Acquisition. Anderson J R, editor. Hillsdale, NJ: LEA; 1981. pp. 1–55. [Google Scholar]
- 7.Anderson J R, Fincham J M, Douglass S. J Exp Psychol. 1999;25:1120–1136. doi: 10.1037//0278-7393.25.5.1120. [DOI] [PubMed] [Google Scholar]
- 8.Rescorla R A, Wagner A R. In: Classical Conditioning: Current Research and Theory. Black A H, Prokasy W F, editors. II. New York: Appleton-Century-Crofts; 1972. pp. 64–99. [Google Scholar]
- 9.Heathcote A, Brown S, Mewhort D G K. Psychon Bull Rev. 2000;7:185–207. doi: 10.3758/bf03212979. [DOI] [PubMed] [Google Scholar]
- 10.Rickard T C. J Exp Psychol Gen. 1997;126:288–311. [Google Scholar]
- 11.Delaney P F, Reder L M, Staszewski J J, Ritter F E. Psychol Sci. 1998;1:1–7. [Google Scholar]
- 12.Raichle M E, Fiez J A, Videen T O, MacLeod A-M K, Pardo J V, Fox P T, Petersen S E. Cereb Cortex. 1994;4:8–26. doi: 10.1093/cercor/4.1.8. [DOI] [PubMed] [Google Scholar]
- 13.Petersen S E, Mier H V, Fiez J A, Raichle M E. Proc Natl Acad Sci USA. 1998;95:853–860. doi: 10.1073/pnas.95.3.853. [DOI] [PMC free article] [PubMed] [Google Scholar]
- 14.Forman S D, Cohen J D, Fitzgerald M, Eddy W F, Mintun M A, Noll D C. Magn Reson Med. 1995;33:636–649. doi: 10.1002/mrm.1910330508. [DOI] [PubMed] [Google Scholar]
- 15.Cabeza R, Nyberg L. J Cognit Neurosci. 2000;12:1–47. doi: 10.1162/08989290051137585. [DOI] [PubMed] [Google Scholar]
- 16.Reichle E D, Carpenter P A, Just M A. Cognit Psychol. 2000;40:261–295. doi: 10.1006/cogp.2000.0733. [DOI] [PubMed] [Google Scholar]
- 17. Dehaene, S., Piazza, M., Pinel, P. & Cohen, L. (2003) Cognit. Neuropsychol., in press. [DOI] [PubMed]
- 18.Petrides M. In: Handbook of Neuropsychology. Boller F, Grafman J, editors. Vol. 9. Amsterdam: Elsevier; 1994. pp. 59–82. [Google Scholar]
- 19.Fletcher P C, Henson R N A. Brain. 2000;124:849–881. doi: 10.1093/brain/124.5.849. [DOI] [PubMed] [Google Scholar]
- 20.Tompson-Schill S L, D'Esposito M, Aguirre G K, Farah M J. Proc Natl Acad Sci USA. 1997;94:14792–14797. doi: 10.1073/pnas.94.26.14792. [DOI] [PMC free article] [PubMed] [Google Scholar]
- 21.Meyer D E, Kieras D E. Psychol Rev. 1997;104:3–65. doi: 10.1037/0033-295x.104.1.3. [DOI] [PubMed] [Google Scholar]
- 22.Boyton G M, Engel S A, Glover G H, Heeger D J. J Neurosci. 1996;16:4207–4221. doi: 10.1523/JNEUROSCI.16-13-04207.1996. [DOI] [PMC free article] [PubMed] [Google Scholar]
- 23.Cohen M S. NeuroImage. 1997;6:93–103. doi: 10.1006/nimg.1997.0278. [DOI] [PubMed] [Google Scholar]
- 24.Dale A M, Buckner R L. Hum Brain Mapp. 1997;5:329–340. doi: 10.1002/(SICI)1097-0193(1997)5:5<329::AID-HBM1>3.0.CO;2-5. [DOI] [PubMed] [Google Scholar]


