Abstract
Escherichia coli DnaA binds to 9 bp sequences (DnaA boxes) in the replication origin, oriC, to form a complex initiating chromosomal DNA replication. In the present study, we determined the crystal structure of its DNA-binding domain (domain IV) complexed with a DnaA box at 2.1 Å resolution. DnaA domain IV contains a helix–turn–helix motif for DNA binding. One helix and a loop of the helix– turn–helix motif are inserted into the major groove and 5 bp (3′ two-thirds of the DnaA box sequence) are recognized through base-specific hydrogen bonds and van der Waals contacts with the C5-methyl groups of thymines. In the minor groove, Arg399, located in the loop adjacent to the motif, recognizes three more base pairs (5′ one-third of the DnaA box sequence) by base-specific hydrogen bonds. DNA bending by ∼28° was also observed in the complex. These base-specific interactions explain how DnaA exhibits higher affinity for the strong DnaA boxes (R1, R2 and R4) than the weak DnaA boxes (R3 and M) in the replication origin.
INTRODUCTION
In Escherichia coli, the oriC region (245 bp), where chromosomal DNA replication is initiated (1), contains five distributed binding sites (DnaA boxes) for the DnaA protein (2,3), a key factor for the initiation of chromosomal DNA replication. In the first step of replication initiation, DnaA binds to the DnaA boxes to form a multimeric nucleoprotein complex containing approximately 20 DnaA molecules at the oriC region (initial complex formation) (1,4). The formation of this multimeric protein–DNA complex is thought to be a common step in chromosomal replication for all cellular organisms (5,6). DnaA has high affinity for both ATP and ADP, and only the ATP-bound DnaA can unwind the double helix of the AT-rich 13mer sequence repeats, which are located near the DnaA-binding sites within oriC (open complex formation) (4,7,8). The DnaB helicase is assembled onto the open complex and forms a mobile complex with the DnaG primase (1). After primer RNA synthesis by DnaG, a homodimer of the β subunit of DNA polymerase III (pol III) is assembled on the oriC region, and promotes complementary strand synthesis. The pol III β subunit is a sliding clamp that binds the DNA and accelerates the hydrolysis of DnaA-bound ATP in the presence of the Hda/IdaB protein, which probably mediates the DnaA–β subunit interaction. This DnaA inactivation prevents extra initiations of replication within a single cell cycle (9,10).
The DnaA protein is highly conserved among bacteria (11–13), and the eukaryotic counterpart is also found as a subunit of the origin recognition complex (5,14). Sequence alignments of the DnaA proteins have suggested that the protein is composed of four domains, I, II, III and IV (15,16). Domain I is involved in the DnaA–DnaA interaction, while domain II does not seem to have a replication initiation function. Domain III contains the Walker-type ATPase motif, and is considered to be a major region for the DnaA–DnaA interaction. Domain IV is the DNA-binding region, which specifically binds to the DnaA box sequence. Recently, the crystal structure of the DNA-free DnaA protein domains III/IV from the thermophile Aquifex aeolicus was determined; however, the orientations of domains III and IV in this structure exhibited a steric clash with DNA, when the DNA was modeled on the structure (17). A large conformational change of the DnaA domains III and IV must be required upon DNA binding.
In order to initiate chromosomal DNA replication, DnaA specifically recognizes 9 bp of the five DnaA boxes, R1, R2, R3, R4 and M, in the oriC region. The in vivo footprinting analysis in synchronized cells revealed that DnaA binds to the R1, R2 and R4 sites throughout most of the cell cycle (18,19). Biochemical experiments have shown that DnaA binds to the R1, R2 and R4 sequences more strongly than to the R3 and M sequences. The R3 site is occupied by DnaA at the initiation period for replication. These sequential DnaA binding events induce DNA bending at the DnaA boxes (20), and promote the assembly of the initial complex, where the oriC DNA is wrapped around the DnaA multimer (21).
In the present study, we have determined the crystal structure of the DNA-binding domain (domain IV, amino acid residues 374–467) of the Escherichia coli DnaA protein complexed with a DnaA box 13mer oligonucleotide at 2.1 Å resolution. The structure explains how DnaA recognizes the DnaA boxes.
MATERIALS AND METHODS
Construction and purification of the DnaA domain IV
The DNA fragment encoding DnaA domain IV was ligated into the NdeI site of the T7 polymerase expression vector, pET-15b (Novagen). The selenomethionine-labeled protein was overexpressed in the cell-free protein expression system, as described previously (22). The supernatant containing the His6-tagged DnaA domain IV was loaded onto a HiTrap Chelating (NiSO4) column (5 ml) (Amersham Biosciences), and the column was washed with buffer A [50 mM sodium phosphate buffer (pH 8.0) containing 500 mM NaCl and 20 mM imidazole]. Then, the protein was eluted with a 16 column volume linear gradient of 20–1000 mM imidazole in 50 mM phosphate buffer (pH 8.0) containing 500 mM NaCl. The fractions containing the protein were dialyzed against buffer B [20 mM Tris–HCl buffer (pH 8.0) containing 200 mM KCl, 1 mM EDTA and 15% glycerol], and thrombin protease (1 U/100 µg fusion protein) (Amersham Biosciences) was added to uncouple the His6 tag from the DnaA segment. The reaction proceeded at 25°C for 3 h. After the removal of the His6 tag, DnaA domain IV was loaded onto a HiTrap Heparin column (5 ml) (Amersham Biosciences). The column was washed with 20 column volumes of buffer B, and the protein was eluted with a 16 column volume linear gradient of 200–1000 mM KCl in 20 mM Tris–HCl buffer (pH 8.0) containing 1 mM EDTA and 15% glycerol. The peak fractions of DnaA domain IV were dialyzed against buffer B.
DNA substrates
The HPLC-purified oligonucleotides were purchased from Nihon Gene Research Laboratories. The nucleotide sequences were as follows: 13mer strand 1, 5′-T-G-T-T-A-T-C-C-A-C-A-G-G-3′; 13mer strand 2, 5′-C-C-T-G-T-G-G-A-T-A-A-C-A-3′. This sequence was derived from the DnaA-binding site, R1, of the E.coli oriC region. The DnaA box consensus sequence, which is recognized by DnaA, is presented in bold.
Crystallization and data collection
The purified DnaA domain IV was incubated with the double-stranded 13mer oligonucleotide, and the resulting complex was separated from the free protein and DNA by gel filtration chromatography on a HiLoad Superdex 75 column (Amersham Biosciences). The purified complex was concentrated up to 5 mg protein/ml, and co-crystals were obtained by the hanging drop method after mixing an equal volume of 5 mg/ml DnaA domain IV with a reservoir solution of 0.1 M Tris–HCl buffer (pH 8.4) containing 0.2 M magnesium formate and 18% polyethylene glycol 8000. The crystals of the DnaA domain IV–DNA complex were suspended for 1 min in the reservoir solution with 10% 2-methyl-2,4-pentanediol, and were soaked in a cryo-protectant solution of 0.1 M Tris–HCl buffer (pH 8.4) containing 0.2 M magnesium formate, 18% polyethylene glycol 8000 and 20% 2-methyl-2,4-pentanediol. Then, the crystals were flash frozen in a stream of N2 gas (100 K). The crystals belong to the tetragonal space group P41212, with unit cell constants of a = 50.385 Å, b = 50.385 Å and c = 158.830 Å, and contain one complex per asymmetric unit. The crystal structure was solved by the multiwavelength anomalous diffraction (MAD) method (23), using the selenomethionine-labeled DnaA DNA-binding domain. To avoid overlapping of the diffraction spots, we obtained the data with a camera distance of 200 mm and recorded the diffraction spots up to 2.1 Å resolution. Therefore, the four-wavelength MAD data set was collected up to 2.1 Å resolution from beamline BL41XU at SPring-8 in Harima.
Structure determination and refinement
The data obtained by the MAD method (23) using the selenomethionine-labeled DnaA domain IV, were processed and were scaled using the DENZO and SCALEPACK programs (24). The scaled data set at the peak wavelength of the MAD experiment up to 2.5 Å was used to calculate the normalized structure factor with DREAR (25), and the resulting data were input into SnB (25) to locate the selenium atoms. After trials of SnB, two consistent peaks were picked out of the three atoms expected in the asymmetric unit, and were input into the program SHARP (26) to calculate the initial phases and the heavy atom refinement at 2.1 Å resolution. The resulting initial phases were refined with density modification using SOLOMON and DM (27). An atomic model was fitted into the electron density map using the graphics program O (28), and was refined by energy minimization and simulated annealing procedures with CNS (29). The final model contains 752 atoms of DnaA domain IV, 527 atoms of DNA and 128 water molecules. The Ramachandran plot of the final structure showed 96.6% of the residues in the most favorable regions, 3.4% of the residues in the additionally allowed regions and none of the residues in the generously allowed and disallowed regions. Graphic figures were created using the RIBBONS (30) and SPOCK programs. The atomic coordinates of the DnaA domain IV complexed with the DnaA box 13mer have been deposited in the RCSB and PDB (RCSB id code, rcsb005525; PDB id code, 1J1V).
RESULTS AND DISCUSSION
DnaA domain IV structure
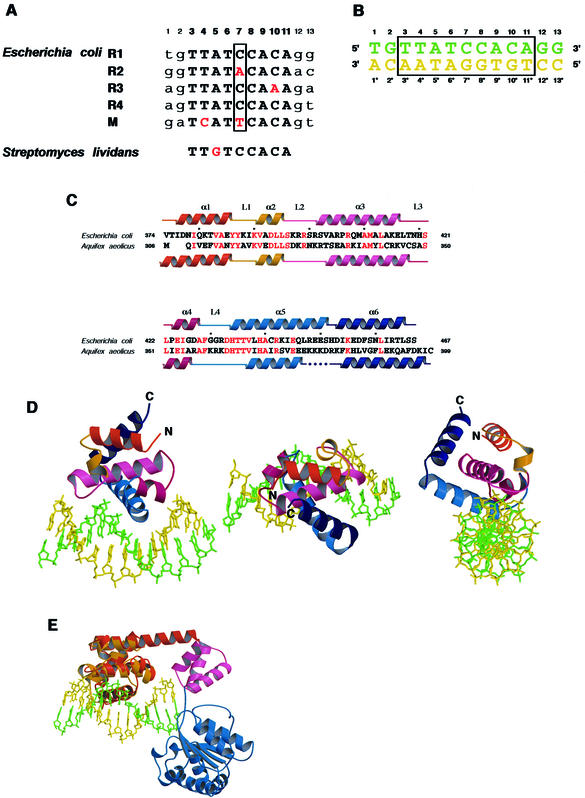
In the E.coli oriC region, there are three strong DnaA boxes, R1, R2 and R4, with the same 9mer consensus sequence (5′-T-T-A-T-N-C-A-C-A-3′), and two weak DnaA boxes, R3 (5′-T-T-A-T-C-C-A-A-A-3′) and M (5′-T-C-A-T-T-C-A-C-A-3′) (Fig. 1A). The 13mer oligonucleotide used in the present study is T-G-T-T-A-T-C-C-A-C-A-G-G (Fig. 1B), which is derived from the R1 DnaA-binding site with two flanking bases on both sides. The crystal structure was solved by the MAD method, using crystals of the selenomethionine-substituted sample (Table 1) produced by the cell-free protein expression system (22). The crystal structure of DnaA domain IV is composed of six α-helices (α1–α6) and four loops (L1–L4) (Fig. 1C and D), which are consistent with the secondary structure analysis by NMR (31), and is similar to the DNA-free structure of the DnaA protein from A.aeolicus (17) [root-mean-square deviation (rmsd) 1.6 Å]. Helices α3, α4 and α5 form a helix–turn–helix structure, which binds to the major groove of the DNA. In the DNA-free structure of the A.aeolicus DnaA protein, the C-terminal portion of the α5 helix was disordered, whereas the region was observed in the E.coli DnaA–DNA complex (Fig. 1C).
Figure 1.
(Opposite) Crystal structure of DnaA domain IV complexed with DnaA box DNA. (A) Alignment of the DnaA box sequences, R1, R2, R3, R4 and M, in E.coli oriC. The bottom row shows the DnaA box sequence found in Streptomyces lividans. Numbers indicate base positions from the 5′ end of the top strand. Capital letters indicate the consensus sequence of the DnaA boxes and small letters indicate the two flanking bases of the DnaA boxes. Red letters indicate bases that are not conserved among those in the five DnaA box sequences. The box shows position 7, which is not recognized by DnaA domain IV in the crystal structure. (B) The DNA containing the R1 sequence of the DnaA box used in the structural analysis of the DnaA domain IV–DNA complex. The box indicates the DnaA box consensus sequence. Numbers without asterisks indicate base positions from the 5′ end of the top strand, and numbers with asterisks indicate base positions from the 3′ end of the bottom strand. (C) The secondary structure of the E.coli DnaA domain IV is presented in the top row and that of the A.aeolicus DnaA domain IV is presented in the bottom row. The amino acid sequence of the A.aeolicus DnaA domain IV is aligned to the E.coli DnaA domain IV. Conserved amino acid residues are indicated by red letters. (D) Overall structure of the DnaA domain IV–DNA complex. Three views from different angles are shown. The colors of the protein and the DNA strands correspond to those in (B) and (C). (E) The superimposed model of the E.coli DnaA domain IV and the A.aeolicus DnaA domain III/IV structure (17). The E.coli domain IV in the complex with DNA is colored orange. The A.aeolicus DnaA domains IIIa, IIIb and IV are colored blue, pink and red, respectively.
Table 1. X-ray data collection, phasing and refinement statistics.
| SeMet crystal | |||||
|---|---|---|---|---|---|
| Peak | Edge | Remote1 | Remote2 | ||
| Data collection | |||||
| Beam line | BL41XU, SPring-8 | ||||
| Wavelength (Å) | 0.9792 | 0.9795 | 0.9840 | 0.9736 | |
| Resolution (Å) | 50–2.1 | 50–2.1 | 50–2.1 | 50–2.1 | |
| Unique reflections | 12 618 | 12 614 | 12 623 | 12 636 | |
| Redundancy | 12.5 | 12.8 | 12.6 | 12.8 | |
| Completeness (%) | All data | 99.0 | 99.0 | 98.9 | 99.0 |
| Last shell | 98.8 | 98.1 | 97.8 | 99.3 | |
| I/σ(I) | All data | 24.2 | 24.1 | 23.9 | 23.1 |
| Last shell | 20.6 | 19.9 | 16.7 | 18.7 | |
| Rsyma (%) | All data | 5.5 | 4.1 | 3.7 | 4.4 |
| Last shell | 11.0 | 9.1 | 9.3 | 10.6 | |
| Phasing statistics (50–2.1 Å) | |||||
| No. of sites | 2 | 2 | 2 | 2 | |
| Phasing power | iso | 1.51 | 2.25 | 1.54 | |
| (1.20)b | (1.50)b | (1.05)b | |||
| Rcullisc | iso | 0.72 | 0.57 | 0.71 | |
| (0.67)b | (0.57)b | (0.71)b | |||
| ano | 0.33 | 0.50 | 0.94 | 0.42 | |
| FOM | 0.83 | (0.81)b | |||
| Refinement statistics | |||||
| Resolution (Å) | 2.1 | ||||
| Protein atoms | 752 | ||||
| DNA atoms | 527 | ||||
| Water oxygens | 128 | ||||
| Rwork (%) | 22.92 | ||||
| Rfree (%)d | 24.89 | ||||
| r.m.s.d. bond length (Å) | 0.0091 | ||||
| r.m.s.d. bond angles (°) | 1.15 | ||||
| r.m.s.d. dihedrals (°) | 17.40 | ||||
| r.m.s.d. impropers (°) | 1.24 |
aRsym = Σ|Iavg – Ii|/ΣIi.
bParentheses represent the values for centric reflections. hkl.
cRcullis = Σ||FPH + FP| – FH(calc)|/Σ|FPH|.
dRfree is calculated for 10% of randomly selected reflections excluded from refinement.
To obtain insight into the higher order nucleoprotein structure, we superimposed the E.coli DnaA domain IV–DNA complex structure on the DNA-free A.aeolicus DnaA domain III/IV structure (Fig. 1E). DnaA domain III includes a motif conserved in the AAA+ protein superfamily, which functions in ATP binding/hydrolysis and multimer formation (32). As shown in Figure 1E, the DNA bound to domain IV has a collision with the domain III region in the superimposed model. The DNA-free domain IV is only loosely tethered to domain III, and the flexibility in the domain–domain orientation may be important for DNA binding in the multimer form (17).
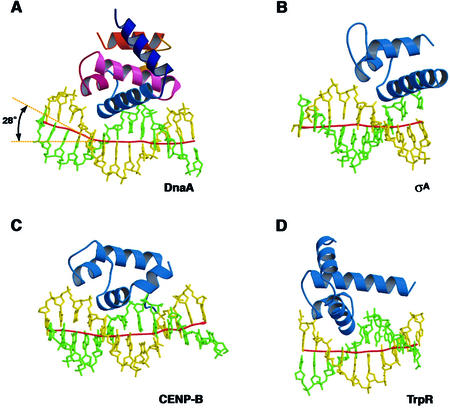
The DnaA domain IV region (amino acid residues 398–464) is structurally related to the E.coli trp repressor (TrpR, amino acid residues 45–102) (33) (rmsd 3.2 Å for the Cα atoms), and the helix–turn–helix region (amino acid residues 392–453) of DnaA has similarity to the DNA-binding domain (amino acid residues 377–428) from the Thermus aquaticus σA protein (34) (rmsd 2.1 Å for the Cα atoms) and domain 1 (amino acid residues 1–56) of the human centromere-binding protein B (CENP-B) (35) (rmsd 2.5 Å for the Cα atoms).
Base recognition in the major groove
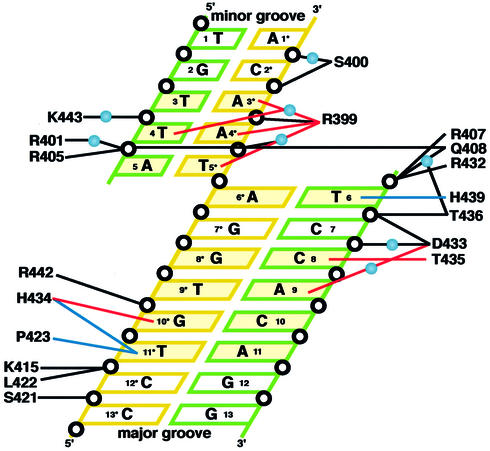
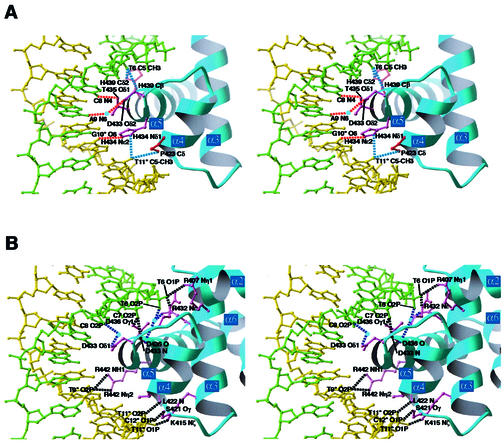
Eight out of the 9 bp of the DnaA box consensus sequence (5′-T-T-A-T-N-C-A-C-A-3′) are essential for sequence-specific binding of DnaA (20,36). In the present complex structure, DnaA domain IV makes base-specific interactions with the major and minor grooves of the DnaA box DNA (Fig. 2). The α5 helix lies along the major groove and recognizes the essential residues, T6, C8 and G10* (Fig. 3A). The C5-methyl group of T6 is recognized by a van der Waals contact with the side chain of His439, and the NH2 group of C8 and the O6 atom of G10* form hydrogen bonds with the OH group of Thr435 and the Nε2 atom of His434, respectively (Figs 2 and 3A). The imidazole ring of His434 also makes van der Waals contacts with the C5-methyl group of T11*. In addition to these interactions with α5, Pro423 and Asp433, which are located in α4 and L4, respectively, are also important in the major groove recognition. The Cγ and Cδ atoms of Pro423 make van der Waals contacts with the C5-methyl group of T11*, and Oδ2 of Asp433 forms a hydrogen bond with the NH2 group of A9 through a water molecule (Figs 2 and 3A). Interestingly, mutations in Asp433, His434 and Thr435, which recognize C8, A9, G10* and T11*, cause a specific defect in the DnaA box sequence recognition without affecting the non-specific DNA-binding abilities (37,38). Therefore, these base-specific interactions in the major groove are essential for the sequence recognition by DnaA.
Figure 2.
Schematic diagram summarizing the DNA contacts by DnaA domain IV. The essential base pairs in the DnaA box consensus sequence are colored yellow. Water molecules are denoted as light blue spheres. Open circles represent phosphate groups. Base-specific hydrogen bonds are indicated with red lines and van der Waals contacts with the C5-methyl groups of thymines are indicated by blue lines. Hydrogen bonds and salt bridges with the backbone phosphate groups are indicated with black lines. The colors and the numbers of the DNA strands correspond to those in Figure 1.
Figure 3.
Stereo views of the interactions in the major groove. The DNA strands shown in green and yellow correspond to those in Figure 1. (A) Base-specific interactions. Dotted lines in red represent hydrogen bonds and those in blue represent van der Waals interactions. Waters are represented by light blue spheres. Side chains forming hydrogen bonds are colored purple and those forming van der Waals bonds are colored red. (B) Interactions with the backbone phosphate groups. Dotted lines in black represent hydrogen bonds and those in blue represent water-mediated hydrogen bonds. Waters are represented by light blue spheres. Side chains forming hydrogen bonds are colored purple.
The C7:G7* base pair did not form any specific interactions with DnaA domain IV (Fig. 2). This base pair is not conserved among the five DnaA box sequences in oriC (20,36). These facts indicate that the C7:G7* base pair is not involved in the sequence recognition by DnaA.
Interactions with DNA backbone phosphate groups in the major groove
In addition to the specific interactions with DNA bases, DnaA domain IV forms many interactions with the backbone phosphate groups in the major groove (Figs 2 and 3B). The side chains of Arg407, Gln408 and Lys415, which are located in α3, interact with the T6, T6 and T11* phosphate groups, respectively. Mutations of the Arg407 and Lys415 residues caused DNA-binding deficiencies (38), indicating the importance of these interactions with the backbone phosphate groups. In the L3 loop, Oγ of Ser421 and the main chain NH group of Leu422 interact with the C12* and T11* phosphate groups, respectively. The side chain of Arg432 and the main chain NH group of Asp433, which are located in L4, interact with the T6 and C7 phosphate groups, respectively. The side chain of Asp433 also forms a water-mediated hydrogen bond with the C8 phosphate group. In α5, Thr436, which severely reduced DNA binding when it was replaced by alanine (38), forms a water-mediated hydrogen bond with the T6 phosphate group, and also interacts with the C7 phosphate group. The side chain of Arg442, which is located in α5, interacts with the T9* phosphate group.
Base recognition and interactions with backbone phosphate groups in the minor groove
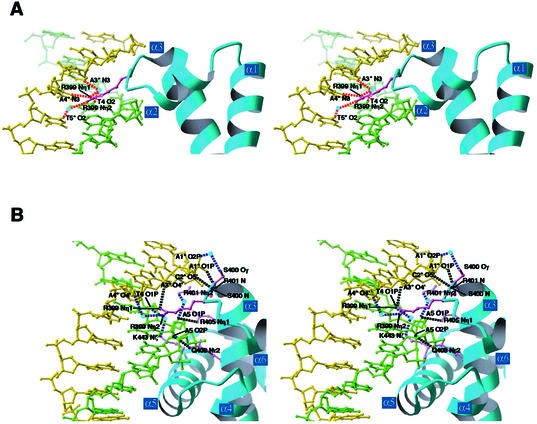
In the minor groove, the T3:A3*, T4:A4* and A5:T5* base pairs are recognized with only one amino acid residue, Arg399, which is located in the L2 loop (Figs 2 and 4A). The two side chain NH2 groups of Arg399 form a hydrogen bond with N3 of A4* and three water-mediated hydrogen bonds with N3 of A3*, O2 of T4 and O2 of T5*. In contrast to the residues responsible for the major groove recognition, Arg399 is essential for both sequence recognition and DNA binding, because the DnaA mutant with a mutation in Arg399 could not bind DNA (38). The interactions between Arg399 and the backbone phosphate groups of A4* and A3* are probably important to stabilize the DnaA–DNA interaction (Figs 2 and 4B).
Figure 4.
Stereo views of the interactions in the minor groove. The DNA strands shown in green and yellow correspond to those in Figure 1. (A) Base-specific interactions. Dotted lines in red represent hydrogen bonds. Waters are represented by light blue spheres. The Arg399 side chain forming hydrogen bonds is colored purple. (B) Interactions with the backbone phosphate groups. Dotted lines in black represent hydrogen bonds and those in blue represent water-mediated hydrogen bonds. Waters are represented by light blue spheres. Side chains forming hydrogen bonds are colored purple.
In the minor groove, other interactions with the backbone phosphate groups were also found (Figs 2 and 4B). The side chains of Arg401, Arg405 and Gln408, which are located in α3, interact with the A5 phosphate group. In the L2 loop, Ser400 interacts with the C2* and A1* phosphate groups. Lys443 forms a water-mediated hydrogen bond with the T4 phosphate group (Figs 2 and 4B), and the replacement of this residue with glutamate reduced the DNA binding (38).
DNA bending
Previous biochemical experiments have shown that DnaA induces DNA bending of ∼40° (20). Consistently, the DnaA box DNA showed an induced local DNA kink of ∼28° by the base-specific interactions and the interactions with the backbone phosphate groups in the major and minor grooves (Fig. 5). Similar DNA kinks were also observed in the complexes with the human CENP-B and T.aquaticus σA proteins (34,35), which show structural similarities with DnaA domain IV. These facts suggest that the DNA kink found in the DnaA domain IV–DNA complex may be an intrinsic property among this class of proteins, although we cannot eliminate the possibility that the DNA bending could be induced by crystal packing interactions. For duplex opening at oriC, supercoiling of this DNA region is required (1). The DnaA multimer is considered to wrap the oriC DNA by DNA bending at several points, thus introducing the supercoiling. This DnaA multimer formation with DNA bending may be the basis for the initial complex formation, which is the crucial step required for duplex opening.
Figure 5.
Structural comparisons of the DnaA domain IV–DNA complex (A) with the complexes of the Thermus aquaticus σA protein (B) (34), the human CENP-B domain 1 (C) (35) and the E.coli trp repressor (TrpR) (D) (33). The local DNA axis was calculated by the program CURVES (43) and is shown as a red line.
Comparison with other DnaA box sequences
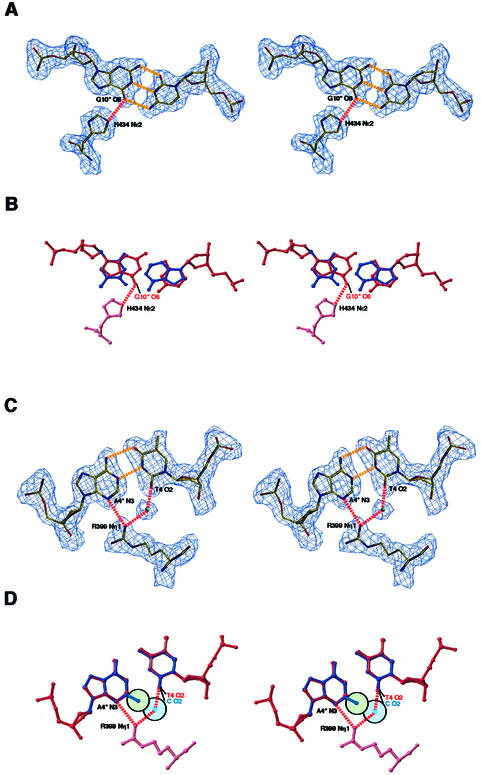
The 9mer consensus sequence of the DnaA box, 5′-T-T-A-T-N-C-A-C-A-3′, is highly conserved among bacterial replication origins (6). The E.coli oriC region contains five DnaA box sequences, R1, R2, R3, R4 and M. As shown in Figure 1A, the R1 and R4 sequences are identical, and the R2 sequence contains an A:T base pair at position 7 (C7:G7* in R1), which is not involved in the sequence recognition by DnaA domain IV, as revealed by the present crystal structure (Fig. 2). The R3 sequence contains an A:T base pair at position 10 (C10:G10* in R1), and the M sequence contains C:G and T:A base pairs at positions 4 and 7 (T4:A4* and C7:G7* in R1, respectively). These differences in the R3 and M sequences affect the DnaA binding affinities. Biochemical experiments showed that the R1, R2 and R4 sequences, which are identical in all 8 bp recognized by DnaA, have higher affinity for DnaA than the R3 and M sequences (20,39). In the present structure with the R1 sequence, the O6 of G10*, which is replaced by thymine in the R3 sequence, forms a hydrogen bond with His434 (Fig. 6A). Therefore, this hydrogen bond between His434 and G10* is important for the high-affinity binding, although the thymine O4 atom at position 10 in the R3 sequence may form a hydrogen bond with His434, instead of the O6 of G10* in the R1 sequence (Fig. 6B).
Figure 6.
(Next page) The base-specific interactions with His434 and Arg399. (A) Stereo view of the (2|Fo| – |Fc|) electron density map for His434 and C10:G10*. The hydrogen bond between the His434 Nε and G10* O6 atoms is indicated by a dotted red line and those between the C:G base pair are indicated by dotted yellow lines. (B) Stereo view of a model for the interaction between the His434 Nε and thymine O4 atoms in the R3 sequence. The A:T base pair (colored blue) of position 10 in the R3 sequence is superimposed on the C10:G10* base pair (colored red) of the R1 sequence. (C) Stereo view of the (2|Fo| – |Fc|) electron density map for Arg399 and T4:A4*. The hydrogen bonds between the Arg399 Nη and T4 O2 or A4* N3 atoms are indicated by a dotted red line and those between the T:A base pair are indicated by dotted yellow lines. (D) Stereo view of a model for the interaction between the Arg399 Nη and cytosine O2 atoms in the M sequence. The C:G base pair (colored blue) of position 4 in the M sequence is superimposed on the T4:A4* base pair (colored red) of the R1 sequence. The van der Waals radii of the oxygen (1.4 Å) of the water molecule and the NH2 group (1.65 Å) are indicated in light blue and green circles, respectively.
In the M sequence, the T4:A4 base pair, in which the O2 of T4 and the N3 of A4* form hydrogen bonds with Arg399 in the R1 sequence (Fig. 6C), is replaced by the C:G base pair. A hydrogen bond with the N3 of A4* in the R1 sequence may be complemented by the N3 of guanine in the M sequence; however, the guanine NH2 group in the C:G base pair has a steric clash with the water molecule, which mediates hydrogen bonding between Arg399 and the O2 of T4 in the R1 sequence (Fig. 6D). This suggests that the water-mediated hydrogen bond between Arg399 and the O2 of cytosine at position 4 cannot be formed in the M sequence. Thus, these interactions with His434 and Arg399 may be important to create the high-affinity binding with the R1, R2 and R4 sequences.
Exceptionally, the Streptomyces and Micrococcus DnaA box consensus sequence contains the G:C base pair at position 5, instead of the A5:T5* base pair in the R1 sequence. The Streptomyces DnaA box showed about three times lower affinity for DnaA than the E.coli R1 sequence (40). A water-mediated hydrogen bond between Arg399 and T5*, which cannot be formed with the Streptomyces DnaA box, may also contribute to the high-affinity binding by DnaA.
Concluding remarks
In the present study, we determined the crystal structure of DnaA domain IV complexed with the R1 DnaA box DNA at 2.1 Å resolution, which revealed that DnaA domain IV recognizes the DnaA box sequence in the major and minor grooves through base-specific hydrogen bonds and van der Waals contacts. These base-specific interactions also explain the molecular basis of the difference in the DnaA binding affinities among the DnaA boxes. In addition to these base-specific interactions, DnaA domain IV forms many interactions with the backbone phosphate groups. These interactions between DnaA domain IV and DNA induced a local DNA kink of ∼28°, which may be essential for the initial complex formation at the oriC region. The E.coli chromosome contains 308 DnaA boxes (20). In some cases, the DnaA boxes are located in the promoter region, and are clustered in the datA locus, which is considered to be a cis element for DnaA storage (41,42). The present complex structure provides an important structural basis for understanding the specific functions of these DnaA boxes, in addition to the molecular mechanism for replication initiation.
Acknowledgments
ACKNOWLEDGEMENTS
We thank Dr M. Kawamoto (JASRI) for help with collecting diffraction data at SPring-8, Ms N. Obayashi for the cell-free protein production and Ms T. Nakayama for the manuscript preparation. This work was supported by the Bioarchitect Research Program (RIKEN) and by the Ministry of Education, Sports, Culture, Science and Technology of Japan.
DDBJ/EMBL/GenBank accession no. 1J1V
REFERENCES
- 1.Kornberg A. and Baker,T.A. (1992) DNA Replication. W.H. Freeman and Co., New York, NY.
- 2.Fuller R.S., Funnell,B.E. and Kornberg,A. (1984) The dnaA protein complex with the E. coli chromosomal replication origin (oriC) and other DNA sites. Cell, 38, 889–900. [DOI] [PubMed] [Google Scholar]
- 3.Matsui M., Oka,A., Takanami,M., Yasuda,S. and Hirota,Y. (1985) Sites of dnaA protein-binding in the replication origin of the E. coli K-12 chromosome. J. Mol. Biol., 184, 529–533. [DOI] [PubMed] [Google Scholar]
- 4.Bramhill D. and Kornberg,A. (1988) A model for initiation at origins of DNA replication. Cell, 54, 915–918. [DOI] [PubMed] [Google Scholar]
- 5.Lee D.G. and Bell,S.P. (2000) ATPase switches controlling DNA replication initiation. Curr. Opin. Cell Biol., 12, 280–285. [DOI] [PubMed] [Google Scholar]
- 6.Messer W. (2002) The bacterial replication initiator DnaA: DnaA and oriC, the bacterial mode to initiate DNA replication. FEMS Microbiol. Rev., 26, 355–374. [DOI] [PubMed] [Google Scholar]
- 7.Hwang D.S. and Kornberg,A. (1992) Opening of the replication origin of Escherichia coli by DnaA protein with protein HU or IHF. J. Biol. Chem., 267, 23083–23086. [PubMed] [Google Scholar]
- 8.Speck C. and Messer,W. (2001) Mechanism of origin unwinding: sequential binding of DnaA to double- and single-stranded DNA. EMBO J., 20, 1469–1476. [DOI] [PMC free article] [PubMed] [Google Scholar]
- 9.Katayama T., Kubota,T., Kurokawa,K., Crooke,E. and Sekimizu,K. (1998) The initiator function of DnaA protein is negatively regulated by the sliding clamp of the E. coli chromosomal replicase. Cell, 94, 61–71. [DOI] [PubMed] [Google Scholar]
- 10.Kato J. and Katayama,T. (2001) Hda, a novel DnaA-related protein, regulates the replication cycle in Escherichia coli. EMBO J., 20, 4253–4262. [DOI] [PMC free article] [PubMed] [Google Scholar]
- 11.Skovgaard O. and Hansen,F.G. (1987) Comparison of dnaA nucleotide sequences of Escherichia coli, Salmonella typhimurium and Serratia marcescens. J. Bacteriol., 169, 3976–3981. [DOI] [PMC free article] [PubMed] [Google Scholar]
- 12.Fujita M.Q., Yoshikawa,H. and Ogasawara,N. (1990) Structure of the dnaA region of Micrococcus luteus: conservation and variations among eubacteria. Gene, 93, 73–78. [DOI] [PubMed] [Google Scholar]
- 13.Kaguni J.M. (1997) Escherichia coli DnaA protein: the replication initiator. Mol. Cells, 7, 145–157. [PubMed] [Google Scholar]
- 14.Liu J., Smith,C.L., DeRyckere,D., DeAngelis,K., Martin,G.S. and Berger,J.M. (2000) Structure and function of Cdc6/Cdc18: implications for origin recognition and checkpoint control. Mol. Cell, 6, 637–648. [DOI] [PubMed] [Google Scholar]
- 15.Sutton M.D. and Kaguni,J.M. (1997) The Escherichia coli dnaA gene: four functional domains. J. Mol. Biol., 12, 546–561. [DOI] [PubMed] [Google Scholar]
- 16.Messer W., Blaesing,F., Majka,J., Nardmann,J., Schaper,S., Schmidt,A., Seitx,H., Speck,C., Tungler,D., Wegrzyn,G., Weigel,C., Welzeck,M. and Zakrzewska-Czerwinska,J. (1999) Functional domains of DnaA proteins. Biochimie, 81, 819–825. [DOI] [PubMed] [Google Scholar]
- 17.Erzberger J.P., Pirruccello,M.M. and Berger,J.M. (2002) The structure of bacterial DnaA: implications for general mechanisms underlying DNA replication initiation. EMBO J., 21, 4763–4773. [DOI] [PMC free article] [PubMed] [Google Scholar]
- 18.Samitt C.E., Hansen,F.G., Miller,J.F. and Schaechter,M. (1989) In vivo studies of DnaA binding to the origin of replication of Escherichia coli. EMBO J., 8, 989–993. [DOI] [PMC free article] [PubMed] [Google Scholar]
- 19.Cassler M.R., Grimwade,J.E. and Leonard,A.C. (1995) Cell cycle-specific changes in nucleoprotein complexes at a chromosomal replication origin. EMBO J., 14, 5833–5841. [DOI] [PMC free article] [PubMed] [Google Scholar]
- 20.Schaper S. and Messer,W. (1995) Interaction of the initiator protein DnaA of Escherichia coli with its DNA target. J. Biol. Chem., 270, 17622–17626. [DOI] [PubMed] [Google Scholar]
- 21.Funnell B.E., Baker,T.A. and Kornberg,A. (1987) In vitro assembly of a prepriming complex at the origin of the Escherichia coli chromosome. J. Biol. Chem., 262, 10327–10334. [PubMed] [Google Scholar]
- 22.Kigawa T., Yamaguchi-Nunokawa,E., Kodama,K., Matsuda,T., Yabuki,T., Matsuda,N., Ishitani,R., Nureki,O. and Yokoyama,S. (2002) Selenomethionine incorporation into a protein by cell-free synthesis. J. Struct. Funct. Genome, 2, 29–35. [DOI] [PubMed] [Google Scholar]
- 23.Hendrickson W.A. (1991) Determination of macromolecular structures from anomalous diffraction of synchrotron radiation. Science, 254, 51–58. [DOI] [PubMed] [Google Scholar]
- 24.Otwinowski Z. and Minor,W. (1997) Processing of X-ray diffraction data collected in oscillation mode. Methods Enzymol., 276, 307–326. [DOI] [PubMed] [Google Scholar]
- 25.Weeks C.M. and Miller,R. (1999) The design and implementation of SnB v2.0. J. Appl. Crystallogr., 32, 120–124. [Google Scholar]
- 26.La Fortelle E. and Bricogne,G. (1997) Maximum-likelihood heavy-atom parameter refinement for multiple isomorphous replacement and multiwavelength anomalous diffraction methods. Methods Enzymol., 276, 472–494. [DOI] [PubMed] [Google Scholar]
- 27.Collaborative Computational Project Number 4 (1994) The CCP4 suite: programs for protein crystallography. Acta Crystallogr. D, 50, 760–763. [DOI] [PubMed] [Google Scholar]
- 28.Jones T.A., Zou,J.-Y., Cowan,S.W. and Kjeldgaard,M. (1991) Improved methods for building protein models in electron density maps and the location of errors in these models. Acta Crystallogr. A, 47, 110–119. [DOI] [PubMed] [Google Scholar]
- 29.Brünger A.T., Adams,P.D., Clore,G.M., DeLano,W.L., Gros,P., Grosse-Kunstleve,R.W., Jiang,J.S., Kuszewski,J., Nilges,M., Pannu,N.S. et al. (1998) Crystallography & NMR system: a new software suite for macro molecular structure determination. Acta Crystallogr. D, 54, 905–921. [DOI] [PubMed] [Google Scholar]
- 30.Carson M. (1991) Ribbons 2.0. J. Appl. Crystallogr., 24, 958–961. [Google Scholar]
- 31.Obita T., Iwura,T., Su’etsugu,M., Yoshida,Y., Tanaka,Y., Katayama,T., Ueda,T. and Imoto,T. (2002) Determination of the secondary structure in solution of the Escherichia coli DnaA DNA-binding domain. Biochem. Biophys. Res. Commun., 299, 42–48. [DOI] [PubMed] [Google Scholar]
- 32.Neuwald A.F., Aravid,L., Spouge,J.L. and Koonin,E.V. (1999) AAA+: a class of chaperone-like ATPases associated with the assembly, operation and disassembly of protein complexes. Genome Res., 9, 27–43. [PubMed] [Google Scholar]
- 33.Otwinowski Z., Schevitz,R.W., Zhang,R.G., Lawson,C.L., Joachimiak,A., Marmorstein,R.Q., Luisi,B.F. and Sigler,P.B. (1988) Crystal structure of trp repressor/operator complex at atomic resolution. Nature, 335, 321–329. [DOI] [PubMed] [Google Scholar]
- 34.Campbell E.A., Muzzin,O., Chlenov,M., Sun,J.L., Olson,C.A., Weinman,O., Trester-Zedlitz,M.L. and Darst,S.A. (2002) Structure of the bacterial RNA polymerase promoter specificity sigma subunit. Mol. Cell, 9, 527–539. [DOI] [PubMed] [Google Scholar]
- 35.Tanaka Y., Nureki,O., Kurumizaka,H., Fukai,S., Kawaguchi,S., Ikuta,M., Iwahara,J., Okazaki,T. and Yokoyama,S. (2001) Crystal structure of the CENP-B protein-DNA complex: the DNA-binding domains of CENP-B induce kinks in the CENP-B box DNA. EMBO J., 20, 6612–6618. [DOI] [PMC free article] [PubMed] [Google Scholar]
- 36.Speck C., Weigel,C. and Messer,W. (1997) From footprint to toeprint: a close-up of the DnaA box, the binding site for the bacterial initiator protein DnaA. Nucleic Acids Res., 25, 3242–3247. [DOI] [PMC free article] [PubMed] [Google Scholar]
- 37.Sutton M.D. and Kaguni,J.M. (1997) Threonine 435 of Escherichia coli DnaA protein confers sequence-specific DNA binding activity. J. Biol. Chem. 272, 23017–23024. [DOI] [PubMed] [Google Scholar]
- 38.Blaesing F., Weigel,C., Welzeck,M. and Messer,W. (2000) Analysis of the DNA binding domain of Escherichia coli DnaA protein. Mol. Microbiol., 36, 557–569. [DOI] [PubMed] [Google Scholar]
- 39.Weigel C., Schmidt,A., Ruckert,B., Lurz,R. and Messer,W. (1997) DnaA protein binding to individual DnaA boxes in the Escherichia coli replication origin, oriC. EMBO J., 16, 6574–6583. [DOI] [PMC free article] [PubMed] [Google Scholar]
- 40.Majka J., Zakrzewska-Czerwinska,J. and Messer,W. (2001) Sequence recognition, cooperative interaction and dimerization of the initiator protein DnaA of Streptomyces. J. Biol. Chem., 276, 6243–6252. [DOI] [PubMed] [Google Scholar]
- 41.Kitagawa R., Mitsuki,H., Okazaki,T. and Ogawa,T. (1996) A novel DnaA protein-binding site at 94.7 min on the Escherichia coli chromosome. Mol. Microbiol., 19, 1137–1147. [DOI] [PubMed] [Google Scholar]
- 42.Kitagawa R., Ozaki,T., Moriya,S. and Ogawa,T. (1998) Negative control of replication initiation by a novel chromosomal locus exhibiting exceptional affinity for Escherichia coli DnaA protein. Genes Dev., 12, 3032–3043. [DOI] [PMC free article] [PubMed] [Google Scholar]
- 43.Lavery R. and Skelenar,H. (1988) Definition of generalized helicoidal parameters and an axis of curvature for irregular nucleic acids. J. Biomol. Struct. Dyn., 6, 63–91. [DOI] [PubMed] [Google Scholar]


