Abstract
Mutations in the androgen receptor (AR) are associated with a variety of diseases including androgen insensitivity syndrome and prostate cancer, but the way in which these mutations cause disease is poorly understood. We present a method for distinguishing likely disease-causing mutations from mutations that are merely associated with disease but have no causal role. Our method uses a measure of nucleotide conservation, and we find that conservation often correlates with severity of the clinical phenotype. Further, by only including mutations whose pathogenicity has been proven experimentally, this correlation is enhanced in the case of prostate cancer-associated mutations. Our method provides a means for assessing the significance of single nucleotide polymorphisms (SNPs) and cancer-associated mutations.
INTRODUCTION
The androgen receptor (AR) is a member of the superfamily of nuclear receptors that function as ligand-dependent transcription factors. The AR gene (AR) is ∼90 kb with eight exons, and lies on the X-chromosome at Xq11–12. Like other nuclear receptors, AR contains four domains, the N-terminal domain (NTD), the DNA-binding domain (DBD), the hinge region and the ligand- or androgen-binding domain (LBD). The DBD and the LBD show considerable homology to other nuclear receptors. The DBD contains two zinc fingers and is required for androgen response element recognition. The 253 residue C-terminal LBD contains 12 α-helices and the highly hydrophobic ligand-binding site.
Mutations in the AR are associated with a variety of diseases. Androgen insensitivity syndrome (AIS) is associated with germline mutations within the AR. AIS is classed into three clinical phenotypes, complete (CAIS), partial (PAIS) and mild (MAIS) insensitivity (1). CAIS patients exhibit a male genotype with female external genitalia. PAIS patients exhibit a wide range of phenotypes, often with ambiguous external genitalia. MAIS patients are sterile and have male external genitalia. Mutations for each of these phenotypes are spread throughout the AR, with most mutations occurring in the LBD in the C-terminal end of the receptor (2).
Unlike AIS, prostate cancer is associated with somatic mutations in the AR (CaP mutations). In a number of prostate cancers, somatic mutations are related specifically to the conversion of prostate androgen-dependent tissue to an androgen-independent state. In two of these cases, specific somatic mutations, T877A and L701H, have been shown to make the AR more promiscuous for steroid ligands, binding estrogen, cortisone and other steroid hormones, as well as androgen (3). T877A has been characterized structurally, and the mutant residue has been shown to contact the ligand and alter the structure of the ligand-binding pocket (4), supporting the hypothesis that these mutations alter ligand specificity. The molecular function of the many other prostate cancer-associated mutations in the AR remains unclear.
Mutations in the AR of diseased patients are used commonly as markers for AR-associated diseases. A subset of these mutations probably participates directly in the cause of the associated disease, but it is not easy to distinguish this subset. To determine which of these mutations are likely to be participating in conferring a disease phenotype, some of the disease-associated mutations in the AR have been characterized experimentally. Experimentally characterized mutations that alter the function of the AR are considered to have their pathogenicity proven. Polymorphisms and single nucleotide polymorphisms (SNPs), in particular, may be indicators of disease susceptibility or factors in polygenic disease (5); however, it is not usually possible to characterize experimentally all gene alterations including SNPs. Thus, computational methods that help rank SNPs for likely functional importance would be useful.
There are a variety of known methods for understanding how mutations within a locus cause disease (6–8). Wacey et al. estimated the sequence and structural implications of disease-associated mutations in the p53 gene (8). Their results showed that substitution rates of disease-associated mutations correlate with changes in biophysical properties. They used their results to estimate the clinical observation likelihood (RCOL) of disease-associated mutations in the p53 gene. We have built structural models of osteogenesis imperfecta-associated mutations in the collagen COL1A1 gene (9). Our studies have shown that disease-associated mutations perturb the structure of the triple helix of COL1A1 and that some mutations compensate for lost stability by binding to solvent molecules. Ng and Henikoff have introduced SIFT, a method for predicting functional non-synonymous SNPs using homologous protein sequences (10,11).
In this study, we report on a phylogenetic method for characterizing the functional consequences of disease-associated mutations in the AR to elucidate the significance of these gene alterations. We collected sequences from proteins that are closely related to the human AR gene, aligned them, and compared conservation with individual positions with a list of positions that are in the AR. Conservation is quantified using a modified form of the entropy metric developed by Shenkin et al. (12).
MATERIALS AND METHODS
The disease-associated mutations in the AR were identified from the AR gene mutation database (2). All CAIS, PAIS, MAIS and CaP missense substitution mutations were collected from the database, except those that resulted in a stop codon. The distribution of mutations within the NTD (codons 1–556), the DBD (codons 556–623) and the LBD (codons 666–918) was determined.
To determine the level of conservation on specific nucleotide positions within the AR sequence, we employed a method using evolutionary conservation with disease- associated mutations (13). The SIFT method (10), developed by Ng and Henikoff, performs an analysis of non-synonymous mutations using homologous protein sequences. The method described here can be applied to both protein and nucleic acid sequences.
This method collects sequences similar to a gene of interest. The number of sequences, in this case, is simply the number of significant sequences (e-value of 10–15 or less) returned by a BLAST (14) search against SWISS-PROT; and then a series of sequence alignments is built from them. Sequences returned are a mixture of both paralogs and orthologs. Conservation is then quantified at each position, using all sequences at each position in the alignment.
To quantify the degree of conservation at a position in the multiple alignment, we chose to use the negative entropy of each position, using the method developed by Shenkin et al. (12). The negative entropy was chosen because it can easily quantify the degree of conservation in a column within a multiple alignment and has been used before (15). To calculate the negative entropy for each position in the AR sequences, we used the following formula for the Shannon informational entropy:
where P is the probability of finding a specific amino acid in the alignment column and the entropy is the sum of each amino acid’s P log P term. Perfectly conserved positions have negative entropy values of zero, and less conserved positions are greater, with a maximal value depending on the number of terms in the sum.
After performing a BLAST search, the sequences were prepared as follows. First, the sequences were collected and placed into a single file in Protein Information Resource (PIR) format (16). The file containing the ranked sequences was then loaded into ClustalW (17) in order to create a multiple alignment.
Following the determination of conservation across the alignment, the negative entropy of each reported mutation in the AR mutation database was grouped by clinical phenotype, domain location, and whether its pathogenicity was proven. Finally, the most and least conserved positions associated with each phenotype were identified. The most conserved 10 positions from each phenotype were selected and sorted by position in the chain. In the event of equal negative entropy values, all positions were listed.
RESULTS
The distribution of mutations within the AR are reported in Table 1. The majority of the mutations in the AR are in the LBD.
Table 1. Distribution of mutations in the AR gene mutations database (2).
| CAIS | PAIS | MAIS | CaP | |
|---|---|---|---|---|
| Mutations in complete gene | 83 | 65 | 16 | 50 |
| DBD | 12 | 13 | 1 | 5 |
| LBD | 67 | 50 | 9 | 32 |
| Pathogenicity-proven mutations | 42 | 32 | 9 | 14 |
The DBD consists of residues 534–625, and the LBD consists of residues 664–919.
The human AR sequence was collected from the SWISS-PROT database, and used to search SWISS-PROT using BLAST. The search returned a total of 183 sequence hits with a score of 10e–15 or better. The sequences of the top scoring sequence hits were retrieved, then aligned with ClustalW. The alignment contained sequences including the human AR (ANDR_HUMAN) and included the retinoic acid, estrogen, glucocorticoid, mineralocorticoid, progesterone and non-human AR families.
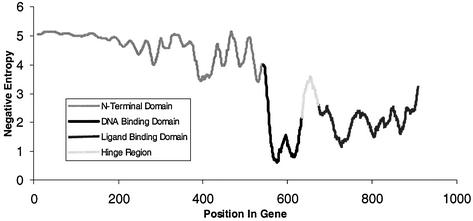
Negative entropy can be used to quantify conservation in a multiple alignment, where a score of zero is perfectly conserved and larger numbers reflect lesser levels of conservation. The average conservation for each position across the entire AR is shown in Figure 1. The average negative entropy for each position in the entire gene sequence is 3.59 ± 1.53. The DBD is highly conserved, with an average negative entropy of 1.69 ± 1.50. The LBD is less conserved, with an average negative entropy of 2.15 ± 0.90.
Figure 1.
Conservation across the AR gene. Plot illustrating the conservation of the AR using the domain alignment. The different lines illustrate the approximate locations of the three major domains across the AR. Domains are defined as: the N-terminal domain (NTD, codons 1–556), the DNA binding domain (DBD, 557–623), and the ligand binding domain (LBD, 666–918). The NTD is dashed, the DBD is dotted, and the LBD is solid.
Table 2 shows the average conservation of the mutations in the database. CAIS and PAIS mutation positions are overall more conserved than baseline. MAIS mutation positions are conserved similarly to the baseline. Prostate cancer mutation positions are conserved more overall than baseline.
Table 2. Average conservation of phenotypically annotated mutations in the AR.
| CAIS | PAIS | MAIS | CaP | Gene average | |
|---|---|---|---|---|---|
| Complete gene mutations | 1.81 ± 1.03 | 1.94 ± 1.21 | 3.21 ± 1.34 | 2.58 ± 1.46 | 3.59 ± 1.53 |
| DBD | 0.44 ± 0.59 | 1.22 ± 1.28 | 4.93a | 0.66 ± 0.48 | 1.69 ± 1.49 |
| LBD | 1.95 ± 0.83 | 2.02 ± 1.01 | 2.14 ± 0.55 | 2.20 ± 0.81 | 2.15 ± 0.423 |
| Pathogenicity-proven | 1.88 ± 1.09 | 1.95 ± 1.05 | 3.35 ± 1.21 | 1.91 ± 0.94 | N/A |
All values are followed by the standard deviation. All positions were used. Positions with multiple phenotypes associated with them were reported separately for each phenotype. The DBD is residues 534–625, and the LBD is residues 664–919. ‘Gene average’ the average of all positions within the gene product.
aOnly one value.
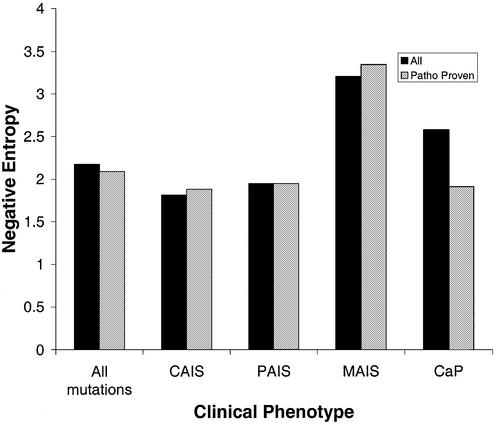
Mutations where the pathogenicity is considered ‘proven’ helped clarify the degree of mutation conservation, particularly with the CaP mutations. CAIS and PAIS mutations are highly conserved, while MAIS mutations are generally less conserved. Interestingly, the largest difference in conservation, when only the subset of mutations with proven pathogenicity is included in the data, is in prostate cancer-associated mutations. With these mutations, the average conservation increases by 35% (Fig. 2).
Figure 2.
Conservation of pathogenicity-proven mutations compared with conservation of ‘all mutations’. ‘All mutations’ are all mutation positions identified in the coding regions of the AR. Pathogenicity-proven mutations are only those mutations that have been shown experimentally to have a functional effect, as annotated in the AR mutation database (2). The average conservation of a mutation is directly related to the negative entropy value. The average negative entropy for the entire gene is 3.59 ± 1.53.
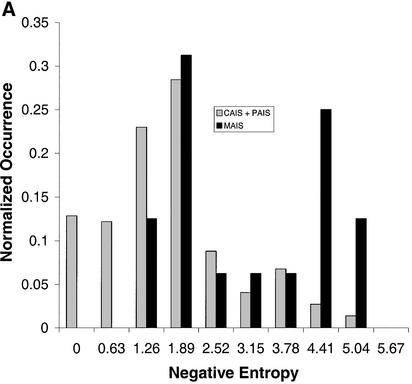
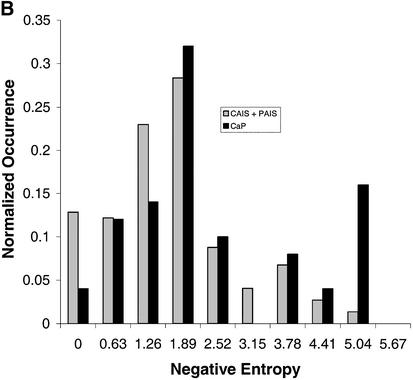
The most conserved and least conserved positions are listed in Table 3. Many CAIS, PAIS and CaP positions are highly conserved, while few MAIS positions are. The histogram distribution comparing MAIS (A) and CaP (B) with the CAIS and PAIS mutations is shown in Figure 3.
Table 3. Most and least conserved disease-associated positions within the AR gene.
| CAIS | PAIS | MAIS | CaP | ||||
|---|---|---|---|---|---|---|---|
| Most conserved | |||||||
| 611 | 0.0 | 608 | 0.034 | 724 | 1.357 | 619 | 0.0 |
| 601 | 0.034 | 615 | 0.034 | 814 | 1.680 | 580 | 0.291 |
| 615 | 0.034 | 582 | 0.068 | 790 | 1.930 | 720 | 0.759 |
| 559 | 0.068 | 725 | 0.196 | 788 | 2.040 | 586 | 1.002 |
| 576 | 0.068 | 838 | 0.230 | 793 | 2.079 | 575 | 1.005 |
| 579 | 0.068 | 733 | 0.280 | 795 | 2.154 | 587 | 1.017 |
| 585 | 0.068 | 728 | 0.348 | 824 | 2.255 | 743 | 1.064 |
| 571 | 0.174 | 568 | 0.392 | 871 | 2.426 | 741 | 1.197 |
| 732 | 0.220 | 737 | 0.617 | 886 | 3.337 | 629 | 1.218 |
| 723 | 0.537 | 578 | 0.675 | 390 | 3.727 | 866 | 1.268 |
| Least conserved | |||||||
| 255 | 4.324 | 2 | 5.186 | 548 | 4.935 | 54 | 5.160 |
| 853 | 4.255 | 547 | 4.803 | 230 | 4.910 | 57 | 5.137 |
| 907 | 4.121 | 645 | 4.452 | 511 | 4.746 | 340 | 5.111 |
| 916 | 3.942 | 664 | 4.355 | 214 | 4.638 | 194 | 5.099 |
| 917 | 3.924 | 703 | 3.915 | 210 | 4.576 | 64 | 5.035 |
| 889 | 3.767 | 909 | 3.834 | 211 | 4.549 | 269 | 5.033 |
| 390 | 3.727 | 889 | 3.767 | 390 | 3.727 | 112 | 4.957 |
| 657 | 3.180 | 911 | 3.715 | 886 | 3.337 | 266 | 4.957 |
| 779 | 3.142 | 854 | 3.650 | 871 | 2.426 | 180 | 4.726 |
| 855 | 3.080 | 913 | 3.525 | 824 | 2.255 | 647 | 4.403 |
Figure 3.
Histogram of mutation data by phenotype. (A) Histogram of all CAIS and PAIS reported mutations compared with MAIS mutations. Plots normalized to 1.0. (B) Histogram of all CAIS and PAIS reported mutations compared with CaP mutations. Plots normalized to 1.0.
DISCUSSION
This work supports the use of disease-associated mutations for understanding functional characteristics of protein products of genes. SNPs can be used as disease markers, but they can also yield useful functional information when analyzed using techniques such as ours.
The degree of conservation of disease-associated nucleotide positions seems to correlate with the severity of the phenotype. The finding that CAIS mutations and PAIS mutations are more conserved than MAIS mutations (Table 2) illustrates that, in some cases, functionally important phenotypic characteristics can be ranked by relative degrees of conservation. In particular, because the degree of conservation in MAIS is up to three times lower, base changes in these nucleotides may have evolutionary significance, as changes in these nucleotides result in a much milder phenotype.
The median degree of conservation of the CaP positions can be due to somatic mutations within those ARs which display a gain of function, as opposed to a loss of function. In a number of cases, the receptors become promiscuous and respond to a number of different ligands (3). Thus, mutation positions within those CaP ARs may be less conserved than mutation positions that confer a loss of function. The difference in conservation of MAIS mutations when compared with more severe mutations suggests that mutations ranked by our method may have measurable clinical differences.
The use of pathogenicity-‘proven’ experimental mutation data also shows a strong correlation. Perhaps most interestingly, when experimentally proven prostate cancer mutations are compared with all of the prostate cancer mutations in AR, we observe a significant enrichment in conservation, which is not observed in CAIS, PAIS or MAIS (Fig. 2). Because the significance of many reported somatic mutations is unclear, it may be possible to distinguish the subset of cancer-associated mutations that play a more significant role in cancer ontology. Furthermore, it is interesting to note that there is much uncertainty associated with reported prostate cancer- associated mutations in the AR (18,19).
Our results suggest that knowledge of conservation can be used as a filter or ranking mechanism for SNP data, to identify the most functionally important gene sequence positions. Databases of phenotypically annotated polymorphisms contain large amounts of uncertain data, primarily because polymorphisms are assumed to be benign and have no phenotypic expression. Use of conservation across the positions in the gene as a filter can suggest which positions are most likely to be disease associated. Although it is not clear if this finding will generalize to other diseases, it is intriguing to consider the possibility that mutations in the most conserved regions will cause more severe phenotypes than others.
In conclusion, we have applied a simple method based on evolutionary relationships for ranking disease-associated mutations and polymorphisms based on likely functional significance. We have applied this method to the AR and have found that disease-associated mutations correlate strongly with the degree of conservation. When phenotypes are compared, we find that the degree of conservation correlates with severity of disease for the AR. These correlations are strongest when only mutations whose pathogenicity is proven experimentally are included. Interestingly, pathogenicity-proven somatic prostate cancer mutations are more conserved than all reported cancer mutations. This result suggests that mutations annotated with a phenotype as it relates to prostate cancer is highly uncertain and that our method can be used to filter large amounts of SNP data to rank SNPs by functional importance.
Acknowledgments
ACKNOWLEDGEMENTS
S.D.M. is funded by an American Cancer Society Postdoctoral Fellowship and NIH AR42770-01 (T.E.K., PI). We would like to gratefully acknowledge financial support from grants NIH LM06244, GM61374 and NSF DBI-960063 (R.B.A., PI), and the Center for Translational Research in Cancer, McGill University (B.G.).
REFERENCES
- 1.Gottlieb B., Pinsky,L., Beitel,L. and Trifiro,M. (1999) Androgen insensitivity. Am. J. Med. Genet., 89, 210–217. [DOI] [PubMed] [Google Scholar]
- 2.Gottlieb B., Lehvaslaiho,H., Beitel,L., Lumbroso,R., Pinsky,L. and Trifiro,M. (1998) The androgen receptor gene mutations database. Nucleic Acids Res., 26, 234–238. [DOI] [PMC free article] [PubMed] [Google Scholar]
- 3.Zhao X., Malloy,P., Krishnan,A., Swami,S., Navone,N., Peehl,D. and Feldman,D. (2000) Glucocorticoids can promote androgen-independent growth of prostate cancer cells through a mutated androgen receptor. Nature Med., 6, 703–706. [DOI] [PubMed] [Google Scholar]
- 4.Sack J., Kish,K., Wang,C., Attar,R., Kiefer,S., An,Y., Wu,G., Scheffler,J., Salvati,M., Krystek,S. et al. (2001) Crystallographic structures of the ligand-binding domains of the androgen receptor and its T877A mutant complexed with the natural agonist dihydrotestosterone. Proc. Natl Acad. Sci. USA, 98, 4904–4909. [DOI] [PMC free article] [PubMed] [Google Scholar]
- 5.Collins F., Brooks,L. and Chakravarti,A. (1992) A DNA polymorphism discovery resource for research on human genetic variation. Genome Res., 8, 1229–1231. [DOI] [PubMed] [Google Scholar]
- 6.Chasman D. and Adams,R. (2001) Predicting the functional consequences of non-synonymous single nucleotide polymorphisms: structure-based assessment of amino acid variation. J. Mol. Biol., 307, 683–706. [DOI] [PubMed] [Google Scholar]
- 7.Sunyaev S., Ramensky,V., Koch,I., Lathe,W.,3rd, Kondrashov,A. and Bork,P. (2001) Prediction of deleterious human alleles. Hum. Mol. Genet., 10, 591–597. [DOI] [PubMed] [Google Scholar]
- 8.Wacey A., Cooper,D., Liney,D., Hovig,E. and Krawczak,M. (1999) Disentangling the perturbational effects of amino acid substitutions in the DNA-binding domain of p53. Hum. Genet., 104, 15–22. [DOI] [PubMed] [Google Scholar]
- 9.Mooney S. and Klein,T. (2002) Structural models of osteogenesis imperfecta associated mutations in the COL1A1 gene. Mol. Cell. Proteomics, 1, 868–875. [DOI] [PubMed] [Google Scholar]
- 10.Ng P. and Henikoff,S. (2001) Prediting deleterious amino acid substitutions. Genome Res., 11, 863–874. [DOI] [PMC free article] [PubMed] [Google Scholar]
- 11.Ng P. and Henikoff,S. (2002) Accounting for human polymorphisms predicted to affect protein function. Genome Res., 12, 436–446. [DOI] [PMC free article] [PubMed] [Google Scholar]
- 12.Shenkin P., Erman,B. and Mastrandrea,L. (1991) Information-theoretical entropy as a measure of sequence variability. Proteins, 11, 297–313. [DOI] [PubMed] [Google Scholar]
- 13.Mooney S. and Klein,T. (2002) The functional importance of disease-associated mutation. BMC Bioinformatics, 3, 24. [DOI] [PMC free article] [PubMed] [Google Scholar]
- 14.Altschul S., Madden,T., Schaffer,A., Zhang,J., Zhang,Z., Miller,W. and Lipman,D. (1997) Gapped BLAST and PSI-BLAST: a new generation of protein database search programs. Nucleic Acids Res., 25, 3389–3402. [DOI] [PMC free article] [PubMed] [Google Scholar]
- 15.Larson S. and Davidson,A. (2000) The identification of conserved interactions within the SH3 domain by alignment of sequences and structures. Protein Sci., 9, 2170–2180. [DOI] [PMC free article] [PubMed] [Google Scholar]
- 16.Wu C., Huang,H., Arminski,L., Castro-Alvear,J., Chen,Y., Hu,Z., Ledley,R., Lewis,K., Mewes,H., Orcutt,B. et al. (2002) The protein information resource: an integrated public resource of functional annotation of proteins. Nucleic Acids Res., 30, 35–37. [DOI] [PMC free article] [PubMed] [Google Scholar]
- 17.Thompson J., Higgins,D. and Gibson,T. (1994) CLUSTAL W: improving the sensitivity of progressive multiple sequence alignment through sequence weighting, position-specific penalties and weight matrix choice. Nucleic Acids Res., 22, 4673–4680. [DOI] [PMC free article] [PubMed] [Google Scholar]
- 18.Feldman B. and Feldman,D. (2001) The development of androgen-independent prostate cancer. Nature Rev. Cancer, 1, 34–45. [DOI] [PubMed] [Google Scholar]
- 19.Montgomery J., Price,D. and Figg,W. (2001) The androgen receptor gene and its influence on the development and progression of prostate cancer. J. Pathol., 195, 138–146. [DOI] [PubMed] [Google Scholar]


