


Abstract
The minor groove binding asymmetric cyanine dye 4-[(3-methyl-6-(benzothiazol-2-yl)-2,3-dihydro- (benzo-1,3-thiazole)-2-methylidene)]-1-methyl-pyridin ium iodide (BEBO) is tested as sequence non- specific label in real-time PCR. The fluorescence intensity of BEBO increases upon binding to double-stranded DNA allowing emission to be measured at the end of the elongation phase in the PCR cycle. BEBO concentrations between 0.1 and 0.4 µM generated sufficient fluorescence signal without inhibiting the PCR. A comparison with the commonly used reporter dye SYBR Green I shows that the two dyes behave similarly in all important aspects.
INTRODUCTION
4-[(3-Methyl-6-(benzothiazol-2-yl)-2,3-dihydro-(benzo-1,3- thiazole)-2-methylidene)]-1-methyl-pyridinium iodide (BEBO) is a new asymmetric monovalent cyanine dye that binds in the minor groove of double-stranded (ds)DNA (Fig. 1). BEBO has a crescent shape that fits the path of the DNA minor groove. This design makes BEBO prefer minor groove binding to intercalation (1). The fluorescence increase of BEBO upon binding to DNA is about 200-fold, which is the largest increase reported for a minor groove binding compound. The cyanine chromophore of BEBO is the same as in the intercalating asymmetric cyanine dye 1-methyl-4-[(3-methyl-2(3H)-benzothiazolylidene)methyl]-pyridinium iodide (BO). However, substitution at the 6-position by a benzothiazole group gives it a bent shape similar to that of well-known minor groove binding dyes such as 4’,6-diamidino-2-phenylindole (DAPI) (2). Ligands that bind in the minor groove are usually highly selective for dsDNA, which should be an advantage when probing product formation in real-time PCR.
Figure 1.

Chemical structure of BEBO.
Real-time PCR is the most versatile technique for detection and quantification of nucleic acids. The exponential nature of the reaction allows concentrations ranging from 109 to single copies of template molecules to be analyzed accurately with high reproducibility. A fluorescent reporter molecule is used in the reaction mixture to detect the exponentially amplified product as the reaction progresses. Common reporters, such as oxazole yellow (YO) and thiazole orange (TO), are intercalating asymmetric cyanine dyes that exhibit a large increase in fluorescence intensity upon binding to DNA (3). These dyes, however, do not behave very well as reporter dyes in real-time PCR (unpublished results). In this work we investigate the utility of the minor groove binder BEBO in real-time PCR, and compare it with the commonly used dye SYBR Green I.
MATERIALS AND METHODS
BEBO was synthesized as described (1) and dissolved in DMSO at a concentration of 5.8 mM. Fluorescence spectra were recorded using a SPEX fluorolog τ2 spectrofluorimeter at 25°C in 25 mM sodium phosphate buffer (pH 7.0). Maximum molar absorptivity of free BEBO is 41 000 M–1cm–1 at 468 nm and of BEBO bound to dsDNA it is 39 000 M–1cm–1 at 492 nm. Calf thymus DNA (Fluka) and yeast RNA type III (Sigma) were used in spectroscopic studies. A 239 bp segment from exon 3 of the human PMP22 gene and a 222 bp segment of the tubulin β 5 gene from mouse were used as PCR templates. Primers were 5′-CCATGGCCAGCTCTCCTAAC and 5′-CATTCCGCAGACTTGGATGC, and 5′-CCTTCATTGGAAACAGCACA and 5′-CCTCCTCTCCGAAATCCTCT for PMP22 and β-tubulin, respectively. Template GC content was 51% for PMP22 and 56% for β-tubulin. Starting material was purified PCR product. The PCR mixture contained 3 mM Mg2+ (Sigma), 200 µM dNTP (Sigma), 0.4 µM primers (MWG Biotech), 0.2 mg/ml BSA (MBI Fermentas) and 1 U Taq polymerase (Sigma). Stock solutions of 100 µM BEBO and 200× SYBR Green I (BMI) were prepared in DMSO. Immediately before use the stock solutions were diluted 10-fold with milliQ water. The BEBO stock solution showed no signs of degradation after >10 months of storage in a refrigerator. Real-time PCR was run in a Rotorgene from Corbett Research measuring at channel 1 (excitation at 470 nm, detection at 510 nm). Samples were run in transparent 200 µl test tubes from ABgene. Products were analyzed by agarose (Gibco BRL) gel electrophoresis (1% w/v and run at 80 V for 40–50 min), stained with 0.5 µg/ml ethidium bromide (Bio-Rad) for 40 min and visualized in a Gel Doc 2000 (Bio-Rad). PCR efficiency (E), defined as Pn = P0(1 + E)n, was estimated from template dilution series assuming E = 10–1/a – 1, where a is the slope of the corresponding standard curve.
RESULTS
Figure 2 shows fluorescence spectra of BEBO free in buffer and bound to dsDNA. The fluorescence of free BEBO is negligible compared to that of the bound dye. Some increase in BEBO fluorescence was also observed in the presence of RNA, but to a much lower extent (results not shown). Absorption and emission spectra of the bound dye are shown in Figure 3. The absorption maximum is at 468 nm and the emission maximum is at 492 nm. Although these values are in the wavelength range used in real-time PCR, there is as yet no commercial instrument with optimum filter settings for BEBO. In our study we used the RotorGene from Corbett Research, which excites at 470 nm and measures emission at 510 nm.
Figure 2.

Emission spectra of BEBO free in buffer and bound to calf thymus DNA at a dye:base pair ratio of 1:50 in 25 mM sodium phosphate buffer (pH 7.0 at 25°C). Excitation wavelength is 467 nm.
Figure 3.

Normalized absorption and emission spectra of BEBO bound to dsDNA.
Figure 4 shows unprocessed real-time PCR amplification curves of the 239 bp fragment from PMP22 using BEBO detection. BEBO concentration was varied from 0.05 to 2 µM and each positive sample was run in triplicate along with a no template control (NTC). The background fluorescence signal observed at low cycle numbers increased with increasing BEBO concentration and became too high above 0.8 µM at this gain setting (gain = 8). At BEBO concentrations below 0.2 µM the fluorescence signal remained at a constant level until it increased exponentially due to product accumulation. This is the desired behavior. However, with 2 µM BEBO and also to some extent with 0.8 µM BEBO the background fluorescence signal increased with increasing cycle number before sufficient amount of product has accumulated to generate an increase due to dye binding. This suggests that free BEBO causes a non-specific increase in fluorescence with time; perhaps due to a slow aggregation process. The plateau fluorescence signal for the NTC samples was lower than that of the corresponding positive samples indicating that the signal from BEBO bound to non-specific primer dimer products is lower than the signal of BEBO bound to double stranded products in positive samples.
Figure 4.

PCR amplification of the 239 bp PMP22 fragment using BEBO detection. Unprocessed (raw) data. BEBO concentrations are indicated in the graph (µM). Excitation at 470 nm and detection at 510 nm. Gain = 8. Samples run in triplicate plus NTC.
Figure 5 shows the amplified samples from Figure 4 analyzed by agarose gel electrophoresis. The specific product is 239 bp and is observed in samples amplified in the presence of 0.05, 0.2 and 0.8 µM BEBO. In samples amplified in the presence of 2 and 5 µM BEBO, specific product is not observed, indicating that BEBO at these high concentrations interferes with the PCR. All samples generated a small band corresponding to ∼50 bp due to primer dimer formation. These bands are more intense in the 2 and 5 µM BEBO samples.
Figure 5.
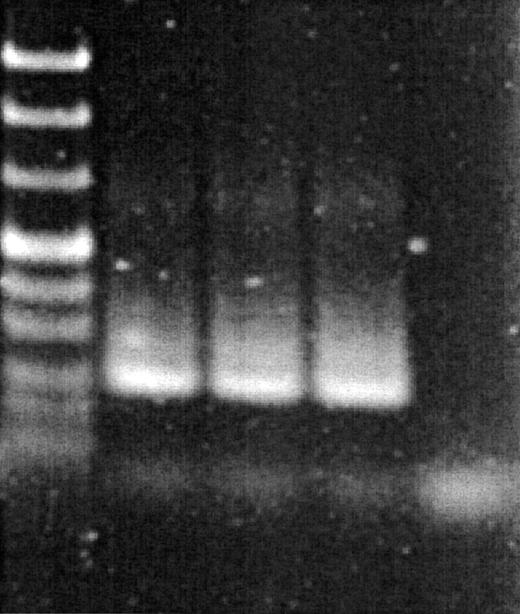
Agarose gel electrophoresis of the PCR products in Figure 4. From left, pUC Mix ladder (MBI), 0.2, 0.4, 0.8 and 2 µM BEBO. Major product in lane 2–4 is 239 bp.
Figure 6 shows amplification curves of a template dilution series using the 222 bp β-tubulin fragment analyzed using 0.2 µM BEBO. The amplification curves are evenly spaced indicating constant PCR efficiency in the studied concentration interval. From the standard curve the PCR efficiency is estimated to be 79%.
Figure 6.

Template dilution series of the 222 bp β-tubulin fragment. Background subtracted and normalized amplification curves (duplicate 1:1, 1:10, 1:100, 1:1000 dilutions and NTC). (Inset) Standard curve (R = 0.99955, slope –3.8, efficiency 0.83).
In Figure 7A BEBO (0.2 µM) and SYBR Green I (0.1×) are compared using a dilution series of the PMP22 PCR product. Amplification curves obtained with BEBO are parallel to those obtained with SYBR Green, although they appear about four cycles later. The standard curves shown in the inset are parallel for the two dyes indicating similar PCR efficiencies (about 70%).
Figure 7.


(A) BEBO (solid lines) and SYBR Green I (dashed lines) 100-fold PMP22 template dilution. Triplicates using 0.2 µM BEBO or 0.1× SYBR Green I. (Inset) Standard curve indicating reaction efficiencies of 68% for BEBO and 72% for SYBR Green I. (B) Inverted first derivative melting curve with BEBO (solid lines) and SYBR Green I (dashed lines) using the 239 bp PMP22 PCR product. Melt peak is 87.9°C for BEBO and 88.9°C for SYBR Green I.
Shown in Figure 7B are the negative first derivative melting curves of the 239 bp PCR product. Melt peak maximum is at 87.9°C for BEBO and at 88.9°C for SYBR Green.
DISCUSSION
We have studied the new minor groove binding asymmetric cyanine dye BEBO as a non-specific reporter in real-time PCR. The optimum BEBO concentration when using a Rotorgene instrument is 0.1–0.5 µM. Higher BEBO concentrations result in a high background signal that also slowly increases with time. The fluorescence enhancement observed when using BEBO concentrations <0.05 µM is insufficient for the instrumentation used.
BEBO at concentrations <∼0.4 µM does not interfere with the PCR, whereas concentrations >1 µM BEBO cause severe interference and loss of specificity.
BEBO at high concentrations aggregates in aqueous solution (1), which increases its fluorescence (data not shown). To promote solubility, we added BEBO to the PCR master mix dissolved in DMSO. At BEBO concentrations >0.8 µM the fluorescence background signal increases with increasing cycle number, suggesting that BEBO at these concentrations slowly aggregates (Fig. 4). In an attempt to suppress the aggregation we added 15% DMSO to the PCR. This has been reported to reduce secondary structure formation and improve PCR specificity without compromising efficiency (Roche Applied Science Website, http://biochem.roche.com/pcr/). This indeed eliminated the background signal, but in our hands inhibited the PCR.
We also tested BEBO in the Roche LightCycler, which uses glass capillaries as reaction containers. This required higher probe concentrations: 2 µM BEBO was needed to obtain a good signal and up to 5 µM could be used without losing specificity. This, we believe, is a consequence of BEBO adsorbing to the surface of the glass capillaries.
Presently the most popular dye for real-time PCR is SYBR Green I from Molecular Probes (4). Since no information about structure, binding mode and stock solution concentration of SYBR Green I is available, a direct comparison with BEBO is difficult. Present instruments, with 510 nm emission filters, are also optimized for SYBR Green I detection and not for BEBO, which has maximum emission at 492 nm. BEBO fluorescence enhancement upon binding to dsDNA is also lower at 510 nm than at shorter emission wavelengths (80 compared to 300 at 484 nm; Fig. 2). Still, the fluorescence enhancements observed with the two dyes are comparable on a logarithmic scale under the present conditions. However, it may explain why SYBR Green I amplification curves appear four cycles earlier than those with BEBO, although the PCR efficiencies are the same. Melting point analysis reveals that BEBO binds more weakly to dsDNA than does SYBR Green I, which may be an advantage in some situations. Finally, BEBO stock solutions are stable for at least 10 months.
Acknowledgments
ACKNOWLEDGEMENTS
This work was supported by the SWEGENE consortium and LightUp Technologies AB.
REFERENCES
- 1.Karlsson H.J., Lincoln,P. and Westman,G. (2003) Synthesis and DNA binding studies of a new asymmetric cyanine dye binding in the minor groove of [poly(dA-dT)]2. Bioorg. Med. Chem., 11, 1035–1040. [DOI] [PubMed] [Google Scholar]
- 2.Kubista M., Åkerman,B. and Nordén,B. (1998) Characterization of interaction between DNA and 4′,6-diamidino-2-phenylindole by optical spectroscopy. Biochemistry, 26, 4545–4553. [DOI] [PubMed] [Google Scholar]
- 3.Nygren J., Svanvik,N. and Kubista,M. (1998) The interaction between the fluorescent dye thiazole orange and DNA. Biopolymers, 46, 39–51. [DOI] [PubMed] [Google Scholar]
- 4.Wittwer C.T., Herrmann,M.G., Moss,A.A. and Rasmussen,R.P. (1997) Continuous fluorescence monitoring of rapid cycle DNA amplification. Biotechniques, 22, 130–131, 134–138. [DOI] [PubMed] [Google Scholar]