Abstract
During the first 45 days after intracerebral infection with Theiler's murine encephalomyelitis virus (TMEV), the levels of mRNAs encoding chemokines MCP-1/CCL2, RANTES/CCL5, and IP-10/CXCL10 in the central nervous system (CNS) are closely related to the sites of virus gene expression and tissue inflammation. In the present study, these chemokines were monitored during the latter 135 days of a 6-month course of TMEV-induced disease in susceptible (PLJ) or resistant (C57BL/6) mice that possessed or lacked either CD4+ or CD8+ T cells. These data were additionally correlated to mouse genotype, virus persistence in the CNS, antiviral antibody titers, mortality, and the severity of neurological disease. Surprisingly, the major determinant of chemokine expression was virus persistence: the factors of susceptible or resistant genotype, severity of neuropathology, and presence or absence of regulatory T cells exerted minimal effects. Our observations indicated that chemokine expression in the CNS in this chronic viral disorder was intrinsic to the CNS innate immune response to infection and was not governed by elements of the adaptive immune system.
Theiler's murine encephalomyelitis virus (TMEV) infection of the central nervous system (CNS) causes poliomyelitis that is rapidly cleared in susceptible and resistant mouse strains but is succeeded by viral persistence and inflammatory demyelination in susceptible strains of mice (7, 19, 21, 31, 33). By thorough analysis of congenic strains, the determinants of susceptibility have been mapped to both major histocompatibility complex (MHC) and non-MHC genes (19). This genetic analysis has been extended by studying TMEV disease in gene-targeted mice. Recent results revealed that both CD4 and CD8 cells were required to control infection (16). CD4+ cells additionally provided protection against neurological deficits that result from inflammatory demyelination (16, 28).
Chemokines constitute a family of peptides that act through specific high-affinity receptors (3). In concert with adhesion molecules, they define both physiological and pathological leukocyte migration patterns (5). Expression of chemokines has been defined for early time points after TMEV infection but not in chronic disease (15). Further, the regulation of TMEV-induced chemokine expression in CD4- and CD8-deficient mice has not been addressed. We used real-time reverse transcriptase PCR (RT-PCR) to evaluate CNS chemokine expression in susceptible and resistant mice, with or without deletion of CD4 or CD8 genes, across a 6-month time course of disease. These data were correlated with viral persistence, clinical deficits, mortality, and serum-neutralizing antiviral antibodies.
These analyses allowed us to determine how quantitative or qualitative CNS chemokine expression was determined by the presence or absence of CD4+ or CD8+ T cells by susceptible or resistant genotype or by persistent viral replication. We found that quantitative and qualitative aspects of CNS chemokine expression in TMEV-infected mice were not consistently related to the presence of either CD4+ or CD8+ T cells. Further, chemokine expression was not directly related to the severity of tissue injury in the CNS target organ. Rather, the dominant determinant of CNS chemokine expression was viral persistence.
MATERIALS AND METHODS
Virus.
The Daniel's strain of TMEV was used in all experiments (27). Mice were injected intracerebrally with 2 × 10⁵ PFU of TMEV DA in 10 μl of medium.
Mice.
Mice lacking CD4 and CD8 surface expression were generated at the Ontario Cancer Institute (8, 24). Embryonic stem cell lines were used to generate homologous recombinants. Generation of the CD4−/− genotype was created by the interruption of exon 5 of the L3T4 coding sequence with the neomycin resistance gene (24). The CD8−/− mice were generated in a similar manner by disruption of the first exon of the LYT-2 gene (8). Handling of all animals conformed to the National Institutes of Health and Mayo Clinic institutional guidelines.
Survival analysis in mice.
Mice were monitored weekly for signs of scruffiness or unkempt coat, paralysis in fore or hind limbs, reduced activity, or death.
Spinal cord pathology.
On days 45, 90, and 180, mice were anesthetized with pentobarbital and perfused by intracardiac puncture with 50 ml of Trump's fixative. Spinal cords were removed and sectioned into 1-mm coronal sections, and every third block was used for histologic analysis. Spinal cord sections were dehydrated through a graded alcohol series and embedded in glycol methacrylate; 2-μm sections were cut and stained with a modified erichrome stain with a cresyl violet counterstain as described previously (22). Morphological analysis of specimens was performed to determine the extent of demyelination. The total white matter and the total lesion area (in square millimeters) were calculated by using ZIDAS (for Zeiss interactive digital analysis system) and a camera lucida attached to a photomicroscope (Carl Zeiss, Inc., Thornwood, N.Y.). Areas of demyelination were characterized by the presence of cellular infiltration, naked axons, and macrophages engulfing cellular debris. The data were expressed as the percentage of total lesion area per total white matter area.
Viral plaque assays.
Viral titer in clarified CNS homogenates was determined by assays described previously (27). On days 45 and 90 after TMEV infection, CNS homogenates were prepared from brains and cords. A 10% (wt/vol) homogenate was prepared in Dulbecco modified Eagle medium, sonicated three times for 20 s each time, and clarified by centrifugation at 2,000 rpm for 10 min. Clarified viral homogenates were stored at −70°C until time of assay. L2 cells, a line of alveolar epithelial cells, were plated on 12-well polystyrene plates and grown to confluence. Diluted viral preparations were added to wells in duplicate or triplicate, and viral plaques were counted at 72 h after addition of the diluents. The data were expressed as the log10 PFU per gram of CNS tissue.
Immunocytochemical detection of virus antigen.
Spinal cord sections were embedded in paraffin and cut into 2-μm sections. Sections were deparaffinized and rehydrated. Sections were incubated with polyclonal rabbit anti-TMEV DA, and particles were detected with phosphatase substrate (Hanker Yates). The viral particles were counted. Spinal cord areas were calculated by using a Zeiss camera lucida. Cord areas were circled, and areas were calculated in square millimeters. The final data were expressed as the number of viral particles per square millimeter of spinal cord.
Virus neutralization assay.
Samples of TMEV DA were diluted to 50 PFU/0.2 ml and mixed with an equal volume of prediluted twofold dilutions of heat-inactivated serum from infected, noninfected, and medium samples. After incubation at 25°C for 1 h, the samples were assayed for infectious virus by plaque assay. Neutralization titers were expressed as the log2 dilution of serum which resulted in a 95% reduction in virus titer.
Real-time RT-PCR assay.
Real-time RT-PCR assays were performed as previously described (29), with modifications for the detection of murine chemokines.
RNA isolation and cDNA synthesis.
The spinal cords were removed from animals on days 0, 45, 90, and 180 after TMEV infection in CD4-deficient and CD8-deficient mice on C57BL/6 (B6) (H-2b, resistant strain) and PLJ (H-2u, susceptible strain) background. The tissues were frozen in liquid nitrogen, chilled in isopentane, and stored in liquid nitrogen. Two 30-μm cryostat sections of each tissue per animal were stored in sterile tubes at −80°C. Trizol (Gibco-BRL) was added (500 μl to spinal cord sections and 700 μl to brain sections), and RNA was precipitated with isopropanol by using 1 μl of 20 mg of glycogen (Roche)/ml as a carrier at −20°C overnight. The RNA concentration was determined by spectrophotometry, and 1 μg of RNA was DNase treated (Gibco-BRL) according to the manufacturer's instructions. First-strand cDNA was synthesized by using 1 μg of DNase-treated RNA, oligo(dT) primers, and Superscript II (Gibco-BRL) according to the manufacturer's instructions.
Generation of standard curves.
The fragments of mouse monocyte chemoattractant protein 1 (MCP-1)/CCL2 (ca. 400 bp), IP-10/CXCL10 (ca. 600 bp), and RANTES/CCL5 (ca. 400 bp) transcripts were amplified in RT-PCRs by using gene-specific primers. The primer pair sequences were as follows: MCP-1 forward (5"-ATCCCAATGAGTAGGCTGGAGAGC-3") and backward (3"-AAGGCATCACAGTCCGAGTCACAC-5"), IP-10 forward (5"-CAACCCAAGTGCTGCC-3") and backward (3"-GGGAATTCACCATGGCTTGACCA-5"), RANTES forward (5"-TTTGCCTACCTCTCCCTAGAGCTG-3") and backward (3"-ATGCCGATTTTCCCAGGACC-5"), and GAPDH (glyceraldehyde-3-phosphate dehydrogenase) forward (5"-GGTGGAGGTCGGAGTCAACG-3") and backward (5"-CAAAGTTGTCATGGATGACC-3"). The PCR products were subcloned into the PCR 2.1 vector (Original TA Cloning Kit; Invitrogen, Carlsbad, Calif.) according to the manufacturer's instructions. The plasmid DNA was quantified by spectrophotometry. Five serial 10-fold dilutions of plasmid DNA (from 2,000 to 0.2 fg/reaction mixture) were prepared, amplified by PCR, and labeled with SYBR Green (Roche, Indianapolis, Ind.), which yields a bright fluorescence on binding of double-stranded nucleic acids; this fluorescence abruptly diminishes upon denaturation of DNA strands during melting-curve analysis. PCR and analysis to generate standard curves were performed with 20-μl reaction mixtures in glass capillaries by using a LightCycler (Roche) and LightCycler 3 software. For each reaction, melting-curve analysis was used to detect the synthesis of nonspecific products. Negative controls (omitting input cDNA) were also used in each PCR run to confirm the specificity of the PCR products. PCR standard curves were linear across serial 10-fold dilutions, and the melting curve analysis indicated synthesis of a single homogeneous product of the expected melting temperature.
PCR and real-time analysis.
Standard curves were generated with each set of samples. The reactions were done in 20-μl capillaries containing 2.5 mM Mg2+, 0.2 μM concentrations of each forward and backward primer (identical to those used to generate the plasmid DNA template for standard curve), 1× DNA Master SYBR Green (LightCycler-DNA Master SYBR Green I kit; Roche), and 2 μl of cDNA. Reaction conditions for PCR were as follows: denaturation at 95°C for 1 min, followed by 40 cycles of amplification by denaturing at 95°C for 15 s, annealing at 60°C for 5 s, and extension at 72°C for 15 s. For GAPDH, reaction conditions were as follows: denaturation at 95°C for 2 min, followed by 40 cycles of amplification by denaturing at 95°C for 3 s, annealing at 60°C for 5 s, and extension at 72°C for 30 s. The accumulation of products was monitored by SYBR Green fluorescence at the completion of each cycle. Analysis was performed with the LightCycler 3 software, and the results are expressed as the crossing point at which accumulation of PCR products became exponential. Using the standard curves, this value was converted to femtograms of target. The reaction conditions for melting curve analysis were as follows: denaturation to 95°C at 20°C/s without plateau phase, annealing at 65°C for 15 s, and denaturation to 95°C at 0.1°C/s, with continuous monitoring of SYBR Green fluorescence. Selected RNA samples (n = 24) from wild-type mice and knockout mice of each strain, with or without viral infection, were analyzed for GAPDH mRNA levels to determine the levels of mRNA per sample and the technical reproducibility. The GAPDH mRNA level per sample was 79 ± 28.5 fg (mean ± the standard deviation), with a range from 23 to 139 fg. Of 24 samples, 22 fell within a threefold range of from 40 to 118 fg. Therefore, the marked variations in chemokine mRNA levels in individual specimens (as much as 6 logs) could not be attributed to differences in amplifiable material.
Statistics.
Virological and clinical data that were normally distributed were evaluated by one-way analysis of variance (ANOVA). Pairwise comparisons were evaluated by the Student-Neuman-Keuls method. Data that were not normally distributed were evaluated by the Kruskal-Wallis one-way ANOVA of ranks, and subsequent control comparisons were done by using Dunn's method. For viral titers that were not normally distributed, the Mann-Whitney U test was employed.
Chemokine expression data (in log10 femtograms of specific mRNA) were analyzed by ANOVA for relatedness to day postinfection (p.i.) and genotype (PLJ or C57BL/6 background strain; presence of CD4+ or CD8+ lymphocytes) by using SAS software (Cary, N.C.).
The significance was set at P < 0.05.
RESULTS
Both CD4+ and CD8+ T cells are required to clear TMEV infection in resistant mice, but the absence of CD8+ T cells does not enhance virus persistence in susceptible strains
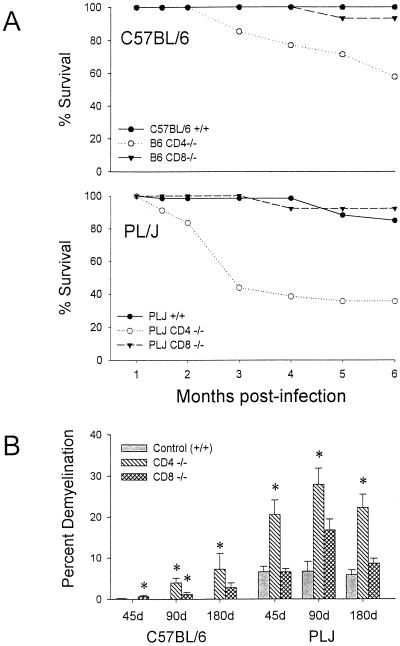
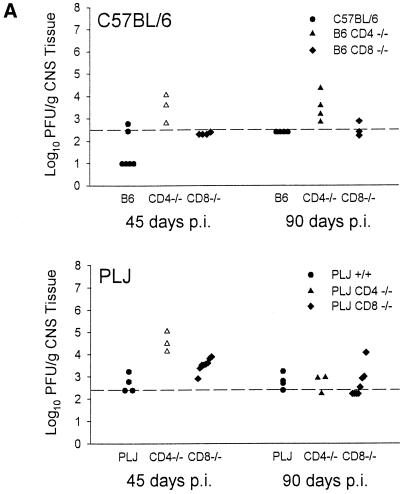
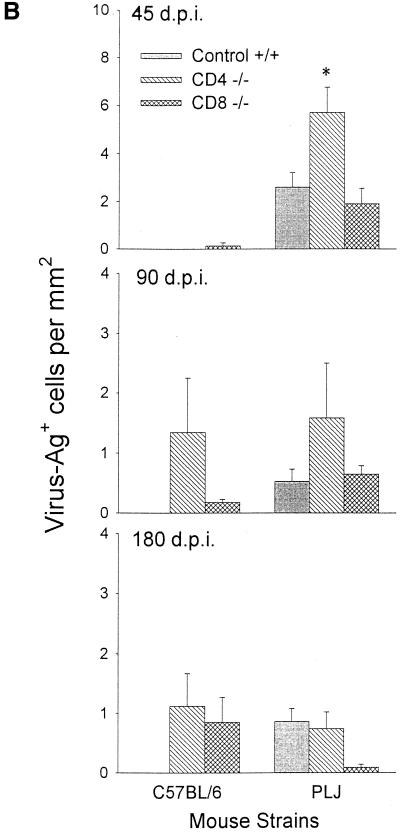
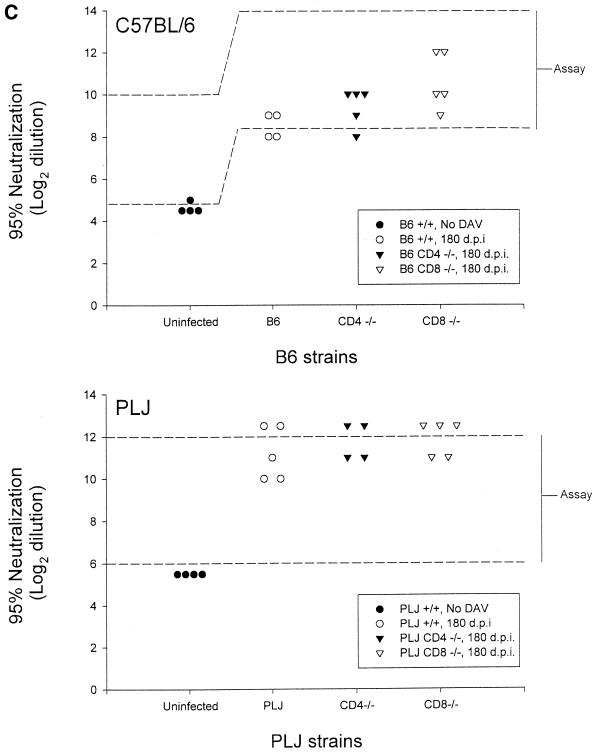
The characteristics of demyelination, neurological impairment, virus persistence, and antiviral antibody response through day 45 p.i. have been previously reported (16, 28). For the present study, additional observations were made, through day 180 p.i. Resistant B6 mice survived infection regardless of the absence of CD8+ T cells. In contrast, mice lacking CD4+ T cells exhibited ca. 50% mortality at 6 months p.i.; this was associated with severe neurological deficits in survivors (Fig. 1A). These neurological deficits in CD4−/− mice were associated with severe demyelination but were not purely contingent upon the effects of demyelination, since CD8−/− mice with equivalent pathological changes (compare Fig. 1A and B) were largely spared. Susceptible PLJ mice exhibited a similar pattern of mortality, with virtually complete survival among wild-type and CD8-deficient mice, whereas CD4-null mice exhibited 60% mortality at 3 months p.i. (Fig. 1A). In these mice, mortality and demyelination were highly associated. As determined by plaque assays, resistant B6 wild-type mice and CD8-deficient mice had largely cleared infection by 45 days p.i., whereas CD4-null mice exhibited moderate CNS viral titers (Fig. 2A). TMEV persisted in the CNS in mice lacking CD4+ T cells through 90 days p.i. (Fig. 2A). In susceptible PLJ mice, TMEV was readily detected in wild-type, CD4-deficient, and CD8-null mice at 45 days p.i., with the highest concentrations of virus in the CD4−/− strains (Fig. 2A). Infectious virus was detected at equivalent low levels in all three strains of PLJ mice at 90 days p.i. Persistent virus was also monitored by quantitating virus antigen-expressing cells in CNS tissues. These results were largely concordant with those obtained by plaque assay. Interestingly, equivalent numbers of virus-infected cells were detected in the CNS of CD4-deficient and CD8-null B6 mice at 180 days p.i. and in susceptible wild-type and CD4-deficient PLJ mice, while surviving CD8-deficient PLJ mice had largely cleared virus by this time point (Fig. 2B). Taken together, these results confirmed and extended characterization of the course of TMEV infection (16). In particular, resistant B6 animals were rendered TMEV-susceptible by deletion of either CD4+ or CD8+ T cells. Susceptible PLJ mice were not more vulnerable to virus infection after elimination of CD4+ or CD8+ T cells. Characteristics of TMEV infection in resistant and susceptible mice lacking either CD4+ or CD8+ T cells were mirrored by the antiviral antibody response. Equal virus-neutralizing antibody titers were found in all three strains of B6 mice regardless of the presence or absence of CD4+ or CD8+ T cells. Equivalent observations were made of susceptible PLJ mice, although the virus-neutralizing titers were 2 orders of magnitude higher than in B6 mice (Fig. 2C). TMEV-mediated demyelination was closely associated with the extent of persistent viral gene expression (compare Fig. 1B and 2B). In B6 mice that lacked CD4+ T cells, viral gene expression was significantly higher than in wild-type or CD8-deficient B6 mice. Viral gene expression and demyelination became dissociated by 180 days p.i., since surviving CD4-null B6 mice developed extensive demyelination, whereas CD8-null B6 mice exhibited relative protection from demyelination at this late time point (Fig. 1B). In susceptible PLJ mice, the relationship between demyelination and viral gene expression at 45 and 90 days p.i. was quite tight. By 180 days p.i., CD4-null mice exhibited severe demyelination (reflecting poor myelin repair) despite relatively modest levels of persistent viral gene expression (compare Fig. 1B and 2B).
FIG. 1.
Survival analysis in B6 and PLJ mice (A) and percent demyelination (B) in B6 and PLJ mice at 45, 90, and 180 days after TMEV infection. (A) Both B6 CD4−/− and PLJ CD4−/− mice showed significant decreases in survival compared to control and CD8−/− mice. (B) B6 CD4−/− and PLJ CD4−/− mice both showed significant differences in the percentage of demyelination in the spinal cord. Results for groups reaching statistical significance compared to those for +/+ controls are marked with an asterisk.
FIG. 2.
Virus titers in CNS tissue, viral antigen immunohistochemistry, and viral antibody neutralization in B6 and PLJ mice. (A) Virus titers in CNS tissues were higher in both B6 CD4−/− and PLJ CD4−/− mice at 45 days post-TMEV infection (P < 0.05). (B) Staining for TMEV by immunohistochemistry demonstrated an increase in positively stained cells in 45-day-infected PLJ CD4 −/− mice (P < 0.05). (C) Virus antibody titers revealed no differences between TMEV-infected B6 mice and PLJ control or mutant mice (P > 0.05).
Spinal cord chemokine expression in TMEV-infected mice is associated with viral persistence rather than the presence of regulatory T cells.
CNS chemokine expression was monitored by quantitative real-time RT-PCR assay. For these experiments, RNA was prepared from spinal cords of B6 and PLJ mice at various time points after infection, with tissues from mock-infected mice used as day zero controls. Spinal cord chemokine expression reflected inflammation associated with the chronic demyelinating encephalomyelitis due to TMEV persistence. Several chemokines, with distinct functions in inflammation and immunity, were measured (3). RANTES/CCL5, a chemokine that acts toward memory T cells and monocytes, is regulated by a wide variety of cytokines in vitro (14). IP-10/CXCL10, a chemoattractant for activated T cells, is regulated in immune-mediated inflammation by gamma interferon (IFN-γ) (9, 32). MCP-1/CCL2 is a monocyte chemoattractant whose expression can be stimulated by a large diversity of insults, including infection, trauma, oxidation, and stress, and, in neurons and Schwann cells, by axotomy (25, 26). All three chemokines are also stimulated in vitro either by virus infection of cells or by components, such as double-stranded RNA, that are associated with viral replication (34).
By ANOVA, there was a robust, highly significant relationship between the day p.i. and spinal cord mRNA expression for RANTES and MCP-1 in each mouse strain (P < 0.0001 for each chemokine in PLJ and B6 mice of all genotypes), with a similar correlation for IP-10 (P = 0.03).
B6 mice.
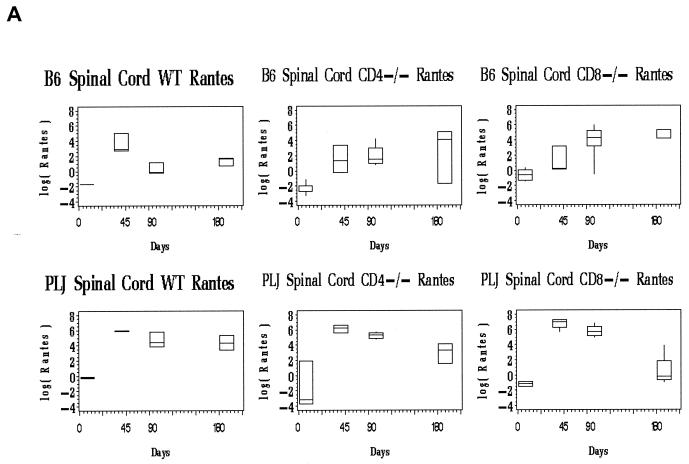
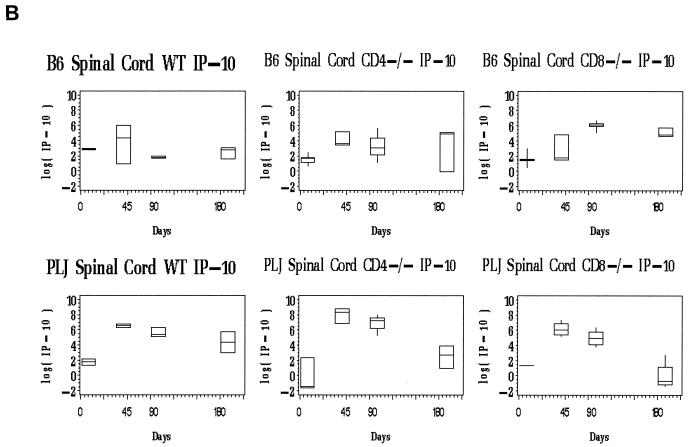
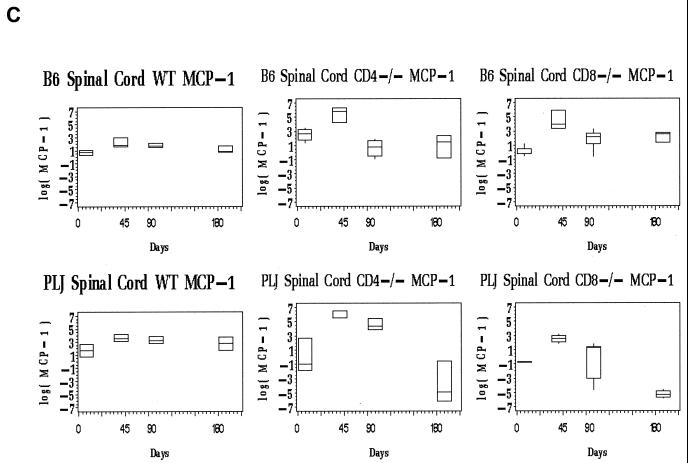
Evaluation of spinal cord chemokine mRNA levels revealed differences between wild-type and T-cell subset-deficient B6 mice. For all three chemokines, the spinal cord message levels at time points after day 45 p.i. greatly exceeded those observed in the brain (not shown). In wild-type B6 mice, the spinal cord chemokine expression was elevated at day 45 p.i., probably associated with definitive viral clearance (Fig. 3, upper panels). At later time points (days 90, 180 p.i.), chemokine expression in wild-type B6 mice remained near baseline levels (Fig. 3, upper panels). Of interest, only chemokines associated with activated T cells (RANTES and IP-10) were elevated at day 45 p.i. in the spinal cords of the wild-type B6 mice (Fig. 3A and B, upper panels). CD4-and CD8-deficient B6 mice exhibited prolonged spinal cord chemokine expression (Fig. 3, upper panels). This elevated chemokine expression was most pronounced for RANTES and IP-10, both of which are directly stimulated in glial cells by virus challenge (6, 12). MCP-1 mRNA levels declined to baseline in all three strains of mice by day 90 and remained at basal levels through day 180 p.i. (Fig. 3, upper panels). In contrast, spinal cord RANTES mRNA levels remained as much as 100-fold elevated through day 180 p.i. in both CD4- and CD8-deficient B6 mice; similar patterns were observed for spinal cord IP-10 expression (Fig. 3A and B, upper panels). Elevated and continuous chemokine expression in the CNS closely reflected persistent TMEV gene expression in the spinal cord in these mice (compare Fig. 2B, lefthand columns, with 3A and B, upper panels).
FIG. 3.
Spinal cord chemokine expression in B6 and PLJ mice with TMEV infection. Chemokine mRNAs from spinal cords of individual mice (n = 2 to 9) were analyzed by real-time RT-PCR as described in Materials and Methods. The figures depict box-and-whisker plots of log10 femtograms of RANTES (A), IP-10 (B), or MCP-1 (C) mRNA in B6 (upper panels) or PLJ (lower panels) mice that were either wild type (WT) or CD4 or CD8 deficient, as indicated. The lower bound of each box represents the 25th percentile, the line inside the box is the 50th percentile, and the upper bound of the box is the 75th percentile; whiskers cover 99% of the data. For several day zero controls, due to the small sample size, the 50th percentile line coincides with either the upper or the lower bound of the box. (A) Spinal cord RANTES mRNA varied significantly (P < 0.0001) with the day p.i. in all B6 and PLJ strains but was only transiently elevated in B6 wild-type mice. All mouse strains that exhibited sustained viral persistence also demonstrated chronically elevated spinal cord RANTES expression. (B) Spinal cord IP-10 mRNA demonstrated elevations with a similar temporal pattern (P = 0.03 for the relationship between IP-10 mRNA and the day p.i.) and magnitude as RANTES. (C) Spinal cord MCP-1 was elevated to a lesser extent than either of the more T-cell-directed chemokines but with a compatible temporal pattern (P < 0.0001).
Cerebral chemokine expression in B6 mice, reflecting inflammation associated with initial poliomyelitis, was relatively modest (data not shown). The most robust expression achieved a slightly more than 10-fold excess over baseline. Brain chemokine expression differed relatively little among the three strains of B6 mice. IP-10 was upregulated at 45 days p.i. in all B6 mice, returning to baseline by 90 days p.i. in wild-type mice, a result concomitant with the clearance of cerebral virus. RANTES exhibited a similar pattern, as did MCP-1.
PLJ mice.
The spinal cords of PLJ mice exhibited dramatic elevation in chemokine expression (Fig. 3, lower panels). At 45 and 90 days p.i., spinal cord IP-10 and RANTES mRNAs were elevated several orders of magnitude above background levels in wild-type, CD4-deficient, and CD8-null PLJ mice (Fig. 3A and B, lower panels). Interestingly, spinal cord IP-10 and RANTES message levels decreased to baseline in CD8-deficient mice but not in CD4-null PLJ mice at day 180 p.i., reflecting the unexpected clearance of viral infection at this late time point in surviving CD8−/− animals (compare Fig. 2B, righthand columns, with Fig. 3A and B, lower panels). As observed for B6 mice, the alterations in spinal cord MCP-1 expression were modest and transient compared with the elevation of IP-10 and RANTES expression (Fig. 3C, compare upper and lower panels).
Levels of RANTES message in the brain were elevated by day 45 p.i. in all three strains of PLJ mice and remained elevated throughout the time course of infection (data not shown). IP-10 mRNA levels were less markedly elevated at day 45 p.i. and remained elevated only in CD4-deficient mice at day 90 and day 180 p.i. (data not shown).
DISCUSSION
These experiments were undertaken to establish the roles of T cells in regulating CNS chemokines during the chronic phase of TMEV infection. Chemokine mRNA accumulation was monitored by sensitive and specific real-time RT-PCR assay and included both CC and CXC chemokines. These data were correlated with the mouse strain, as well as with the presence or absence of CD4+ and CD8+ T cells. Additionally, we determined the clinical outcomes of TMEV infection, viral persistence, and antiviral neutralizing antibodies. Qualitatively, chemokine expression was relatively limited to products that act toward activated and memory T cells (IP-10 and RANTES), with much lower levels of message encoding the monocyte chemoattractant MCP-1. Quantitatively, spinal cord chemokine production at late time points was surprisingly robust. Remarkably, sustained chemokine expression was strongly associated with viral persistence, with little effect of other variables. This relationship was observed at both quantitative and qualitative levels. Most impressively, in five strains of mice with chronic spinal TMEV persistence (B6 and PLJ CD4−/− and CD8−/−; PLJ+/+ [Fig. 2]), a uniform pattern of spinal cord chemokine expression was observed: high and sustained elevation of RANTES and IP-10 and a variable and modest increase in MCP-1 (Fig. 3). Compatible results were reported by Lane et al. (11) in studies of chronic demyelinating infection with mouse hepatitis virus, where the spectrum of chemokines was similar to that reported here and expression was associated with the presence of viral RNA in tissue. As another example, there was an unexpected clearance in PLJ CD8−/− mice of virus at day 180 p.i., a result accompanied by reduced chemokine expression. For wild-type B6 mice, maximal spinal cord chemokine expression occurred on day 45 p.i., but in both T-cell-subset-deficient strains, spinal cord chemokine expression peaked at later time points, concomitant with elevated viral gene expression. In all three strains of PLJ mice, spinal cord chemokine expression peaked at day 45 p.i. and remained elevated at all time points thereafter, closely mimicking the temporal pattern of TMEV gene expression in the spinal cord.
Thus, chemokine production in mice persistently infected with TMEV was vigorous and was not altered as a function of mouse strain or by the deletion of either CD4+ or CD8+ T cells. Neither was the relative mRNA level for individual chemokines (IP-10, RANTES, and MCP-1) altered by any variable. The results indicate that chemokine expression in this model is not driven by factors that shape the immune response to virus but rather represents an element of the innate CNS response to viral persistence.
We previously studied chemokine message expression during the earlier phases of TMEV disease and found a high-level expression of IP-10, RANTES, and MCP-1 in the brains of infected mice (susceptible and resistant) during the acute phase of polioencephalitis and viral clearance (15). Cerebral chemokine message levels dropped thereafter. IP-10 and RANTES expression rebounded in the spinal cords of susceptible mice, concurrent with the transition to demyelinating encephalomyelitis due to viral persistence in glia. The current results confirm and extend those observations. Additionally, our results are concordant with those reported previously by Theil et al. (30), who found identical patterns of chemokine message accumulation but variable levels of cytokine expression during acute infections with three TMEV viruses that cause widely differing patterns of infectious pathology.
TMEV is one of several model systems used to investigate aspects of the pathogenesis of multiple sclerosis; another one is experimental autoimmune encephalomyelitis (EAE) (4, 7, 33). CNS chemokine expression in EAE has been studied in a variety of models, with several different superimposed perturbations. As a general statement, CNS chemokine production in EAE is closely associated with active disease, includes a wide diversity of individual chemokines, and is regulated directly by the inflammatory cytokines that orchestrate the autoimmune process (10). This concept was supported by our finding that IFN-γ-dependent chemokines (IP-10) are not produced during EAE in mice lacking this cytokine (termed IFN-γ knockout [GKO]) (4). In contrast, one IFN-γ-inhibited chemokine (KC/CXCL1) was overproduced in GKO mice with EAE and mediated neutrophilic inflammation (32). Therefore, the present results indicate a fundamental difference between TMEV-induced disease and EAE: in the latter case, chemokine expression is regulated by the cytokine products of hematogenous leukocytes while, in the present case, chemokine expression is independent of this regulation. In support of this concept, we found no major alteration of CNS chemokine expression in TMEV-infected mice that lack either IFN-γ receptor or interleukin-6 (T. Wei, R. M. Ransohoff, and M. Rodriguez, unpublished data).
The mechanisms by which TMEV persistence drives CNS chemokine expression remain uncertain. We consider it likely that most chemokine expression in the CNS of TMEV-infected mice arises from glial cells, including astrocytes and microglia. These two cell types are the major sources of chemokines in other models of CNS viral infection, including lymphocytic choriomeningitis and mouse hepatitis virus (1, 2, 11, 13). Replication-competent and -incompetent virus particles directly induce transcription of chemokines in astrocytes and other cell types by various mechanisms, including production of double-stranded RNA, activation of NF-κB p65, and phosphorylation of IFN regulatory factor 3 (6, 12, 17, 18, 20, 23).
In summary, we provide here evidence that CNS chemokine expression in mice infected with TMEV is governed by viral persistence and not by either CD4+ or CD8+ T-cell products. In this regard, TMEV-associated chemokine expression is regulated differently from CNS chemokine expression in EAE. The implications of this finding will be pertinent for the use of these models in evaluating how chemokines regulate CNS inflammation in multiple sclerosis and other human disorders (7, 33).
Acknowledgments
This study was supported by Public Health Service grant NS32151 to R.M.R.
REFERENCES
- 1.Asensio, V. C., and I. L. Campbell. 1999. Chemokines in the CNS: plurifunctional mediators in diverse states. Trends Neurosci. 22:504-512. [DOI] [PubMed]
- 2.Asensio, V. C., and I. L. Campbell. 1997. Chemokine gene expression in the brains of mice with lymphocytic choriomeningitis. J. Virol. 71:7832-7840. [DOI] [PMC free article] [PubMed] [Google Scholar]
- 3.Baggiolini, M. 1998. Chemokines and leukocyte traffic. Nature 392:565-568. [DOI] [PubMed] [Google Scholar]
- 4.Buchmeier, M., and T. Lane. 1999. Viral-induced neurodegenerative disease. Curr. Opin. Microbiol. 2:398-402. [DOI] [PMC free article] [PubMed] [Google Scholar]
- 5.Butcher, E. C., and L. J. Picker. 1996. Lymphocyte homing and homeostasis. Science 272:60-66. [DOI] [PubMed] [Google Scholar]
- 6.Cheng, G., A. S. Nazar, H. S. Shin, P. Vanguri, and M. L. Shin. 1998. IP-10 gene transcription by virus in astrocytes requires cooperation of ISRE with adjacent κB site but not IRF-1 or viral transcription. J. Interferon Cytokine Res. 18:987-997. [DOI] [PubMed] [Google Scholar]
- 7.Dal Canto, M., R. Melvold, B. Kim, and S. Miller. 1995. Two models of multiple sclerosis: experimental allergic encephalomyelitis (EAE) and Theiler's murine encephalomyelitis virus (TMEV) infection. A pathological and immunological comparison. Microsc. Res. Tech. 32:215-229. [DOI] [PMC free article] [PubMed] [Google Scholar]
- 8.Fung-Leung, W., M. Schilham, A. Rahemtulla, T. Kundig, M. Vollenweider, J. Potter, W. van Eqijk, and T. Mak. 1991. CD8 is needed for development of cytotoxic T cells but not helper T cells. Cell 65:443-449. [DOI] [PubMed] [Google Scholar]
- 9.Glabinski, A. R., M. Krakowski, Y. Han, T. Owens, and R. M. Ransohoff. 1999. Chemokine expression in GKO mice (lacking interferon-gamma) with experimental autoimmune encephalomyelitis. J. Neurovirol. 5:95-101. [DOI] [PubMed] [Google Scholar]
- 10.Huang, D., Y. Han, M. Rani, A. Glabinski, C. Trebst, T. S/orensen, M. Tani, J.-T. Wang, P. Chien, S. O'Bryan, B. Bielecki, Z.-H.L. Zhou, S. Majumder, and R. Ransohoff. 2000. Chemokines and chemokine receptors in inflammation of the nervous system: manifold roles and exquisite regulation. Immunol. Rev. 177:52-67. [DOI] [PubMed] [Google Scholar]
- 11.Lane, T. E., V. C. Asensio, N. Yu, A. D. Paoletti, I. L. Campbell, and M. J. Buchmeier. 1998. Dynamic regulation of alpha- and beta-chemokine expression in the central nervous system during mouse hepatitis virus-induced demyelinating disease. J. Immunol. 160:970-978. [PubMed] [Google Scholar]
- 12.Lin, R., C. Heylbroeck, P. Genin, P. M. Pitha, and J. Hiscott. 1999. Essential role of interferon regulatory factor 3 in direct activation of RANTES chemokine transcription. Mol. Cell. Biol. 19:959-966. [DOI] [PMC free article] [PubMed] [Google Scholar]
- 13.Liu, M. T., B. P. Chen, P. Oertel, M. J. Buchmeier, D. Armstrong, T. A. Hamilton, and T. E. Lane. 2000. The T cell chemoattractant IFN-inducible protein 10 is essential in host defense against viral-induced neurologic disease. J. Immunol. 165:2327-2330. [DOI] [PubMed] [Google Scholar]
- 14.Luster, A. 1998. Chemokines: chemotactic cytokines that mediate inflammation. N. Engl. J. Med. 338:436-445. [DOI] [PubMed] [Google Scholar]
- 15.Murray, P. D., K. Krivacic, A. Chernosky, T. Wei, R. M. Ransohoff, and M. Rodriguez. 2000. Biphasic and regionally restricted chemokine expression in the central nervous system in the Theiler's virus model of multiple sclerosis. J. Neurovirol. 6(Suppl. 1):S44-S52. [PubMed] [Google Scholar]
- 16.Murray, P. D., K. D. Pavelko, J. Leibowitz, X. Lin, and M. Rodriguez. 1998. CD4+ and CD8+ T cells make discrete contributions to demyelination and neurologic disease in a viral model of multiple sclerosis. J. Virol. 72:7320-7329. [DOI] [PMC free article] [PubMed] [Google Scholar]
- 17.Muruve, D. A., M. J. Barnes, I. E. Stillman, and T. A. Libermann. 1999. Adenoviral gene therapy leads to rapid induction of multiple chemokines and acute neutrophil-dependent hepatic injury in vivo. Hum. Gene Ther. 10:965-976. [DOI] [PubMed] [Google Scholar]
- 18.Nazar, A. S., G. Cheng, H. S. Shin, P. N. Brothers, S. Dhib-Jalbut, M. L. Shin, and P. Vanguri. 1997. Induction of IP-10 chemokine promoter by measles virus: comparison with interferon-γ shows the use of the same response element but with differential DNA-protein binding profiles. J. Neuroimmunol. 77:116-127. [DOI] [PubMed] [Google Scholar]
- 19.Njenga, M. K., and M. Rodriguez. 1996. Animal models of demyelination. Curr. Opin. Neurol. 9:159-164. [DOI] [PubMed] [Google Scholar]
- 20.Ohmori, Y., and T. A. Hamilton. 1995. The interferon-stimulated response element and a κB site mediate synergistic induction of murine IP-10 gene transcription by IFN-γ and TNF-α. J. Immunol. 154:5235-5244. [PubMed] [Google Scholar]
- 21.Oleszak, E. L., J. Kuzmak, R. A. Good, and C. D. Platsoucas. 1995. Immunology of Theiler's murine encephalomyelitis virus infection. Immunol. Res. 14:13-33. [DOI] [PubMed] [Google Scholar]
- 22.Pierce, M., and M. Rodriguez. 1989. Erichrome stain for myelin on osmicated tissue embedded in glycol methacrylate plastic. J. Histotechnol. 12:35-36. [Google Scholar]
- 23.Ping, D., G. H. Boekhoudt, E. M. Rogers, and J. M. Boss. 1999. Nuclear factor-κB p65 mediates the assembly and activation of the TNF-responsive element of the murine monocyte chemoattractant-1 gene. J. Immunol. 162:727-734. [PubMed] [Google Scholar]
- 24.Rahemtulla, A., W. Fung-Leung, M. Schilham, T. Kundig, S. Sambhara, A. Narendran, A. Arabian, A. Wakeham, C. Paige, R. Zinkernagel, and T. Mak. 1991. Normal development and function of CD8+ cells but markedly reduced helper cell activity in mice lacking CD4. Nature 353:180-184. [DOI] [PubMed] [Google Scholar]
- 25.Ransohoff, R. 1997. Chemokines in neurological disease models: correlation between chemokine expression patterns and inflammatory pathology. J. Leukoc. Biol. 62:645-652. [DOI] [PubMed] [Google Scholar]
- 26.Ransohoff, R., and M. Tani. 1998. Do chemokines mediate leukocyte recruitment in post-traumatic CNS inflammation? Trends Neurosci. 21:154-159. [DOI] [PubMed] [Google Scholar]
- 27.Rodriguez, M., J. Leibowitz, and P. Lampert. 1983. Persistent infection of oligodendrocytes in Theiler's virus-induced encephalomyelitis. Ann. Neurol. 13:426-433. [DOI] [PubMed] [Google Scholar]
- 28.Rodriguez, M., C. Rivera-Quinones, P. D. Murray, M. Kariuki Njenga, P. J. Wettstein, and T. Mak. 1997. The role of CD4+ and CD8+ T cells in demyelinating disease following Theiler's virus infection: a model for multiple sclerosis. J. Neurovirol. 3(Suppl. 1):S43-S45. [PubMed] [Google Scholar]
- 29.Schreiber, R. C., K. Krivacic, B. Kirby, S. A. Vaccariello, T. Wei, R. M. Ransohoff, and R. E. Zigmond. 2001. Monocyte chemoattractant protein (MCP)-1 is rapidly expressed by sympathetic ganglion neurons following axonal injury. Neuroreport 12:601-606. [DOI] [PubMed] [Google Scholar]
- 30.Theil, D. J., I. Tsunoda, J. E. Libbey, T. J. Derfuss, and R. S. Fujinami. 2000. Alterations in cytokine but not chemokine mRNA expression during three distinct Theiler's virus infections. J. Neuroimmunol. 104:22-30. [DOI] [PubMed] [Google Scholar]
- 31.Theiler, M. 1937. Spontaneous encephalomyelitis of mice, a new virus disease. J. Exp. Med. 65:705-719. [DOI] [PMC free article] [PubMed] [Google Scholar]
- 32.Tran, E. H., E. N. Prince, and T. Owens. 2000. IFN-γ shapes immune invasion of the central nervous system via regulation of chemokines. J. Immunol. 164:2759-2768. [DOI] [PubMed] [Google Scholar]
- 33.Tsunoda, I., and R. S. Fujinami. 1996. Two models for multiple sclerosis: experimental allergic encephalomyelitis and Theiler's murine encephalomyelitis virus. J. Neuropathol. Exp. Neurol. 55:673-686. [DOI] [PubMed] [Google Scholar]
- 34.Wu, C., Y. Ohmori, S. Bandyopadhyay, G. Sen, and T. Hamilton. 1994. Interferon-stimulated response element and NF kappa B sites cooperate to regulate double-stranded RNA-induced transcription of the IP-10 gene. J. Interferon Res. 14:357-363. [DOI] [PubMed] [Google Scholar]


