

Abstract
Cell migration is an essential process during many phases of development and adult life. Cells can either migrate as individuals or move in the context of tissues. Movement is controlled by internal and external signals, which activate complex signal transduction cascades resulting in highly dynamic and localised remodelling of the cytoskeleton, cell–cell and cell–substrate interactions. To understand these processes, it will be necessary to identify the critical structural cytoskeletal components, their spatio-temporal dynamics as well as those of the signalling pathways that control them. Imaging plays an increasingly important and powerful role in the analysis of these spatio-temporal dynamics. We will highlight a variety of imaging techniques and their use in the investigation of various aspects of cell motility, and illustrate their role in the characterisation of chemotaxis in Dictyostelium and cell movement during gastrulation in chick embryos in more detail.
Keywords: chemotaxis, cytoskeleton, image processing, imaging, microscopy, migration
Introduction
Directed cell migration is a fundamental property of many cells and plays an essential role during the development of most organisms. It is essential for gastrulation, the process where the endoderm and mesoderm take up their correct topological positions in the embryo, the formation and the wiring of the nervous system, and it plays a major role in the development of organs such as heart, lungs, kidneys and the intestinal tract. When during these processes cell movements are not properly controlled, it results in severe congenital defects and disease. Also in adult life, cell movement continues to play an extremely important role in processes such as wound healing and the functioning of the immune system. Cell migration is a highly complex process that is mediated by dynamic changes in the actin–myosin cytoskeleton, and can be modulated by the microtubule system and associated motors and in some cells through interaction with the intermediate filament systems. Dynamic remodelling of the cytoskeleton is responsible for all cell behaviours and has to be precisely regulated in space and time, both in response to external as well as internal signals. It is now generally thought that localised actin polymerisation in the front of the cell provides a critical driving force for lamellopodia extension, while contraction of the back of the cell, a myosin-II-dependent process, is necessary for retraction of the rear but it also provides an additional driving force for the cell to move forward, through the generation of a hydrostatic pressure resulting in a cytoplasmatic flow forward. Under some conditions, this may result in blebbing at the leading edge, in cases where the membrane dissociates from the underlying actin cortex (Pollard and Borisy, 2003; Ridley et al, 2003; Affolter and Weijer, 2005; Vicente-Manzanares et al, 2005; Langridge and Kay, 2006; Sheetz et al, 2006). The intracellular components such as nucleus, mitochondria, endoplasmatic reticulum and Golgi also all have to be transported during cell movement; however, the precise mechanisms coupling cell motility to movement of these organelles are so far unknown. It likely involves active transport of these structures along microtubules and the actin–myosin network. Cell movement not only requires the development of forces inside the cell but also requires these forces to be transmitted to the substrate to get traction. Furthermore, interactions with other cells are important and these contacts are mediated by specialised cell–matrix and cell–cell attachment complexes containing integrins and cadherins, respectively (Hynes, 2002; Nelson and Nusse, 2004; Giannone and Sheetz, 2006). These contacts also have to be very dynamic to allow translocation of the cell, which implies that they have to turnover rapidly. Since the cytoskeleton has such a vital function, the regulation of its activity is one of the major tasks the cell faces. This involves a very complex regulatory machinery of several hundreds proteins, which are the targets for extra- as well as intracellular signalling pathways. Understanding such a complex machine and one of its tasks, cell movement, is a major challenge, which will be impossible without a detailed knowledge of the components, their dynamics and insight in how these chemical reactions generate forces that ultimately do the work to result in cell movement (Dobereiner et al, 2005; Giannone and Sheetz, 2006).
Understanding movement of single cells and cells in tissues requires the analysis of these complex processes under normal and perturbed conditions. Ideally one would like to measure movement and shape changes of cells and correlate these with the spatio-temporal dynamics of the cytoskeletal elements and the extra- and intracellular signalling pathways controlling these behaviours in isolated cells as well as in cells in tissues. Imaging is an excellent method to obtain such data since sections through biological specimens can be readily collected at high spatial resolution and with high dynamic range and subsecond temporal resolution. Through the advent of genetically encoded labels, it is now becoming possible to label many of the cellular and cytoskeletal components, without interfering with their function (Zhang et al, 2002; Miyawaki et al, 2003, 2005; Chudakov et al, 2005). In several systems these molecules can be expressed under the control of their own promoters, using knockin techniques, which ensures that they are expressed at physiological concentrations in the correct cell types and at the right stages of development. This allows visualisation of the dynamics of many of the key structural elements of the cytoskeleton, such as actin and actin binding proteins, myosin motors, microtubuli and associated motor proteins, microtubule binding proteins and intermediate filament components. Furthermore, it is possible to labels proteins with tags that can at any given time later be modified with highly efficient fluorophores, which enables to perform pulse label experiments and follows the turnover of important cytoskeletal components (Chudakov et al, 2005; Giepmans et al, 2006). It has also become possible to visualise many of the signalling components that control the assembly/disassembly of the cytoskeleton such as PI3 kinase, PTEN, members of the family of Rho GTPases and their regulators (GAP's and GEF's), downstream targets such as members of the Wasp/Scar/Wave families and more structural components such as formins and components of the ARP2/3complex (Ridley et al, 2003; Lorenz et al, 2004; Manahan et al, 2004; Zigmond, 2004; Nakamura et al, 2006). Activity can be measured through changes in the cellular distribution of these components, changes in intramolecular conformation or complex formation with other signalling molecules. Changes in distribution for instance from the cytoplasm to the membrane are simple to follow, while changes in conformational state or complex formation require more sophisticated measurements such as fluorescence resonance energy transfer (FRET) measurements or correlation spectroscopy (Stephens and Allan, 2003; Bacia et al, 2006).
Imaging of fixed specimens
Much of our knowledge of the internal structure and organisation of cells comes from the investigation of fixed specimens, followed by detailed investigation using a combination of light microscopic and scanning and transmission electron microscopic techniques. These investigations have given a good understanding of the fundamental cytoskeletal components and their macro-molecular architecture. These studies have been instrumental for our understanding of the actin–myosin cytoskeleton, the microtubule network and the organisation of intermediate filaments (Pollard and Borisy, 2003; Mejillano et al, 2004; Green et al, 2005). Especially antibody staining of specific components in combination with light and electron microscopy has proven to be very powerful. The development of confocal and deconvolution microscopy has had an enormous impact on our understanding of cell structure through obtaining excellent three-dimensional (3D) images of cells at high spatial resolution (Wallace et al, 2001).
Electron microscopy has also made great advances in imaging 3D structures. Especially recent developments of EM tomography and sectioning scanning electron microscopy have yielded new insights in the 3D structural organisation of cells and now allow the collection of large-scale images at nm resolution (O'Toole et al, 2002; Denk and Horstmann, 2004; Nicastro et al, 2005). Another recent development is cryo-electron microscopy, which has given insight in the intracellular organisation of cells and their organelles (Baumeister, 2005; Nickell et al, 2006). Although these techniques have not been applied extensively to investigate migrating cells in particular, it is to be expected that they will have considerable impact on our structural understanding of migratory cells, even if they only allow imaging of fixed specimens, which by default gives only a snapshot of the dynamic behaviour of a migrating cell. A technique that can be used to image surfaces of living and fixed specimens and covers size scales from the molecular to the cellular level is atomic force microscopy (AFM). In general, a cantilever is used to follow the 3D contours of the specimen under investigation and the deflection of the cantilever is measured with high precision (Simon and Durrieu, 2006). This method can also be used to probe the mechanical properties of the migrating cells (Radmacher, 2002; Laurent et al, 2005; Park et al, 2005; Trache and Meininger, 2005) as well as the strength of cell–cell adhesion and cell–substrate adhesion (Vedula et al, 2005; Wu et al, 2005).
Imaging methods used to study cell migration
Wide field, deconvolution and confocal microscopy
The starting point for many investigations of cell movement is to characterise the behaviour of cells, by recording shape changes, direction and persistence of movement and the dynamics of subcellular processes such as extension and retraction of lamellipodia, pseudopods, filopodia and membrane ruffling (Soll et al, 2003; Sepich and Solnica-Krezel, 2005). These investigations make extensive use of light microscopy methods, especially wide-field microscopy in either phase contrast or Nomarski Interference Contrast modes. Images are collected by CCD cameras as simple sections or as Z stacks. These time series then have to be analysed, which may involve image segmentation and reconstruction of 3D surfaces, followed by procedures to recognise particular behaviours and statistical analysis.
However, in order to understand cell behaviours, it is necessary to acquire a detailed understanding of the spatio-temporal control of the cytoskeleton. This can be achieved by following the dynamics of GFP tagged cytoskeletal components, making use of the great variety of fluorescent proteins with different spectral properties and biochemical characteristics now available (Zhang et al, 2002; Miyawaki et al, 2005; Shaner et al, 2005). The combination of GFP tagged proteins with wide-field deconvolution microscopy and confocal microscopy, both techniques that have significantly improved resolution along the Z-axis, allows the 3D reconstruction of the cytoskeletal dynamics in isolated cells (Wallace et al, 2001; Swedlow and Platani, 2002; Gerisch and Muller-Taubenberger, 2003). Furthermore, GFP tagging is now being used in large-scale genomic screens to define the behaviour of important signalling components, some of which are expected to play key roles in the control of the cytoskeleton. Screens that are performed include screen of all proteins containing phosphatidyl-inositol lipid binding domains or screens investigating the translocation of protein kinases and phosphatases as part of their activation (Teruel and Meyer, 2000, 2002; Gilman et al, 2002). Other methods of tagging molecules that hold considerable promise for the future are labelling of intracellular small epitopes (Adams et al, 2002; Martin et al, 2005; Giepmans et al, 2006) and multicolour labelling of extracellular surface fusion proteins through suicide substrates that can be used for FRET studies (Vivero-Pol et al, 2005; Meyer et al, 2006).
FRAP/FLAP
In many instances it is of considerable interest to measure the exchange dynamics of molecules under investigation and deduce transport and flow properties from these measurements. A techniques that is widely used is fluorescence recovery after photobleaching (FRAP), which measures the movement of labelled molecules back into a selected area after local destruction of the reporter molecule by high-intensity light irradiation (Stephens and Allan, 2003). FRAP has been used extensively to measure the exchange rate of proteins in specific structures in cells. A further development of this technique is FLAP, a technique in which populations of molecules of interest, for instance actin, are labelled with two distinct fluorophores. One fluorophore is bleached and by measuring the ratio between bleached and nonbleached molecules, it is possible to deduce not only the diffusion and flow into the bleached spot but also the diffusion and flow into other areas of the cell (Zicha et al, 2003). Using this method it has been shown that delivery of actin to protrusions in the leading edge of migrating cells exceeds 5 μm/s, which would suggest that this delivery is faster than diffusion and is most likely flow driven.
There also appears much promise for the application of fluorescent proteins that can be photo-activated or inactivated by pulses of excitation light (Patterson and Lippincott-Schwartz, 2002; Habuchi et al, 2005; Gurskaya et al, 2006). This allows pulse label experiments to follow the behaviour of selected groups of labelled proteins especially their dispersal from the site of labelling and will be of great help in dissecting the dynamics of protein translocations during cell movement as has recently been performed for actin crosslink dynamics and their role in stress fibre formation (Hotulainen and Lappalainen, 2006) and the analysis of focal adhesion dynamics (Webb et al, 2003).
TIRF
A method that is been used extensively to measure the dynamics of proteins associated with the plasma membrane is total internal reflection microscopy (TIRF), which allows measurement of molecules in close proximity to the membrane and when used in combination with high sensitivity detection can even result in the detection of the dynamics of single molecules (Yokota et al, 2004). TIRF has been used extensively to investigate the dynamics of the actin myosin cytoskeleton, the targeting of adhesion sites by microtubuli and the dynamics of cell substrate adhesion and focal adhesion sites (Webb et al, 2003). These measurements can in principle by supplemented by correlation spectroscopy measurements, which can deduce from the transit times of single molecules in a very small volume (typically a volume illuminated by the focal spot of a confocal microscope) whether it moves by diffusion or flow and whether it interacts with other molecules (Bacia et al, 2006). This is still a very experimental technique and has not yet been applied extensively to the investigation of cell motility.
Speckle microscopy
It was observed that the expression of limiting amounts of fluorescently labelled molecules, especially actin, results in a speckled appearance of these molecules in the polymerised (actin-) filaments (Waterman-Storer and Danuser, 2002). High-resolution imaging enables the analysis of the dynamics of these speckles and gives insights into the dynamics and flows of actin filaments in migrating cells. These experiments have given direct support for the retrograde flow of actin away from the leading edge to the base of the lamellipodia, where the flow reverses (Salmon et al, 2002; Watanabe and Mitchison, 2002). The extent of retrograde flow has been shown to be dependent on the coupling of the cytoskeleton to adhesion sites and the rigidity of the substrate (Jurado et al, 2005). These speckle methods are expected to be extremely useful to study and understand actin dynamics in migrating cells under normal and perturbed conditions.
FRET
FRET can be used to measure conformational changes in proteins and the dynamics of protein–protein interactions (Periasamy and Day, 1999; Harpur et al, 2001). The use of FRET techniques to measure protein–protein interactions will become more important with the development of highly efficient FRET indicators (Miyawaki and Tsien, 2000; Kurokawa et al, 2001; Truong et al, 2001). Most experiments measure a change in FRET efficiency as a change in the ratio of the emission wavelength of the fluorescence donor to that of the acceptor. However in some cases, fluorescence lifetime measurements might be better suited, since these measurements are independent of the fluorophore concentrations (Harpur et al, 2001). The drawback of these measurements is that they require more sophisticated equipment (fast pulsed lasers or modulated light) and the calculations needed to analyse the experimental data can be rather complex (Pelet et al, 2004). FRET can be combined successfully with TIRF measurements and in extreme cases it is even possible to perform FRET measurements at the single molecule level. For instance, it has been shown recently that Ras conformation spontaneously fluctuates to enable the interaction with its various reaction partners (Arai et al, 2006).
Force microscopy
An important question in understanding cell movement is how and where the motive and friction forces are generated and how individual molecules contribute to these. Methods have been developed to measure local forces associated with cell movement through the measurement of the deformation of elastic substrates spiked with fluorescent tracer beads (Dembo and Wang, 1999; Oliver et al, 1999). When cells crawl over them, it is possible to deduce from an observed deformation field a force field using linear elasticity theory. These methods were originally developed for large cells such as fibroblasts, but they can be successfully adapted to cells of any size by adjusting the elastic parameters of the gels under investigation and can even be extended to tissues (Rieu et al, 2005). Variations on these measurements use elastic patterned substrates consisting of arrays of elastic pillars. The bending of individual pillars is then measured to get a local readout of the forces produced (du Roure et al, 2005). These force measurement can be used in conjunction with other tools such as pico-second laser cutters that allow severing individual actin stress fibres and/or microtubules to investigate the role of these components in generating compressive and tensile forces in the cell (Kumar et al, 2006). Other useful techniques that can be combined with the analysis of chemotactic cell movements are microfluidic devices that allow hydrodynamic forces to be exerted and precise generation and manipulation of signal gradients and even electrical fields that have been shown to be able to orient cell migration (Zhao et al, 2002; Fache et al, 2005; Diao et al, 2006; Song et al, 2006).
Two photon confocal microscopy
Many experiments are performed in cells on plastic culture dishes or on coated glass substrates, and such are not a very natural environment for most cells that normally are either embedded in a tissue such as an epithelial sheet or embedded in a 3D extracellular matrix. It will become more and more important to analyse cell behaviour in the context of its more natural environment (Webb and Horwitz, 2003). However, observing the behaviour of cells and their intracellular components in multicellular tissues poses special problems for imaging. In general, these samples are not as transparent and as flat as cells on coverslips and there is much more light-scattering in the sample. Another challenge for the future will be to apply these methods to the measurement of the dynamics of reactions underlying cell movement in the context of whole organisms and especially embryos. This is an area where confocal and deconvolution microscopes have been used extensively so far. Advances have been made in the observation of cells in tissues using two photon confocal microscopy, which due to the longer excitation wavelengths and reduced light scattering allows imaging of cells deeper into the tissue (Helmchen and Denk, 2002; Stephens and Allan, 2003; Helmchen and Denk, 2005). Two photon excitation happens normally only in the focus point of a high NA optical lens and thus results in a limited area of excitation, as a result a two photon microscope does not require a pinhole to reject out of focus emission light, all emitted photons can be collected since they are known to originate from a small confocal volume. The excitation by pulsed laser light at longer wavelengths, which is less subject to light scattering, results in a larger penetration depth than normal confocal microscopy (Helmchen and Denk, 2005). Two photon microscopy has therefore been used to study the migration of cells in organisms. Another advantage of using two photon confocal microscopy is that it can easily be adapted to study FRET through fluorescence lifetime imaging and exploit the principle of second harmonic generation to show structural elements of the extracellular matrix on which cells migrate. Collagen fibres, for instance, have been visualised to analyse the migration of tumour cells in vivo (Sahai et al, 2005; Cox and Kable, 2006).
SPIM
Another technique that has been developed recently is Single Plane Illumination Microscopy (SPIM) (Huisken et al, 2004; Keller et al, 2006). This technique seems to be very useful for the imaging of large specimens with low magnification and thus low numerical aperture (NA) lenses. SPIM uses a combination of plane illumination of the object with capture of the images using a cooled CCD camera at an angle of 90°. This significantly reduces the out of plane fluorescence, which results in reduced exposure of the sample to light and due to the use of a CCD to record the images results in an improved signal-to-noise ratio with a larger dynamic range. Since the pointspread function of the collection system is at right angles with the plane of illumination, the area from which fluorescence photons are collected becomes almost isotropic, which helps in 3D image reconstruction and quantitative measurements of fluorescence intensities in the 3D volume.
Fast imaging and spinning disk confocal microscopy
Other improvements that have to be made are to use imaging regimes that work both at high resolution and fast time scales to capture events such as very fast calcium waves associated with neutrophils polarisation and chemotaxis (Kindzelskii and Petty, 2003) or even rapid changes in the dynamics of the actin cytoskeleton as observed at high magnification during migration of fast moving cells such as Dictyostelium amoebae (Diez et al, 2005). The speed problem is partly solved by the use of a spinning disc confocal microscope that excites many points simultaneously and makes faster data collection possible (Stephens and Allan, 2003). However there are still practical limitations to the process and the dynamic range of the recorded signals is typically small for fast data collection times, which generally require highly sensitive camera system that greatly amplify the signals recorded, resulting in considerable noise (Kindzelskii and Petty, 2003).
Finally, all these imaging experiments generally result in the acquisition of large quantities of 3D image stacks from many successive time points and thus generate large data sets that need to be properly annotated, analysed and stored, and there are still many challenges that need to be met before these problems are solved (Swedlow et al, 2003; Goldberg et al, 2005).
To illustrate how some of these techniques have been used to investigate the mechanism and role of cell movement in development, we will describe now the control of chemotactic cell movement in Dictyostelium and the analysis of cell movement during gastrulation in vertebrate embryos.
Imaging chemotaxis
One of the major questions in understanding cell movement is how external signals modulate the cytoskeletal machinery to result in translocation and movement. One of the mechanisms that cells use to move in a particular direction is to respond to gradients of chemicals, which they can detect through cell surface receptors. If the movement involves direction sensing followed by directed migration up or down the chemical gradient, this process is known as chemotaxis (Affolter and Weijer, 2005). Extracellular signals are detected by membrane receptors that have an extracellular ligand binding domain and an intracellular domain that is involved in signal transduction to signalling pathways that locally modulate the cytoskeleton to result in directed motion.
Chemotaxis in Dictyostelium
One of the experimental model systems that is used extensively to study chemotactic cell movement through the use of a variety of imaging techniques is the social amoebae D. discoideum (Weijer, 2004). Dictyostelium cells live as single amoebae in the soil and multiply through binary fission. Starvation triggers a developmental cycle in which hundreds of amoebae aggregate to form a multicellular structure, the slug that migrates away guided by environmental signals such as light and temperature gradients, which direct its migration to the surface of the soil. There the slug transforms into a fruiting body, consisting of a stalk supporting a mass of spores. Eighty percent of the cells differentiate into spores, while the remainder of the cells die and form the stalk (Figure 1A). The chemotactic aggregation process is known to result from chemotactic movement in the direction of cAMP waves initiated by the aggregation centre and relayed by surrounding cells outward. These waves trigger the inward movement of the amoebae during the rising phase of the waves, resulting in movement towards the aggregation centre (Weijer, 2004). Due to an adaptation process, the amoebae are insensitive to falling levels of cAMP, this prevents them from turning around and chasing the waves, once they pass, instead the cells wait for the next wave to come to guide them a little closer towards the aggregation centre. During movement cells are more polarised and exhibit a slightly elongated shape, in between waves, when they are not moving the cells appear more amoeboid in shape (Figure 1B; Supplementary Movie 1). This change in cell morphology can be detected at the macroscopic level by measuring small angle light scattering in monolayers of aggregating cells on an agar plate (Figure 1D, Supplementary Movie 2; Siegert and Weijer, 1989). The light-scattering changes are small but the differences can be made better visible by a rolling subtraction of successive images that amplifies the differences between the different time frames, and thus sensitively detects movement of the wave front (Figure 1E; Supplementary Movie 2; Sawai et al, 2005). The propagating waves are thus visible as alternating bands of moving and nonmoving cells. It has been shown by isotope dilution fluorography and a temperature-sensitive adenylylcyclase mutant that these optical density waves accurately reflect the dynamics of the underlying cAMP signalling (Devreotes et al, 1983; Patel et al, 2000). These waves can be even detected when the cells start to aggregate into aggregation streams (Figure 1F and 1G; Supplementary Movie 3).
Figure 1.
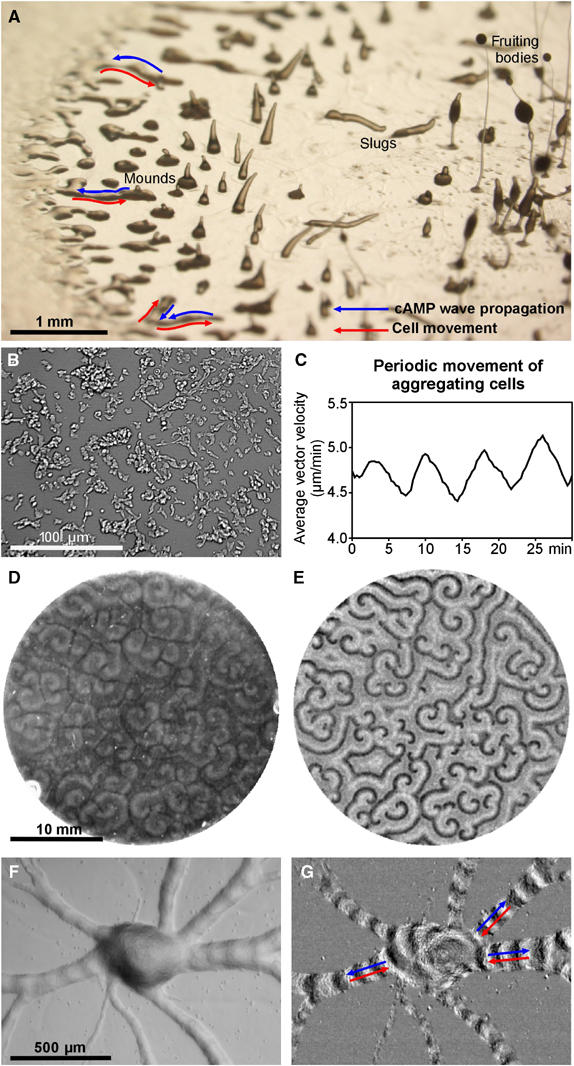
Cell movement and cAMP wave propagation in aggregating Dictyostelium cells. (A) View of a Dictyostelium colony growing on a bacterial agar plate. Cells at the left are vegetative and feeding on bacteria, behind the feeding front the cells start to aggregate in aggregation streams. In the middle the aggregates develop into mounds and standing slugs and towards the right there are a few fruiting bodies, consisting of a stalk that supports a mass of spores. Blue arrows indicate the direction of wave propagation, while red arrows indicate the direction of cell movement. (B) Dictyostelium cells aggregating on a coverslip submerged in phosphate buffer 5 h after the onset of starvation. Cells communicate by propagating cAMP waves that cause the coordinated chemotactic response of cells towards the cAMP source. (C) Measuring the optical flow over the entire image and calculating the average vector velocity reveals the periodic movement of the cells in response to cAMP waves. (D) Dictyostelium cells that have been plated in a monolayer on agar show the characteristic macroscopic dark field waves that correspond to the relayed cAMP waves. (E) Subtraction of subsequent images highlights the differences between the images and enhances the visibility of the rapidly moving dark field waves. Same field of view as in (D). (F) Cells continue to move towards the aggregations centres/mounds in long streams. (G) Image subtraction shows again the propagated wave fronts that move away from the centre while the cells move in the opposite direction (see Supplementary Movies 1, 2 and 3).
Much attention has focussed on the mechanism of cAMP signal detection, which results in polarisation of the cells, localised activation of the actin myosin cytoskeleton and directed movement up the cAMP gradient (Manahan et al, 2004; Parent, 2004; Van Haastert and Devreotes, 2004). We will now describe some of the imaging methods used to investigate chemotactic signalling pathways controlling the localised activity of the actin–myosin cytoskeleton to result in motion up cAMP gradients. cAMP is detected by seven transmembrane serpentine receptors. Sensing of a cAMP gradient by a moving cell results in localised PIP3 production, actin polymerisation and disassembly of myosin thick filaments at the leading edge, while the contraction in the back of the cell requires myosin thick filament assembly and motor activation (Figure 2A). Through monitoring the dynamics of GFP tagged cAMP receptors, it was shown that the receptors are homogenously distributed in the membrane of cells chemotaxing in gradient of cAMP (Xiao et al, 1997). TIRF based single molecule analysis of fluorescent cAMP molecules has been used to measure the spatiotemporal dynamics of cAMP binding to the cAMP receptors (Ueda et al, 2001). Individual cAMP molecules stay bound only for a few seconds before dissociating again. cAMP molecules associate/dissociate faster in the front than in the back of the moving cells, which has been shown to reflect differences in coupling of the cAMP receptor to hetero-trimeric G proteins in the front and the back of the cell (Ueda et al, 2001). Binding of cAMP to the receptors triggers the activation of hetero-trimeric G proteins which dissociate into a GTP bound Gα subunit and a Gβγ complex. FRET measurements between GFP tagged Gα and Gβ subunits have shown that the Gα and Gβγ subunits stay dissociated as long as the receptor is stimulated (Janetopoulos and Devreotes, 2002) and that the gradient of cAMP is translated into a proportional gradient of G protein activation around the cell (Xu et al, 2005). The membrane bound Gβγ complex activates RasC, which also follows the gradient of activated cAMP receptors (Sasaki et al, 2004). Activated rasC in turn binds and activates PI3 kinase, which results in localised PIP3 production at the leading edge of the cell (Figure 2A and B). PIP3 production shows both amplification and adaptation (Janetopoulos et al, 2004). PTEN, a PIP3 phosphatase, which is membrane associated in unstimulated cells, dissociates from the membrane at the leading edge of the cell but stays membrane associated in the rear of the cell (Figure 2C). Single molecule measurements have shown that binding of CRAC (cytosolic regulator of adenylylcyclase) to PIP3 is highly dynamic (100 ms) and it accurately reflects the PIP3 levels (Matsuoka et al, 2006). Membrane binding of the PIP3 phosphatase PTEN has also been measured using single molecule imaging techniques. It has been shown that binding of PTEN to membrane binding sites of as yet unknown nature is also very dynamic. In the case of Dictyostelium PTEN, the dissociation rate is ∼300 ms, sufficient to result in a visible membrane accumulation. In the case of mammalian PTEN, the binding duration is much shorter (∼150 ms), which is not sufficient to result in visible membrane accumulation (Iijima et al, 2004; Vazquez et al, 2006).
Figure 2.
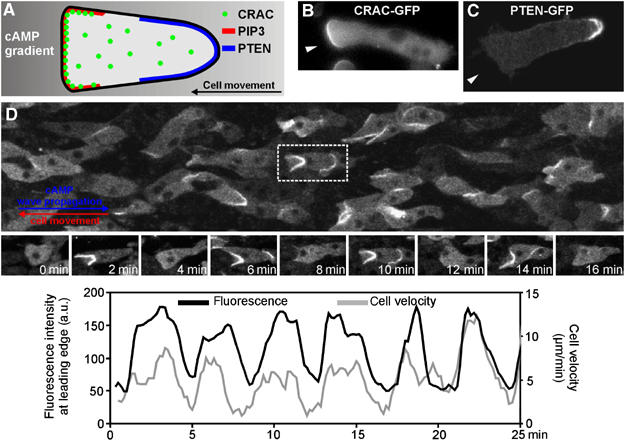
Periodic translocation of PIP3 binding PH domains to the leading edge. (A) Schematic diagram of a cell migrating from right to left in a gradient of cAMP. The process of signal detection involves binding of cAMP to cell surface receptors, reflecting the gradient in cAMP. This results in localised PIP3 production in the leading edge (red), which acts as a docking site for PIP3 specific PH domain containing proteins such as CRAC (green). The PIP3 gradient is the result of the translocation of PI3 kinase to the front and dissociation of the PIP3 3-phosphatase PTEN (blue) from the front, while remaining membrane bound in the back where it degrades PIP3. (B) Cell moving chemotactically in a cAMP gradient from right to left showing the binding of GFP tagged CRAC to the front of the cell. (C) Cell moving chemotactically in a cAMP gradient from right to left showing the binding of GFP tagged PTEN to the plasma membrane in the rear of the cell. (D) Cells moving in an aggregation stream. Cell express the PIP3 binding PH domain of CRAC fused to GFP, which translocates to the leading edge in response to the external cAMP waves. The red arrow shows the direction of cell movement and the blue arrow shows the direction of signal propagation. Snapshots of the highlighted cell taken at 2-min intervals show the changes in membrane translocation of CRAC-GFP and cell shape as cAMP waves sweep across the cells in the aggregation stream. The graphs show the fluorescence changes at the leading edge (measured in a 10 × 10 pixel window at the anterior plasma membrane), indicating the periodic production of PIP3 at this site which also correlates with the changes in cell velocity (see Supplementary Movie 4).
Localised PIP3 production at the leading edge of the cells results in localised activation of downstream signalling pathways, which involve activation of Rac which—through the activation of the Wasp and Scar/Wave complexes—ultimately results in actin polymerisation (Blagg et al, 2003; Blagg and Insall, 2004; Ibarra et al, 2005). De novo actin polymerisation is required for further accumulation of PI3 kinase at the leading edge of the cell and further amplification of PIP3 production at the leading edge of the cell (Sasaki et al, 2004). Analysis of the cytoskeleton in moving cells has shown that actin polymerisation is highly dynamic. Using TIRF microscopy it can be seen that actin filaments are generated and remodelled everywhere in the cell, not only at the leading edge (Bretschneider et al, 2004; Diez et al, 2005). Furthermore, experiments that investigate the dynamics of actin polymerisation after recovery from latrunculin treatment show that the kinetics of actin polymerisation behaves as an excitable system and often results in the formation of actin polymerisation wave fronts (Gerisch et al, 2004). These waves arise from random centres in the cell and propagate along existing and forming filaments. Wave speeds recorded are in the order of 0.5 μm/s and there is evidence that the propagation of the waves may depend on Myosin I activity. It is thought that this highly dynamic organisation of the actin cytoskeleton is required for a rapid response to changing extracellular information; furthermore, it is hypothesised that the propagating actin waves in particular could prime the system for a fast chemotactic response (Diez et al, 2005).
There have been extensive studies in which cell behaviour has been studied in natural waves of cAMP, revealing highly complex behavioural changes. During their migration up the chemotactic gradient cells stick out pseudopodia and filopodia that point up the gradient (Heid et al, 2005). These responses are modulated by internal cAMP concentrations through the activation of cAMP-dependent protein kinase (Zhang et al, 2003; Stepanovic et al, 2005).
Cell movement during multicellular development
It is becoming apparent that all stages of the Dictyostelium life cycle are controlled by chemotaxis of individual cells to propagating waves of cAMP. These optical density waves can also be visualised by measuring the translocation of the PH domain containing protein CRAC, which is required for activation of the aggregation stage adenylylcyclase (Insall et al, 1994). At the population level, it can be seen that CRAC translocates to the leading edges of the cells in response to the cAMP waves and that this results in propagation of waves of CRAC-GFP translocation, thus providing a readout for the cAMP signalling system at the single cell level (Figure 2D; Supplementary Movie 4; Dormann et al, 2002a, 2002b, 2004).
Once the cells have aggregated the aggregates become hemispherical and the cells start to differentiate into the precursors of the stalk and spore cells. This is characterised by cell type specific gene expression, which can be followed by expression of different GFPs under the control of cell type specific promoters. The prestalk cells now sort out from the prespore cells through more efficient chemotaxis, resulting in them accumulating towards the tip of the mound. Since Dictyostelium cells move fast (up to 20 μm or two times their own length/minute), it is necessary to take images frequently and we normally take image stacks every 5 or 10 s. These are normally viewed form the side, which allows us to plot the trajectories of the sorting cells (Figure 3; Supplementary Movie 5).
Figure 3.
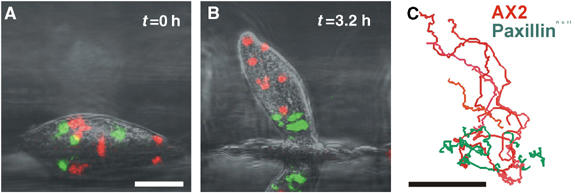
Cell sorting during slug formation. (A) Side view of a mound of wild-type cells containing a small number of fluorescently labelled wild-type cells (red) and fluorescently labelled PaxBnull cells. Scale bar: 50 μm. (B) As the mound transforms into a slug, the dispersed paxBnull cells are restricted to the posterior of the forming slug. (C) The corresponding cell traces of paxBnull cells (green, n=7 cells) and Ax2 cells (red, n=7) indicate reduced motility and directionality of paxBnull cells during slug formation. Scale bar: 50 μm (see Supplementary Movie 5).
There is good evidence that cAMP wave propagation still controls the movement of the cells in the Dictyostelium slug. Optical density waves can be seen to propagate from the tip of the slug towards the back of the slug. Measurement of the movement of cells in the slugs has shown that this movement is periodic with a period of around 5 min (Figure 4; Supplementary Movie 6). Analysis of signalling has shown that the periodic movement is also controlled by propagating cAMP waves. PIP3 is produced in the leading edge of the cells and PTEN localises in the back of the slugs as in the earlier stages of development. This gives rise to the idea that the polarity of cell migration is still controlled by localised PIP3 signalling (Dormann et al, 2002a, 2004). In later development, the movement of the cells becomes also heavily dependent on contacts with the extracellular matrix. Deletion of molecules involved in mechano-transduction all result in defects of development, notable examples are paxillin, talin and Myosin II (Patterson and Spudich, 1996; Tsujioka et al, 2004; Bukharova et al, 2005). In the slug stage, the cells are dependent on the formation of focal adhesion-like plaques, these can be observed in great detail in TIRF microscopy where events occurring close to or at the plasma membrane are recorded especially well (Figure 5; Supplementary Movie 7). Direct observation of the actin myosin cytoskeleton shows that actin filaments are formed at the leading edge and that there is relatively little evidence for retrograde flow of actin. The myosin thick filaments are assembled in the trailing half of the cells. These filaments can be easily visualised by TIRF microscopy (Figure 5, Movies 8 and 9).
Figure 4.
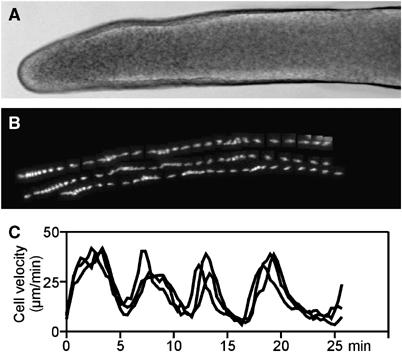
Periodic cell movement at the slug stage of development. The cAMP waves that coordinate cell movement in the slug are initiated in the slug tip (A: brightfield image of a slug) and relayed along the length of the slug causing periodic surges in cell velocity as can be seen in the tracks of the three GFP labelled cells (B) and in the corresponding velocity plots (C) (see Supplementary Movie 6).
Figure 5.
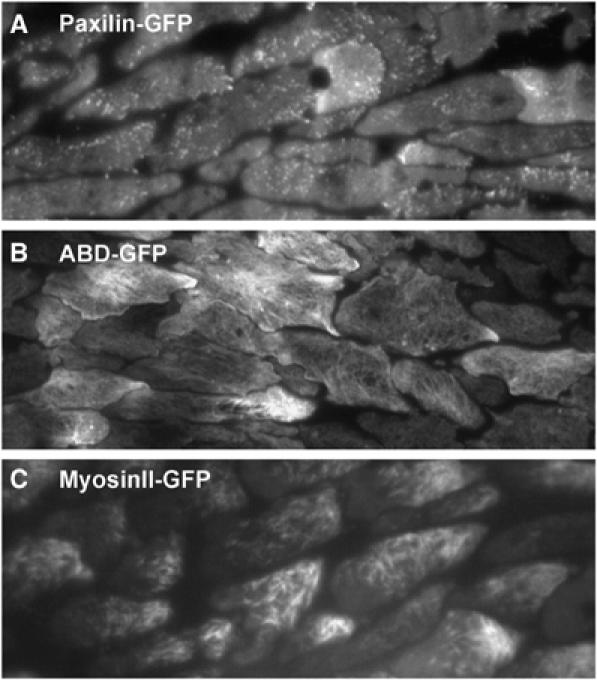
Visualising the localisation of cytoskeletal components using TIRF microscopy. (A) PaxillinGFP accumulates at focal adhesion sites that remain stationary once they have been formed. Shown is the ventral membrane of cells moving in aggregation streams under TIRF illumination (see Supplementary Movie 7). (B) Using the f-actin specific ABD-GFP, the dynamics of the actin cytoskeleton can be studied in great detail. Filamentous actin structures are clearly visible in the cortex of the slug cells (see Supplementary Movie 8). (C) MyosinII-GFP marks the cellular localisation of myosin II, which is involved in the contraction of the cell posterior through interaction with the actin cytoskeleton. As can be seen MyosinII-GFP filaments are absent from the leading edge of slug cells (see Supplementary Movie 9).
Force microscopy of chemotaxing cells
We have measured forces produced by chemotactically migrating D. amoebae (Figure 6). The advantage of Dictyostelium is that they move chemotactically and that mutants in elements of the cytoskeleton and cell substrate adhesion machinery as well as in the signalling pathways that control them are available. It appears that the most of the force is generated to control particular cell behaviours, like holding on to the substrate and detaching the back of the cell from the substrate. Furthermore, these measurements have confirmed the role of myosin II in the contraction of the back of the cells, but also show that it is involved in controlling the number of filopodia in the front of the cell (Figure 6). This type of analysis is expected to give important new insights into the biomechanics of cells movement.
Figure 6.
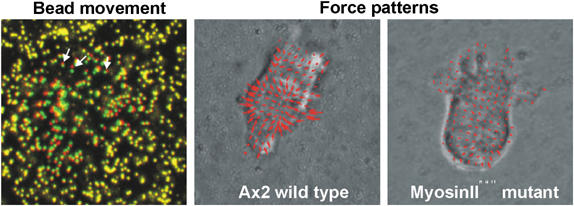
Measuring forces in migrating cells. The forces cells exert on their substrate can be deduced from the analysis of the displacement of fluorescently labelled beads that are embedded in an elastic substratum over which the cells move. Beads that have been moved by a migrating cell are indicated by the red and green colours (arrows), while stationary beads further away from the cell appear in yellow. The calculated force patterns are shown for a wild-type Ax2 cell and a MyosinIInull cell both moving in a cAMP gradient.
Other mechanical properties that have been measured using imaging are the bending stiffness of the cell cortex. In these experiments, part of a cell membrane is sucked into a capillary and measurement of the curvature of the membrane under these conditions gives an indication of the bending stiffness of the membrane and associated cytoskeleton. Experiments of this type in Dictyostelium showed the importance of talin in determining the bending stiffness (Merkel et al, 2000). In general, it is to be expected that force measurements will become more important and that several techniques that are able to measure the rheological and other mechanical properties of cells are going to be combined with imaging experiments (Dobereiner et al, 2005; Park et al, 2005; Giannone and Sheetz, 2006).
Cell movement during gastrulation
There is more and more interest in trying to investigate the movement of cells in the context of a tissue or even a whole organism. It is especially important for our understanding of development where cell movement plays a major role in all stages of development especially during gastrulation (Solnica-Krezel, 2005). Gastrulation has been investigated in great detail in frog, fish, chick and mouse embryos (Keller, 2005). We will describe here some results obtained in mapping out the movement patterns of mesoderm cells during gastrulation in the chick embryo and movement of cells in the epiblast during streak formation.
During gastrulation in the chick embryo, a structure called the primitive streak is formed in the central midline of the embryo. Cells in the epiblast move towards the primitive streak where they undergo an epithelial to mesenchymal transition, ingress into the streak and move out in the space between the hypoblast and the epiblast. Cells migrate over long distances before they re-aggregate to form distinct structures such as somites alongside the central midline and flanked by lateral plate mesoderm. By using a combination of transfection and grafting techniques, the migration patterns of the mesoderm cells leaving the primitive streak cells have been mapped out in detail (Yang et al, 2002). The tracks of the cells are visualised not by following all cells individually, which would be difficult due to extensive movement occurring in the embryo but by successive superposition of the images, giving rise to the formation of individual cell tracks (Figure 7; Supplementary Movie 10). We have shown that cells from the anterior streak initially migrate outward, and when the regression of the node begins and the node has regressed past them, they migrate back towards the midline where they form somites. Cells migrating out from the middle streak show a very similar migration pattern, initially they migrate out and then they migrate back in towards the midline but stay more lateral position and form lateral plate mesoderm. Cells in the posterior streak migrate out and form extra-embryonic mesoderm and haematopoietic cells that form blood islands and blood vessels. These data show that the movement of many cells can be visualised. In this case, cell tracks are generated by segmentation and logical addition of this information in the overlay of the image. We have proposed that some of the migration patterns result from chemo-repulsion (migration out of the streak) and chemo-attraction, the movement of the mesoderm cells back in towards the central midline in response to growth factors of the FGF and VEGF family (Yang et al, 2002). The mechanisms underlying signal detection and polarised activation of the cytoskeleton are still unknown. It has recently been proposed based on the analysis of movement of cells in tissue culture that local detection of a signal could result in a local extension of a cell process that then results in altering the cells migration trajectory, and that there is no need for a large-scale integration of the signals (Arrieumerlou and Meyer, 2005).
Figure 7.
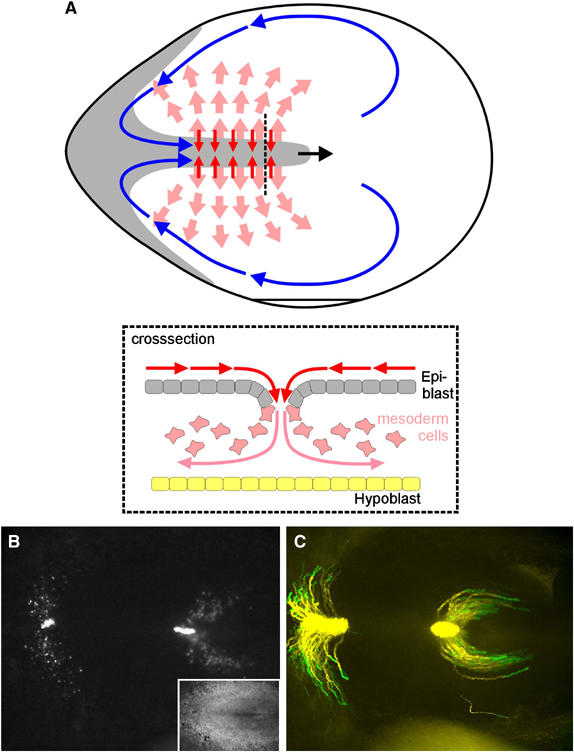
Migration of mesoderm cells in a HH4 chick embryo. (A) Schematic diagram of a chick embryo. Cells in the epiblast migrate (red arrows) to the forming primitive streak. There they undergo an epithelial to mesenchymal transition and move (roza arrows) in the space between the epiblast and hypoblast (insert), where they migrate over large distances to form mesodermal structures such as somites, lateral plate mesoderm and blood islands. The streak itself forms from the posterior end of the embryo towards anterior, involving two counter rotating cell flows of cells in the epiblast that merge at the site of streak formation and indicated schematically by the blue arrows (see Figure 8 for experimental data). (B) GFP expressing cells that have migrated from a graft in the posterior and middle primitive streak, inset with corresponding brightfield image of the same chick embryo. The tip of the primitive streak points to the right. (C) Cell tracks of the cells shown in (A) over a 6-h period, the last 2 h of migration are shown in green (see Supplementary Movie 10).
Formation of the primitive streak
Many movements occurring during embryogenesis involve deformations of epithelial cell sheets. Formation of the primitive streak in the chick embryo is one such process that can be readily observed in time lapse bright field images. Using a modification of an optical flow technique, it is possible to reconstruct the cell flow patterns in the epiblast of the embryo quantitatively (Figure 8; Cui et al, 2005). It can be seen that the cells in the epiblast move in highly regular coherent rotational flow patterns that merge at the side of streak formation. The flows bring the mesoderm cells that differentiate at the boundary between the area opaca and area pellucida into the central midline of the embryo, where they will form the primitive streak. Through transfection of hundreds of individual cells in the epiblast with GFP, it is possible to follow their displacements in time by calculating their movement trajectories (Figure 8). All cells follow the highly streamlined flow patterns, the mechanistic basis of which is still unknown. These measurements nicely confirm the flow patterns deduced from the flow analysis. The mechanism by which the cells move is so far also not known and it is to be expected that they move on a basal membrane, which they themselves secrete, possibly involving chemo-attraction and chemo-repulsion, something which has to be confirmed by high magnification imaging of the behaviour of individual cells in the sheet.
Figure 8.
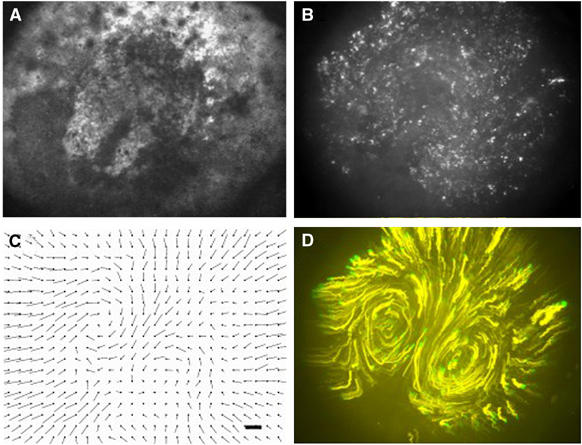
Movement of tissue in the epiblast of a prestalk chick embryo. (A) Bright field image of an HH1 stage chick embryo, with a streak extending halfway over the epiblast. (B) The same embryo as shown in (A) (9 h after transfection with GFP), every white dot is a singe cell in the epiblast. (C) Vector velocity field calculated from a brightfield sequence as shown in (A), the marker bar indicates a velocity of 1 μm/min. (D) Traces of the fluorescent cells shown in (B), the traces were calculated over a time period of 6 h, the cell migrate in the direction yellow to green, the green track shows migration over the last hour (see Supplementary Movie 11).
Data analysis
These specific examples show some of the questions regarding the control of cell movement of individual cells that are being investigated with imaging techniques. There has been a considerable effort in the development of techniques to track cells in space and time. Most of these techniques use simple segmentation algorithms and define areas of interest that shift with the movement of the cell. These methods work well provided that there is high enough contrast in the images and that the data sampling rate is such that the cells do not move out of the area of interest between data points (Rietdorf et al, 1996; Dormann et al, 2002b). More sophisticated approaches that have been used to follow the movement of cells involve adaptive chain algorithms, which can follow the cells outline and provide quantitative information to link changes in cell shape with translocation of fluorescent proteins (Dormann et al, 2002a). In the future, these methods can be expanded to work as adaptive volumes in which it will be possible to follow the 3D shape changes by cells and correlate their behaviour with changes in the underlying biochemistry as detected by changes in fluorescence of GFP tagged proteins. One of the main difficulties in tracing cells is that they often merge and then separate again and it is still relatively difficult to follow these cells automatically in 3D. This will require computer vision techniques, where cells are described by a mathematical model taking into account parameters such a shape, characteristic change in shape, size velocity, texture followed by a learning process where cells are identified and then followed over time.
Another completely different approach to measure the flow of information in a stack of images is not to try to recognise objects in the image, but simply follow the flow of information in the system under the assumption that the same is essentially invariant during the time interval of two successive frames as shown above for the flow of cells during formation of the primitive streak. There are many methods available as discussed in (Miura, 2005). The temporal local optimisation method (TLO) has been used successfully to measure the dynamics of tissue flows in the epiblast of the developing chick embryo during streak formation (Figure 8) (Cui et al, 2005). It has also successfully been used to measure tissue flows in migrating slugs of D. discoideum (Abe et al, 1994; Siegert et al, 1994; Dormann et al, 1997). This technique can readily be extended in 3D and should prove useful in characterising dynamics of movement in complex images.
Outlook and promise
Cell movement is a process that requires detailed understanding of the spatio-temporal control of the underlying chemistry ultimately leading to the local activation of the cytoskeleton. At the moment, the majority of studies are still concerned with the investigation of cell behaviour of individual cells and much progress is being made to uncover the role of all components from the receptors that receive the signals to downstream signalling reactions to the dynamics of individual cytoskeletal components. The methods being used are widefield microscopy often combined with deconvolution techniques and confocal microscopy. These techniques are being used to look at changes in localisation of proteins and can even be used in large-scale genomic screens to define the behaviour of for instance all PH domain containing proteins. The use of FRET techniques and fluorescence correlation spectroscopy to measure protein–protein interactions will become more prevalent. Photo-activatable fluorescent proteins should become widely used to investigate the flow of molecules in moving cells and certainly will be a useful expansion of the already widely used FRAP (FRAP technique). These measurements are complemented by more specialised techniques such as TIRF, which in the extreme case allows the measurement of the dynamics of single molecules of receptors on the surface and the inside of the cell membrane. It is to be expected that these measurements will become more important as new probes are developed.
The challenge will be in the future to see whether these techniques can be used to measure the dynamics of reactions underlying cell movement in the context of whole organisms such as embryos. This is an area where confocal and deconvolution microscopes have been used extensively so far, but techniques like SPIM could become very important.
Supplementary Material
Supplementary Movie 1
Supplementary Movie 2
Supplementary Movie 3
Supplementary Movie 4
Supplementary Movie 5
Supplementary Movie 6
Supplementary Movie 7
Supplementary Movie 8
Supplementary Movie 9
Supplementary Movie 10
Supplementary Movie 11
Legends to Supplementary Movies
Acknowledgments
We thank Dr Xuesong Yang for the data in Figure 7, Dr Manli Chuai for the data provided in Figure 8. We thank the Wellcome Trust, BBSRC and Royal Society for Financial support.
References
- Abe T, Early A, Siegert F, Weijer C, Williams J (1994) Patterns of cell movement within the Dictyostelium slug revealed by cell type-specific, surface labeling of living cells. Cell 77: 687–699 [DOI] [PubMed] [Google Scholar]
- Adams SR, Campbell RE, Gross LA, Martin BR, Walkup GK, Yao Y, Llopis J, Tsien RY (2002) New biarsenical ligands and tetracysteine motifs for protein labeling in vitro and in vivo: synthesis and biological applications. J Am Chem Soc 124: 6063–6076 [DOI] [PubMed] [Google Scholar]
- Affolter M, Weijer CJ (2005) Signaling to cytoskeletal dynamics during chemotaxis. Dev Cell 9: 19–34 [DOI] [PubMed] [Google Scholar]
- Arai Y, Iwane AH, Wazawa T, Yokota H, Ishii Y, Kataoka T, Yanagida T (2006) Dynamic polymorphism of Ras observed by single molecule FRET is the basis for molecular recognition. Biochem Biophys Res Commun 343: 809–815 [DOI] [PubMed] [Google Scholar]
- Arrieumerlou C, Meyer T (2005) A local coupling model and compass parameter for eukaryotic chemotaxis. Dev Cell 8: 215–227 [DOI] [PubMed] [Google Scholar]
- Bacia K, Kim SA, Schwille P (2006) Fluorescence cross-correlation spectroscopy in living cells. Nat Methods 3: 83–89 [DOI] [PubMed] [Google Scholar]
- Baumeister W (2005) From proteomic inventory to architecture. FEBS Lett 579: 933–937 [DOI] [PubMed] [Google Scholar]
- Blagg SL, Insall RH (2004) Control of SCAR activity in Dictyostelium discoideum. Biochem Soc Trans 32: 1113–1114 [DOI] [PubMed] [Google Scholar]
- Blagg SL, Stewart M, Sambles C, Insall RH (2003) PIR121 regulates pseudopod dynamics and SCAR activity in Dictyostelium. Curr Biol 13: 1480–1487 [DOI] [PubMed] [Google Scholar]
- Bretschneider T, Diez S, Anderson K, Heuser J, Clarke M, Muller-Taubenberger A, Kohler J, Gerisch G (2004) Dynamic actin patterns and Arp2/3 assembly at the substrate-attached surface of motile cells. Curr Biol 14: 1–10 [DOI] [PubMed] [Google Scholar]
- Bukharova T, Weijer G, Bosgraaf L, Dormann D, van Haastert PJ, Weijer CJ (2005) Paxillin is required for cell–substrate adhesion, cell sorting and slug migration during Dictyostelium development. J Cell Sci 118: 4295–4310 [DOI] [PubMed] [Google Scholar]
- Chudakov DM, Lukyanov S, Lukyanov KA (2005) Fluorescent proteins as a toolkit for in vivo imaging. Trends Biotechnol 23: 605–613 [DOI] [PubMed] [Google Scholar]
- Cox G, Kable E (2006) Second-harmonic imaging of collagen. Methods Mol Biol 319: 15–35 [DOI] [PubMed] [Google Scholar]
- Cui C, Yang X, Chuai M, Glazier JA, Weijer CJ (2005) Analysis of tissue flow patterns during primitive streak formation in the chick embryo. Dev Biol 284: 37–47 [DOI] [PubMed] [Google Scholar]
- Dembo M, Wang YL (1999) Stresses at the cell-to-substrate interface during locomotion of fibroblasts. Biophys J 76: 2307–2316 [DOI] [PMC free article] [PubMed] [Google Scholar]
- Denk W, Horstmann H (2004) Serial block-face scanning electron microscopy to reconstruct three-dimensional tissue nanostructure. PLoS Biol 2: e329. [DOI] [PMC free article] [PubMed] [Google Scholar]
- Devreotes PN, Potel MJ, MacKay SA (1983) Quantitative analysis of cyclic AMP waves mediating aggregation in Dictyostelium discoideum. Dev Biol 96: 405–415 [DOI] [PubMed] [Google Scholar]
- Diao J, Young L, Kim S, Fogarty EA, Heilman SM, Zhou P, Shuler ML, Wu M, DeLisa MP (2006) A three-channel microfluidic device for generating static linear gradients and its application to the quantitative analysis of bacterial chemotaxis. Lab Chip 6: 381–388 [DOI] [PubMed] [Google Scholar]
- Diez S, Gerisch G, Anderson K, Muller-Taubenberger A, Bretschneider T (2005) Subsecond reorganization of the actin network in cell motility and chemotaxis. Proc Natl Acad Sci USA 102: 7601–7606 [DOI] [PMC free article] [PubMed] [Google Scholar]
- Dobereiner H-G, Dubin-Thaler BJ, Giannone G, Sheetz MP (2005) Force sensing and generation in cell phases: analyses of complex functions 10.1152/japplphysiol.01181.2004. J Appl Physiol 98: 1542–1546 [DOI] [PubMed] [Google Scholar]
- Dormann D, Libotte T, Weijer CJ, Bretschneider T (2002a) Simultaneous quantification of cell motility and protein-membrane-association using active contours. Cell Motil Cytoskeleton 52: 221–230 [DOI] [PubMed] [Google Scholar]
- Dormann D, Weijer C, Siegert F (1997) Twisted scroll waves organize Dictyostelium mucoroides slugs. J Cell Sci 110: 1831–1837 [DOI] [PubMed] [Google Scholar]
- Dormann D, Weijer G, Dowler S, Weijer CJ (2004) In vivo analysis of 3-phosphoinositide dynamics during Dictyostelium phagocytosis and chemotaxis. J Cell Sci 117: 6497–6509 [DOI] [PubMed] [Google Scholar]
- Dormann D, Weijer G, Parent CA, Devreotes PN, Weijer CJ (2002b) Visualizing PI3 kinase-mediated cell–cell signaling during Dictyostelium development. Curr Biol 12: 1178–1188 [DOI] [PubMed] [Google Scholar]
- du Roure O, Saez A, Buguin A, Austin RH, Chavrier P, Silberzan P, Ladoux B (2005) Force mapping in epithelial cell migration. Proc Natl Acad Sci USA 102: 2390–2395 [DOI] [PMC free article] [PubMed] [Google Scholar]
- Fache S, Dalous J, Engelund M, Hansen C, Chamaraux F, Fourcade B, Satre M, Devreotes P, Bruckert F (2005) Calcium mobilization stimulates Dictyostelium discoideum shear-flow-induced cell motility. J Cell Sci 118: 3445–3457 [DOI] [PubMed] [Google Scholar]
- Gerisch G, Bretschneider T, Muller-Taubenberger A, Simmeth E, Ecke M, Diez S, Anderson K (2004) Mobile actin clusters and traveling waves in cells recovering from actin depolymerization. Biophys J 87: 3493–3503 [DOI] [PMC free article] [PubMed] [Google Scholar]
- Gerisch G, Muller-Taubenberger A (2003) GFP-fusion proteins as fluorescent reporters to study organelle and cytoskeleton dynamics in chemotaxis and phagocytosis. Methods Enzymol 361: 320–337 [DOI] [PubMed] [Google Scholar]
- Giannone G, Sheetz MP (2006) Substrate rigidity and force define form through tyrosine phosphatase and kinase pathways. Trends Cell Biol 16: 213–223 [DOI] [PubMed] [Google Scholar]
- Giepmans BN, Adams SR, Ellisman MH, Tsien RY (2006) The fluorescent toolbox for assessing protein location and function. Science 312: 217–224 [DOI] [PubMed] [Google Scholar]
- Gilman AG, Simon MI, Bourne HR, Harris BA, Long R, Ross EM, Stull JT, Taussig R, Arkin AP, Cobb MH, Cyster JG, Devreotes PN, Ferrell JE, Fruman D, Gold M, Weiss A, Berridge MJ, Cantley LC, Catterall WA, Coughlin SR, Olson EN, Smith TF, Brugge JS, Botstein D, Dixon JE, Hunter T, Lefkowitz RJ, Pawson AJ, Sternberg PW, Varmus H, Subramaniam S, Sinkovits RS, Li J, Mock D, Ning Y, Saunders B, Sternweis PC, Hilgemann D, Scheuermann RH, DeCamp D, Hsueh R, Lin KM, Ni Y, Seaman WE, Simpson PC, O'Connell TD, Roach T, Choi S, Eversole-Cire P, Fraser I, Mumby MC, Zhao Y, Brekken D, Shu H, Meyer T, Chandy G, Heo WD, Liou J, O'Rourke N, Verghese M, Mumby SM, Han H, Brown HA, Forrester JS, Ivanova P, Milne SB, Casey PJ, Harden TK, Doyle J, Gray ML, Michnick S, Schmidt MA, Toner M, Tsien RY, Natarajan M, Ranganathan R, Sambrano GR (2002) Overview of the alliance for cellular signaling. Nature 420: 703–706 [DOI] [PubMed] [Google Scholar]
- Goldberg IG, Allan C, Burel JM, Creager D, Falconi A, Hochheiser H, Johnston J, Mellen J, Sorger PK, Swedlow JR (2005) The open microscopy environment (OME) data model and XML file: open tools for informatics and quantitative analysis in biological imaging. Genome Biol 6: R47. [DOI] [PMC free article] [PubMed] [Google Scholar]
- Green KJ, Bohringer M, Gocken T, Jones JC (2005) Intermediate filament associated proteins. Adv Protein Chem 70: 143–202 [DOI] [PubMed] [Google Scholar]
- Gurskaya NG, Verkhusha VV, Shcheglov AS, Staroverov DB, Chepurnykh TV, Fradkov AF, Lukyanov S, Lukyanov KA (2006) Engineering of a monomeric green-to-red photoactivatable fluorescent protein induced by blue light. Nat Biotechnol 24: 461–465 [DOI] [PubMed] [Google Scholar]
- Habuchi S, Ando R, Dedecker P, Verheijen W, Mizuno H, Miyawaki A, Hofkens J (2005) Reversible single-molecule photoswitching in the GFP-like fluorescent protein Dronpa. Proc Natl Acad Sci USA 102: 9511–9516 [DOI] [PMC free article] [PubMed] [Google Scholar]
- Harpur AG, Wouters FS, Bastiaens PI (2001) Imaging FRET between spectrally similar GFP molecules in single cells. Nat Biotechnol 19: 167–169 [DOI] [PubMed] [Google Scholar]
- Heid PJ, Geiger J, Wessels D, Voss E, Soll DR (2005) Computer-assisted analysis of filopod formation and the role of myosin II heavy chain phosphorylation in Dictyostelium. J Cell Sci 118: 2225–2237 [DOI] [PubMed] [Google Scholar]
- Helmchen F, Denk W (2002) New developments in multiphoton microscopy. Curr Opin Neurobiol 12: 593–601 [DOI] [PubMed] [Google Scholar]
- Helmchen F, Denk W (2005) Deep tissue two-photon microscopy. Nat Methods 2: 932–940 [DOI] [PubMed] [Google Scholar]
- Hotulainen P, Lappalainen P (2006) Stress fibers are generated by two distinct actin assembly mechanisms in motile cells. J Cell Biol 173: 383–394 [DOI] [PMC free article] [PubMed] [Google Scholar]
- Huisken J, Swoger J, Del Bene F, Wittbrodt J, Stelzer EH (2004) Optical sectioning deep inside live embryos by selective plane illumination microscopy. Science 305: 1007–1009 [DOI] [PubMed] [Google Scholar]
- Hynes RO (2002) Integrins: bidirectional, allosteric signaling machines. Cell 110: 673–687 [DOI] [PubMed] [Google Scholar]
- Ibarra N, Pollitt A, Insall RH (2005) Regulation of actin assembly by SCAR/WAVE proteins. Biochem Soc Trans 33: 1243–1246 [DOI] [PubMed] [Google Scholar]
- Iijima M, Huang YE, Luo HR, Vazquez F, Devreotes PN (2004) Novel mechanism of PTEN regulation by its phosphatidylinositol 4,5-bisphosphate binding motif is critical for chemotaxis. J Biol Chem 279: 16606–16613 [DOI] [PubMed] [Google Scholar]
- Insall R, Kuspa A, Lilly PJ, Shaulsky G, Levin LR, Loomis WF, Devreotes P (1994) CRAC, a cytosolic protein containing a pleckstrin homology domain, is required for receptor and G protein-mediated activation of adenylyl cyclase in Dictyostelium. J Cell Biol 126: 1537–1545 [DOI] [PMC free article] [PubMed] [Google Scholar]
- Janetopoulos C, Devreotes P (2002) Monitoring receptor-mediated activation of heterotrimeric G-proteins by fluorescence resonance energy transfer. Methods 27: 366–373 [DOI] [PubMed] [Google Scholar]
- Janetopoulos C, Ma L, Devreotes PN, Iglesias PA (2004) Chemoattractant-induced phosphatidylinositol 3,4,5-trisphosphate accumulation is spatially amplified and adapts, independent of the actin cytoskeleton. Proc Natl Acad Sci USA 101: 8951–8956 [DOI] [PMC free article] [PubMed] [Google Scholar]
- Jurado C, Haserick JR, Lee J (2005) Slipping or gripping? Fluorescent speckle microscopy in fish keratocytes reveals two different mechanisms for generating a retrograde flow of actin. Mol Biol Cell 16: 507–518 [DOI] [PMC free article] [PubMed] [Google Scholar]
- Keller PJ, Pampaloni F, Stelzer EH (2006) Life sciences require the third dimension. Curr Opin Cell Biol 18: 117–124 [DOI] [PubMed] [Google Scholar]
- Keller R (2005) Cell migration during gastrulation. Curr Opin Cell Biol 17: 533–541 [DOI] [PubMed] [Google Scholar]
- Kindzelskii AL, Petty HR (2003) Intracellular calcium waves accompany neutrophil polarization, formylmethionylleucylphenylalanine stimulation, and phagocytosis: a high speed microscopy study. J Immunol 170: 64–72 [DOI] [PubMed] [Google Scholar]
- Kumar S, Maxwell IZ, Heisterkamp A, Polte TR, Lele TP, Salanga M, Mazur E, Ingber DE (2006) Viscoelastic retraction of single living stress fibers and its impact on cell shape, cytoskeletal organization, and extracellular matrix mechanics. Biophys J 90: 3762–3773 [DOI] [PMC free article] [PubMed] [Google Scholar]
- Kurokawa K, Mochizuki N, Ohba Y, Mizuno H, Miyawaki A, Matsuda M (2001) A pair of fluorescent resonance energy transfer-based probes for tyrosine phosphorylation of the CrkII adaptor protein in vivo. J Biol Chem 276: 31305–31310 [DOI] [PubMed] [Google Scholar]
- Langridge PD, Kay RR (2006) Blebbing of Dictyostelium cells in response to chemoattractant. Exp Cell Res 312: 2009–2017 [DOI] [PubMed] [Google Scholar]
- Laurent VM, Kasas S, Yersin A, Schaffer TE, Catsicas S, Dietler G, Verkhovsky AB, Meister JJ (2005) Gradient of rigidity in the lamellipodia of migrating cells revealed by atomic force microscopy. Biophys J 89: 667–675 [DOI] [PMC free article] [PubMed] [Google Scholar]
- Lorenz M, Yamaguchi H, Wang Y, Singer RH, Condeelis J (2004) Imaging sites of N-wasp activity in lamellipodia and invadopodia of carcinoma cells. Curr Biol 14: 697–703 [DOI] [PubMed] [Google Scholar]
- Manahan CL, Iglesias PA, Long Y, Devreotes PN (2004) Chemoattractant signaling in Dictyostelium discoideum. Annu Rev Cell Dev Biol 20: 223–253 [DOI] [PubMed] [Google Scholar]
- Martin BR, Giepmans BN, Adams SR, Tsien RY (2005) Mammalian cell-based optimization of the biarsenical-binding tetracysteine motif for improved fluorescence and affinity. Nat Biotechnol 23: 1308–1314 [DOI] [PubMed] [Google Scholar]
- Matsuoka S, Iijima M, Watanabe TM, Kuwayama H, Yanagida T, Devreotes PN, Ueda M (2006) Single-molecule analysis of chemoattractant-stimulated membrane recruitment of a PH-domain-containing protein. J Cell Sci 119: 1071–1079 [DOI] [PubMed] [Google Scholar]
- Mejillano MR, Kojima S, Applewhite DA, Gertler FB, Svitkina TM, Borisy GG (2004) Lamellipodial versus filopodial mode of the actin nanomachinery: pivotal role of the filament barbed end. Cell 118: 363–373 [DOI] [PubMed] [Google Scholar]
- Merkel R, Simson R, Simson DA, Hohenadl M, Boulbitch A, Wallraff E, Sackmann E (2000) A micromechanic study of cell polarity and plasma membrane cell body coupling in Dictyostelium. Biophys J 79: 707–719 [DOI] [PMC free article] [PubMed] [Google Scholar]
- Meyer BH, Martinez KL, Segura JM, Pascoal P, Hovius R, George N, Johnsson K, Vogel H (2006) Covalent labeling of cell-surface proteins for in-vivo FRET studies. FEBS Lett 580: 1654–1658 [DOI] [PubMed] [Google Scholar]
- Miura K (2005) Tracking movement in cell biology. Adv Biochem Eng Biotechnol 95: 267–295 [DOI] [PubMed] [Google Scholar]
- Miyawaki A, Tsien RY (2000) Monitoring protein conformations and interactions by fluorescence resonance energy transfer between mutants of green fluorescent protein. Methods Enzymol 327: 472–500 [DOI] [PubMed] [Google Scholar]
- Miyawaki A, Nagai T, Mizuno H (2005) Engineering fluorescent proteins. Adv Biochem Eng Biotechnol 95: 1–15 [DOI] [PubMed] [Google Scholar]
- Miyawaki A, Sawano A, Kogure T (2003) Lighting up cells: labelling proteins with fluorophores. Nat Cell Biol (Suppl): S1–S7 [PubMed] [Google Scholar]
- Nakamura T, Kurokawa K, Kiyokawa E, Matsuda M (2006) Analysis of the spatiotemporal activation of Rho GTPases using Raichu probes methods in enzymology. In Regulators and Effectors of Small GTPases: Rho Family, WE Balch, CJ Der, A Hall (eds), pp 315–332. New York: Academic Press [DOI] [PubMed] [Google Scholar]
- Nelson WJ, Nusse R (2004) Convergence of Wnt, beta-catenin, and cadherin pathways. Science 303: 1483–1487 [DOI] [PMC free article] [PubMed] [Google Scholar]
- Nicastro D, McIntosh JR, Baumeister W (2005) 3D structure of eukaryotic flagella in a quiescent state revealed by cryo-electron tomography. Proc Natl Acad Sci USA 102: 15889–15894 [DOI] [PMC free article] [PubMed] [Google Scholar]
- Nickell S, Kofler C, Leis AP, Baumeister W (2006) A visual approach to proteomics. Nat Rev Mol Cell Biol 7: 225–230 [DOI] [PubMed] [Google Scholar]
- Oliver T, Dembo M, Jacobson K (1999) Separation of propulsive and adhesive traction stresses in locomoting keratocytes. J Cell Biol 145: 589–604 [DOI] [PMC free article] [PubMed] [Google Scholar]
- O'Toole ET, Winey M, McIntosh JR, Mastronarde DN (2002) Electron tomography of yeast cells. Methods Enzymol 351: 81–95 [DOI] [PMC free article] [PubMed] [Google Scholar]
- Parent CA (2004) Making all the right moves: chemotaxis in neutrophils and Dictyostelium. Curr Opin Cell Biol 16: 4–13 [DOI] [PubMed] [Google Scholar]
- Park S, Koch D, Cardenas R, Kas J, Shih CK (2005) Cell motility and local viscoelasticity of fibroblasts. Biophys J 89: 4330–4342 [DOI] [PMC free article] [PubMed] [Google Scholar]
- Patel H, Guo KD, Parent C, Gross J, Devreotes PN, Weijer CJ (2000) A temperature-sensitive adenylyl cyclase mutant of Dictyostelium. EMBO J 19: 2247–2256 [DOI] [PMC free article] [PubMed] [Google Scholar]
- Patterson B, Spudich JA (1996) Cold-sensitive mutations of Dictyostelium myosin heavy chain highlight functional domains of the myosin motor. Genetics 143: 801–810 [DOI] [PMC free article] [PubMed] [Google Scholar]
- Patterson GH, Lippincott-Schwartz J (2002) A photoactivatable GFP for selective photolabeling of proteins and cells. Science 297: 1873–1877 [DOI] [PubMed] [Google Scholar]
- Pelet S, Previte MJ, Laiho LH, So PT (2004) A fast global fitting algorithm for fluorescence lifetime imaging microscopy based on image segmentation. Biophys J 87: 2807–2817 [DOI] [PMC free article] [PubMed] [Google Scholar]
- Periasamy A, Day RN (1999) Visualizing protein interactions in living cells using digitized GFP imaging and FRET microscopy. Methods Cell Biol 58: 293–314 [DOI] [PubMed] [Google Scholar]
- Pollard TD, Borisy GG (2003) Cellular motility driven by assembly and disassembly of actin filaments. Cell 112: 453–465 [DOI] [PubMed] [Google Scholar]
- Radmacher M (2002) Measuring the elastic properties of living cells by the atomic force microscope. Methods Cell Biol 68: 67–90 [DOI] [PubMed] [Google Scholar]
- Ridley AJ, Schwartz MA, Burridge K, Firtel RA, Ginsberg MH, Borisy G, Parsons JT, Horwitz AR (2003) Cell migration: integrating signals from front to back. Science 302: 1704–1709 [DOI] [PubMed] [Google Scholar]
- Rietdorf J, Siegert F, Weijer CJ (1996) Analysis of optical-density wave-propagation and cell-movement during mound formation in Dictyostelium discoideum. Dev Biol 177: 427–438 [DOI] [PubMed] [Google Scholar]
- Rieu JP, Barentin C, Maeda Y, Sawada Y (2005) Direct mechanical force measurements during the migration of Dictyostelium slugs using flexible substrata. Biophys J 89: 3563–3576 [DOI] [PMC free article] [PubMed] [Google Scholar]
- Sahai E, Wyckoff J, Philippar U, Segall JE, Gertler F, Condeelis J (2005) Simultaneous imaging of GFP, CFP and collagen in tumors in vivo using multiphoton microscopy. BMC Biotechnol 5: 14. [DOI] [PMC free article] [PubMed] [Google Scholar]
- Salmon WC, Adams MC, Waterman-Storer CM (2002) Dual-wavelength fluorescent speckle microscopy reveals coupling of microtubule and actin movements in migrating cells. J Cell Biol 158: 31–37 [DOI] [PMC free article] [PubMed] [Google Scholar]
- Sasaki AT, Chun C, Takeda K, Firtel RA (2004) Localized Ras signaling at the leading edge regulates PI3K, cell polarity, and directional cell movement. J Cell Biol 167: 505–518 [DOI] [PMC free article] [PubMed] [Google Scholar]
- Sawai S, Thomason PA, Cox EC (2005) An autoregulatory circuit for long-range self-organization in Dictyostelium cell populations. Nature 433: 323–326 [DOI] [PubMed] [Google Scholar]
- Sepich DS, Solnica-Krezel L (2005) Analysis of cell movements in zebrafish embryos: morphometrics and measuring movement of labeled cell populations in vivo. Methods Mol Biol 294: 211–233 [DOI] [PubMed] [Google Scholar]
- Shaner NC, Steinbach PA, Tsien RY (2005) A guide to choosing fluorescent proteins. Nat Methods 2: 905–909 [DOI] [PubMed] [Google Scholar]
- Sheetz MP, Sable JE, Dobereiner HG (2006) Continuous membrane-cytoskeleton adhesion requires continuous accommodation to lipid and cytoskeleton dynamics. Annu Rev Biophys Biomol Struct 35: 417–434 [DOI] [PubMed] [Google Scholar]
- Siegert F, Weijer C (1989) Digital image processing of optical density wave propagation in Dictyostelium discoideum and analysis of the effects of caffeine and ammonia. J Cell Sci 93: 325–335 [Google Scholar]
- Siegert F, Weijer CJ, Nomura A, Miike H (1994) A gradient method for the quantitative analysis of cell movement and tissue flow and its application to the analysis of multicellular Dictyostelium development. J Cell Sci 107: 97–104 [DOI] [PubMed] [Google Scholar]
- Simon A, Durrieu MC (2006) Strategies and results of atomic force microscopy in the study of cellular adhesion. Micron 37: 1–13 [DOI] [PubMed] [Google Scholar]
- Soll DR, Wessels D, Heid PJ, Voss E (2003) Computer-assisted reconstruction and motion analysis of the three-dimensional cell. Scientific World J 3: 827–841 [DOI] [PMC free article] [PubMed] [Google Scholar]
- Solnica-Krezel L (2005) Conserved patterns of cell movements during vertebrate gastrulation. Curr Biol 15: R213–R228 [DOI] [PubMed] [Google Scholar]
- Song L, Nadkarni SM, Bodeker HU, Beta C, Bae A, Franck C, Rappel WJ, Loomis WF, Bodenschatz E (2006) Dictyostelium discoideum chemotaxis: threshold for directed motion. Eur J Cell Biol [E-pub ahead of print] [DOI] [PubMed] [Google Scholar]
- Stepanovic V, Wessels D, Daniels K, Loomis WF, Soll DR (2005) Intracellular role of adenylyl cyclase in regulation of lateral pseudopod formation during Dictyostelium chemotaxis. Eukaryot Cell 4: 775–786 [DOI] [PMC free article] [PubMed] [Google Scholar]
- Stephens DJ, Allan VJ (2003) Light microscopy techniques for live cell imaging. Science 300: 82–86 [DOI] [PubMed] [Google Scholar]
- Swedlow JR, Platani M (2002) Live cell imaging using wide-field microscopy and deconvolution. Cell Struct Funct 27: 335–341 [DOI] [PubMed] [Google Scholar]
- Swedlow JR, Goldberg I, Brauner E, Sorger PK (2003) Informatics and quantitative analysis in biological imaging. Science 300: 100–102 [DOI] [PMC free article] [PubMed] [Google Scholar]
- Teruel MN, Meyer T (2000) Translocation and reversible localization of signaling proteins: a dynamic future for signal transduction. Cell 103: 181–184 [DOI] [PubMed] [Google Scholar]
- Teruel MN, Meyer T (2002) Parallel single-cell monitoring of receptor-triggered membrane translocation of a calcium-sensing protein module. Science 295: 1910–1912 [DOI] [PubMed] [Google Scholar]
- Trache A, Meininger GA (2005) Atomic force-multi-optical imaging integrated microscope for monitoring molecular dynamics in live cells. J Biomed Opt 10: 064023. [DOI] [PubMed] [Google Scholar]
- Truong K, Sawano A, Mizuno H, Hama H, Tong KI, Mal TK, Miyawaki A, Ikura M (2001) FRET-based in vivo Ca2+ imaging by a new calmodulin-GFP fusion molecule. Nat Struct Biol 8: 1069–1073 [DOI] [PubMed] [Google Scholar]
- Tsujioka M, Yoshida K, Inouye K (2004) Talin B is required for force transmission in morphogenesis of Dictyostelium. EMBO J 23: 2216–2225 [DOI] [PMC free article] [PubMed] [Google Scholar]
- Ueda M, Sako Y, Tanaka T, Devreotes P, Yanagida T (2001) Single-molecule analysis of chemotactic signaling in Dictyostelium cells. Science 294: 864–867 [DOI] [PubMed] [Google Scholar]
- Van Haastert PJ, Devreotes PN (2004) Chemotaxis: signalling the way forward. Nat Rev Mol Cell Biol 5: 626–634 [DOI] [PubMed] [Google Scholar]
- Vazquez F, Matsuoka S, Sellers WR, Yanagida T, Ueda M, Devreotes PN (2006) Tumor suppressor PTEN acts through dynamic interaction with the plasma membrane. Proc Natl Acad Sci 103: 3633–3638 [DOI] [PMC free article] [PubMed] [Google Scholar]
- Vedula SR, Lim TS, Kausalya PJ, Hunziker W, Rajagopal G, Lim CT (2005) Biophysical approaches for studying the integrity and function of tight junctions. Mol Cell Biomech 2: 105–123 [PubMed] [Google Scholar]
- Vicente-Manzanares M, Webb DJ, Horwitz AR (2005) Cell migration at a glance. J Cell Sci 118: 4917–4919 [DOI] [PubMed] [Google Scholar]
- Vivero-Pol L, George N, Krumm H, Johnsson K, Johnsson N (2005) Multicolor imaging of cell surface proteins. J Am Chem Soc 127: 12770–12771 [DOI] [PubMed] [Google Scholar]
- Wallace W, Schaefer LH, Swedlow JR (2001) A workingperson's guide to deconvolution in light microscopy. Biotechniques 31: 1076–1078, 1080, 1082 passim [DOI] [PubMed] [Google Scholar]
- Watanabe N, Mitchison TJ (2002) Single-molecule speckle analysis of actin filament turnover in lamellipodia. Science 295: 1083–1086 [DOI] [PubMed] [Google Scholar]
- Waterman-Storer CM, Danuser G (2002) New directions for fluorescent speckle microscopy. Curr Biol 12: R633–R640 [DOI] [PubMed] [Google Scholar]
- Webb DJ, Brown CM, Horwitz AF (2003) Illuminating adhesion complexes in migrating cells: moving toward a bright future. Curr Opin Cell Biol 15: 614–620 [DOI] [PubMed] [Google Scholar]
- Webb DJ, Horwitz AF (2003) New dimensions in cell migration. Nat Cell Biol 5: 690–692 [DOI] [PubMed] [Google Scholar]
- Weijer CJ (2004) Dictyostelium morphogenesis. Curr Opin Genet Dev 14: 392–398 [DOI] [PubMed] [Google Scholar]
- Wu CC, Su HW, Lee CC, Tang MJ, Su FC (2005) Quantitative measurement of changes in adhesion force involving focal adhesion kinase during cell attachment, spread, and migration. Biochem Biophys Res Commun 329: 256–265 [DOI] [PubMed] [Google Scholar]
- Xiao Z, Zhang N, Murphy DB, Devreotes PN (1997) Dynamic distribution of chemoattractant receptors in living cells during chemotaxis and persistent stimulation. J Cell Biol 139: 365–374 [DOI] [PMC free article] [PubMed] [Google Scholar]
- Xu X, Meier-Schellersheim M, Jiao X, Nelson LE, Jin T (2005) Quantitative imaging of single live cells reveals spatiotemporal dynamics of multistep signaling events of chemoattractant gradient sensing in Dictyostelium. Mol Biol Cell 16: 676–688 [DOI] [PMC free article] [PubMed] [Google Scholar]
- Yang X, Dormann D, Munsterberg A, Weijer C (2002) Cell movement patterns during gastrulation in the chick are controlled by positive and negative chemotaxis mediated by FGF4 and FGF8. Dev Cell 3: 425–437 [DOI] [PubMed] [Google Scholar]
- Yokota H, Kaseda K, Matsuura H, Arai Y, Iwane A, Ishii Y, Kodama T, Yanagida T (2004) Single-molecule imaging of the dynamic interactions between macromolecules. J Nanosci Nanotechnol 4: 616–621 [DOI] [PubMed] [Google Scholar]
- Zhang H, Heid PJ, Wessels D, Daniels KJ, Pham T, Loomis WF, Soll DR (2003) Constitutively active protein kinase a disrupts motility and chemotaxis in Dictyostelium discoideum. Eukaryote Cell 2: 62–75 [DOI] [PMC free article] [PubMed] [Google Scholar]
- Zhang J, Campbell RE, Ting AY, Tsien RY (2002) Creating new fluorescent probes for cell biology. Nat Rev Mol Cell Biol 3: 906–918 [DOI] [PubMed] [Google Scholar]
- Zhao M, Jin T, McCaig CD, Forrester JV, Devreotes PN (2002) Genetic analysis of the role of G protein-coupled receptor signaling in electrotaxis. J Cell Biol 157: 921–927 [DOI] [PMC free article] [PubMed] [Google Scholar]
- Zicha D, Dobbie IM, Holt MR, Monypenny J, Soong DY, Gray C, Dunn GA (2003) Rapid actin transport during cell protrusion. Science 300: 142–145 [DOI] [PubMed] [Google Scholar]
- Zigmond SH (2004) Formin-induced nucleation of actin filaments. Curr Opin Cell Biol 16: 99–105 [DOI] [PubMed] [Google Scholar]
Associated Data
This section collects any data citations, data availability statements, or supplementary materials included in this article.
Supplementary Materials
Supplementary Movie 1
Supplementary Movie 2
Supplementary Movie 3
Supplementary Movie 4
Supplementary Movie 5
Supplementary Movie 6
Supplementary Movie 7
Supplementary Movie 8
Supplementary Movie 9
Supplementary Movie 10
Supplementary Movie 11
Legends to Supplementary Movies