Abstract
The effect of a copper-clad polyimide (CCP) backing layer on piezopolymer transducer performance is evaluated. High-frequency, spherically curved polyvinylidene fluoride (PVDF) transducers with and without a CCP backing layer are electrically and acoustically tested. The results showed very similar operating characteristics. B-mode in vivo images of a mouse embryo also showed no qualitative differences indicating the CCP backing layer does not effect transducer performance.
I. Introduction
High-frequency ultrasonic imaging transducers (> 20 MHz) have found wide use for applications where high spatial resolution is necessary. However, the high resolution capability of high-frequency transducers is offset by a relatively shallow acoustic penetration depth due to attenuation. Therefore, applications requiring imaging depths on the order of 1 cm or less benefit the most from the use of high-frequency transducers. These applications include ophthalmic [1], [2], dermatological [3]-[5] and small animal imaging [6]-[8].
High-frequency transducers are normally single-element, spherically-curved devices that may be fabricated with piezoceramic [9], single-crystal ferroelectric [10], or piezopolymer elements [11]. A steel ball is typically used to press the acoustically active layer of the transducer into a spherical shape. Of the three materials mentioned above, piezopolymers tend to be the easiest to work with because they are flexible films that may be easily pressed into curved shapes. Although piezopolymers have a relatively high insertion loss, their acoustic impedance is more closely matched to water/tissue then piezoceramics and ferroelectrics which eliminates the need for matching layers.
We recently introduced a novel method to fabricate spherically-shaped, high-frequency annular array transducers [12], [13]. In this approach, the transducer was fabricated using a polyvinylidene fluoride (PVDF) piezopolymer material bonded to a copper-clad polyimide (CCP) backing layer that also served as a five-ring annular electrode pattern. A major advantage of this method is that standard copper etching techniques can be easily employed to produce CCP-backed transducers with a wide variety of array and electrode geometries. In addition, no electrical connections need to be made directly to the backside of the PVDF membrane. One important question is whether the CCP backing layer has any significant effect on transducer performance. To answer this question, we have made direct comparisons between PVDF transducers fabricated with and without CCP-backing layers.
In this Correspondence, we describe the techniques used to fabricate single-element PVDF transducers using a CCP backing layer. Three devices were electrically and acoustically tested and compared to a PVDF transducer fabricated with conventional techniques [11].
II. Transducer fabrication
The method of fabricating the single-element transducer is similar to that described in [12] except that the devices here were built into a subminiature version A (SMA) connector. This makes for a compact design and also permits the transducer to be directly connected to standard coaxial cabling.
The process begins with 4 cm by 4 cm pieces of single-sided, CCP film (RFlex 1000L810, Rogers Corp., Chandler, AZ) and 9-μm PVDF membrane having a single side electroded (Ktech Corp., Albuquerque, NM). The CCP film consisted of a 25-μm thick polyimide layer bonded to a 18-μm copper layer via 20-μm adhesive layer. With the copper side facing upward, the CCP film was placed on top of a Teflon tube. A drop of non-conductive epoxy (Hysol RE2039, HD3561, Loctite Corp., Olean, NY) was placed on the copper, and then the PVDF membrane was placed on top of this with the electroded side of the PVDF facing upward. A steel ball was then pressed into the films over the Teflon tube and the whole assembly was clamped into place. The compliance of the Teflon tube helps to avoid tearing the membranes at the edge of the tube during the press fit. The assembly was then inverted and the bore of the Teflon tube was filled with epoxy.
After the epoxy cured, the epoxy plug with the CCP and PVDF bonded to it was separated from the Teflon tube. The CCP film was then trimmed as close as possible to the epoxy plug with a narrow flap left intact for later connection to the SMA connector [Fig. 1(a)]. The PVDF membrane was also trimmed leaving an exposed skirt of 5-7 mm. The epoxy plug was then cut down to a length of 4-5 mm, placed into a SMA bulkhead coupler (Pomona 4285, Everett, WA), and secured in place with a cyanoacrylate adhesive [Fig. 1(b)]. The SMA connector was first prepared by machining a hole in its side to permit access to its conductive center pin.
Fig. 1.
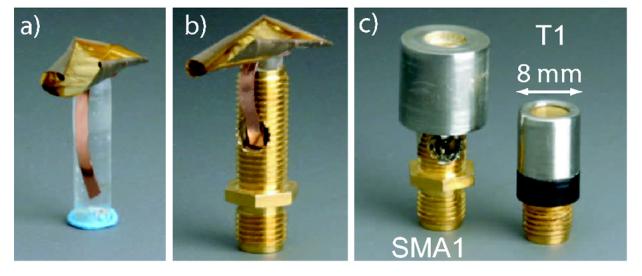
Steps of fabrication. a) Trimmed PVDF and the CCP bonded to epoxy plug. b) Shortened epoxy plug mounted in SMA connector. c) Fully assembled transducer (SMA1) next to standard PVDF transducer (T1).
Several steps were required to make the electrical connections. First, the copper flap was soldered to the center pin of the SMA bulkhead coupler. A surface-mount inductor may also be soldered inline if electrical matching is desired. Next, the interior portion of the SMA connector containing the center pin was filled with epoxy to reduce any chance of the soldered connection breaking free. A metal cap was then placed [Fig. 1(c)] over the top of the transducer. Silver epoxy (EE129-4 Epoxy Technology, Billerica, MA) inside of the metal cap provided an electrical connection to the electroded side of the PVDF. In addition, a small amount of silver epoxy electrically linked the metal cap to the SMA connector. By leaving a skirt of PVDF material, more surface area of PVDF was available to form a ground path and the likelihood of the silver epoxy causing a short by contacting the copper on the CCP was minimized. Finally, the remaining open space inside the metal cap was filled with non-conductive epoxy to ensure long term electrical and mechanical stability. A cross-sectional schematic view of the transducer and the components involved with the assembly is shown in Fig. 2. Scanning electron microscope images of our annular-array transducers [12], [13] (constructed using the same press-fit technique) revealed that the epoxy bond line between the PVDF and the CCP was on the order of 1 μm.
Fig. 2.
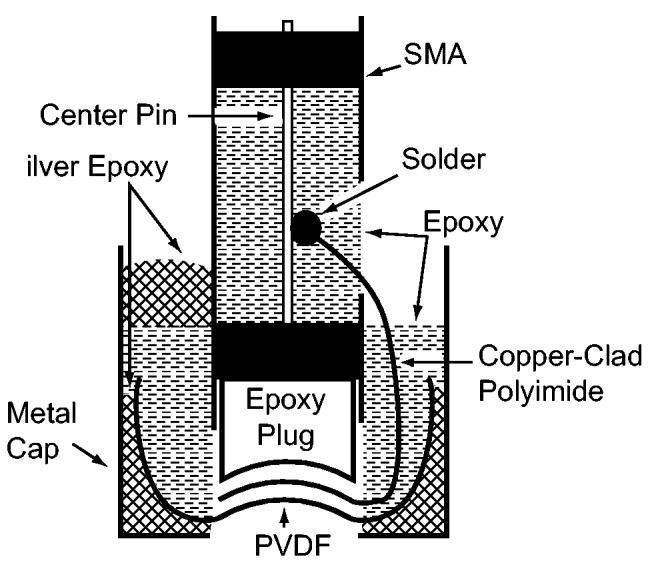
Cross-sectional view of transducer construction.
III. Experimental characterization
In the following sections, we compare four transducers constructed from 9-μm thick PVDF. Three of these transducers, SMA1-3, were constructed using the techniques described in Sec. II. These three transducers all have an aperture of 4.4 mm and focal length of 9 mm. The fourth transducer, T1 [Fig. 1(c)], represents a conventional two-sided electroded PVDF transducer with no CCP and was fabricated using the techniques described in [9], [11]. T1 has an aperture of 5 mm and a focal length of 10 mm.
Several electrical and acoustical measurements were made to characterize each transducer. The sole electrical measurement consisted of complex impedances measured with a Network-Spectrum-Impedance Analyzer (HP4396A & HP43961A, Hewlett Packard, Palo Alto, CA). This measurement was done with the transducers in air. The acoustical measurements were performed in degassed water with a quartz plate normal to the transducer axis and positioned at the geometric focus. With this configuration, the pulse-echo response was acquired using a pulser/receiver (Panametrics 5900, Waltham, MA) and the insertion loss was measured utilizing a directional coupler technique [11], [12]. All transducers were tested with the same pulser/receiver settings. The insertion loss values were corrected for attenuation losses in water and transmission losses at the quartz/water interface.
Experimental results were also compared to the theoretical predictions of a KLM model (PiezoCAD, Sonic Concepts, Woodinville, WA) [14]. The SMA and T1 transducers were modeled in the same fashion under the assumption that the PVDF was electroded on both sides because the KLM model did not permit us to account for how the thin epoxy layer (≈ 1 μm), between the CCP and PVDF electrodes, modified the electric potential across the PVDF. In spite of this, the KLM model has been shown to realistically predict the performance of CCP backed transducers [12].
Based on the KLM modeling, we determined that the large acoustic impedance mismatch between the copper (41.6 MRayls) and epoxy bond layer (3 MRayls)/PVDF (4.2 MRayls) had the effect of making the PVDF operate in a 1/4 wavelength mode. In addition, the thickness of the copper was significantly less than an acoustic wavelength (90 μm at 40 MHz) and, thus, internal reflections within the copper were not an issue. Excluding the effect that the epoxy bond layer has on the device capacitance, a thinner bond layer led to better transducer performance. The back-fill epoxy (3 MRayls) and polyimide (2.3 MRayls) layers were closely impedance matched to the PVDF and, combined, they had a minimal impact on insertion loss, center frequency, and bandwidth.
A. Impedance measurements
Figures 3(a) and 3(b) summarizes the complex impedance measurements for the four single-element transducers. The complex impedances, z, and magnitudes, |z|, at 40 MHz for T1 and SMA1-3 are summarized in Table I. The theoretical complex impedance for T1 is 12-j44 Ω and for SMA1-3 it is 16-j56 Ω [Fig. 3(c)]. These values correspond to |z| ≈ 40 Ω for T1 and |z| ≈ 50 Ω for SMA1-3. To match the transducers to 50 Ω with zero reactance, an inductor and ideal transformer would be required.
Fig. 3.
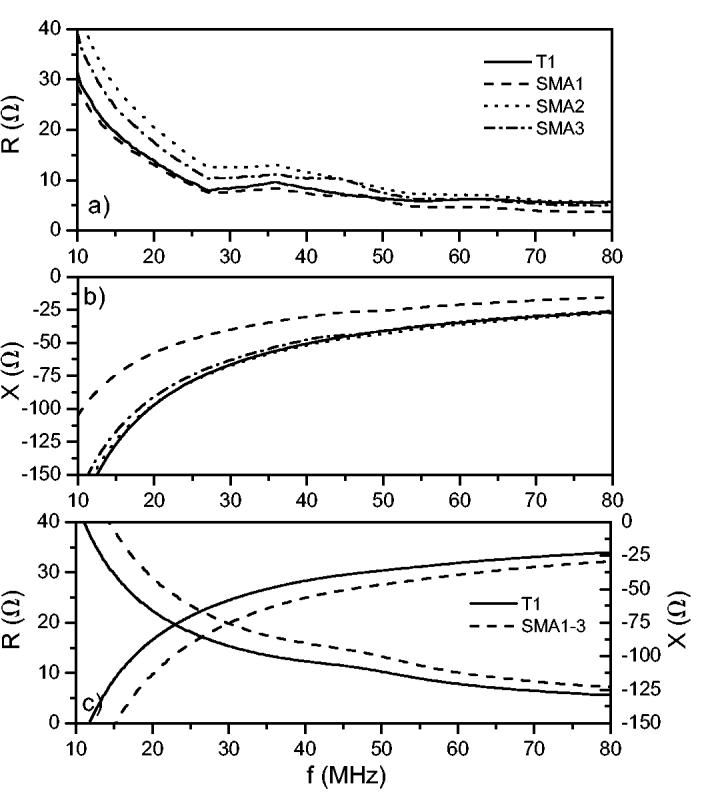
Experimental complex electrical impedances displayed as a) resistance and b) reactance compared to c) theoretical predictions from a KLM model.
TABLE I.
Transducer Performance Summary
| z (Ω) |
|z| (Ω) |
fc (MHz) |
BW (%) |
Amp (dB) |
IL (dB) |
fIL (MHz) |
|
|---|---|---|---|---|---|---|---|
| T1 | 8.4-j51 | 52 | 31 | 113 | -6 | 44 | 51 |
| SMA1 | 7.4-j30 | 31 | 34 | 96 | -7 | 42 | 44 |
| SMA2 | 11.5-j52 | 53 | 33 | 78 | -12 | 50 | 39 |
| SMA3 | 10.3-j47 | 48 | 36 | 64 | 0 | 38 | 43 |
B. Acoustical measurements
Figure 4(a) shows the time-domain pulse-echo response with a quartz plate at the geometric focus. From the figure, SMA3 is seen to have the highest-amplitude pulse-echo response followed by T1, SMA1 and SMA2. In terms of pulse duration, T1 has a slightly shorter total time duration than SMA1-3. The corresponding frequency domain signals are shown in Fig. 4(b). The peak amplitudes of the spectra follow what is shown in Fig. 4(a): SMA3 has the highest peak response followed by T1, SMA1, and SMA2. Table I summarizes these peak dB values relative to the value for SMA3. In terms of the center frequency, fc, SMA3 has the highest value followed by SMA1, SMA2 and T1. The KLM model predicts fc ≈ 41 MHz for all of the transducers and -6-dB bandwidths between 55 and 61%. Other than for SMA3, the bandwidths we measured were substantially better than the KLM prediction. As noted earlier, T1 has the shortest pulse duration and this is reflected in a higher fractional 6-dB bandwidth than for the other transducers (Table I).
Fig. 4.
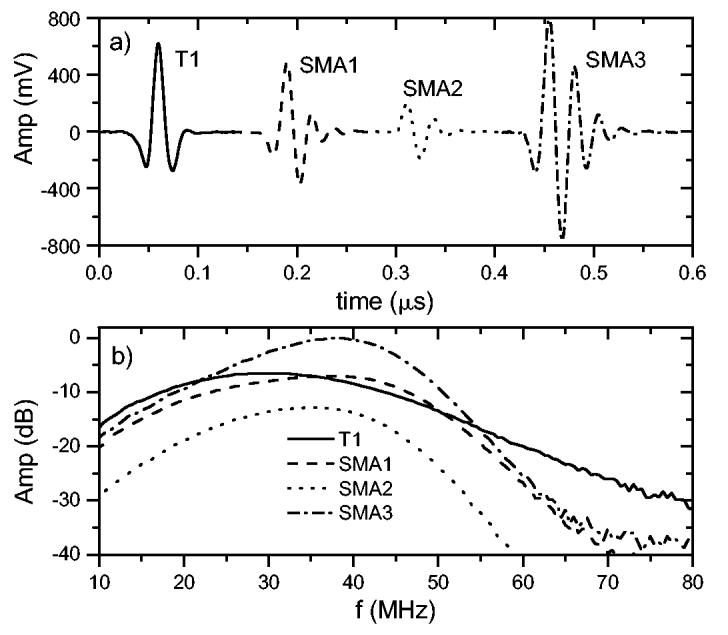
Time-domain pulse-echo response (a) from a quartz plate positioned at the geometric focus. The corresponding frequency domain spectra (b) are shown scaled relative to the peak amplitude of SMA3.
Table I also indicates the minimum insertion loss (IL) and the frequency at which it occurs (fIL) for the four transducers. SMA3 had the highest sensitivity, SMA2 the lowest, while SMA1 and T1 had nearly the same sensitivity. The insertion losses for SMA1, SMA2 and T1 are similar while SMA2 has a much lower sensitivity. The KLM model predicts a similar frequency (44 MHz) for the minimum insertion loss of the transducers but with a value of ≈ 33 dB. The insertion losses observed here for unmatched PVDF transducers are similar to what has been previously reported [11].
IV. Mouse Embryo B-Mode Images
To qualitatively assess the imaging performance of the CCP backed single-element transducers, we acquired in vivo B-mode images of mouse embryos. Timed, pregnant Swiss-Webster mice were first anesthetized with sodium pentobarbital (6 mg per 100 g body weight), their abdomen was wet shaved, a small incision was made in the skin and peritoneal wall and, finally, the intact uterus was exteriorized into a saline bath attached over the mouse’s abdomen. All mice used in these studies were maintained according to protocols approved by the Institutional Animal Research and Care Committee at New York University School of Medicine. B-mode images were acquired with the custom ultrasonic backscatter microscope (UBM) described in [15].
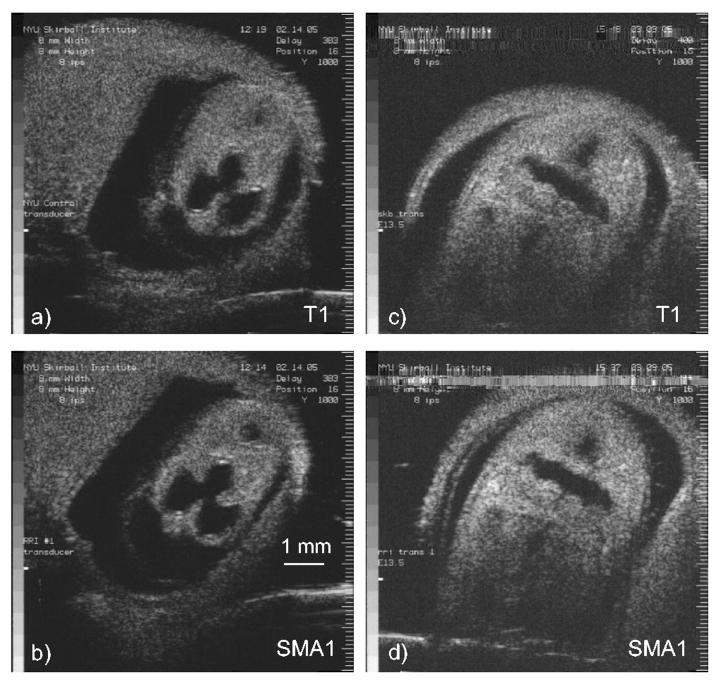
A side by side comparison of B-mode images acquired with SMA1 and T1 are shown in Fig. 5. These UBM images were acquired with identical UBM settings and show 11 (E11.5) and 13 (E13.5) day old mouse embryos, where E0.5 was defined as noon of the day a vaginal plug was found after overnight mating. The images are qualitatively identical in terms of dynamic range and noise level, an observation consistent with the similar transducer performances observed for T1 and SMA1 (Table I).
Fig. 5.
In vivo B-mode images of an E11.5 mouse embryo comparing a) T1 to b) SMA1 and an E13.5 mouse embryo comparing c) T1 to d) SMA1. The images were acquired with identical UBM settings.
V. Conclusion
This Correspondence describes a novel technique to fabricate focused PVDF based transducers. The method utilizes a CCP backing layer bonded to a PVDF membrane electroded on one side. The copper side of the polyimide is bonded to the PVDF with epoxy, pressed into a Teflon tube with a steel ball, and then the tube is filled with epoxy. The utility of the technique is that an electrical connection does not need to be made directly to the back of the PVDF membrane which reduces the likelihood of mass loading or damaging the PVDF. The three transducers we fabricated (SMA1-3) varied in performance, most likely because of small variations in the thickness of the epoxy bond layer between the PVDF and CCP. Variations in this gap will change the capacitance of the transducer (Fig. 3) and alter the electric potential across the PVDF, thus reducing the efficiency of the transdcucer. Nevertheless, two of the transducers (SMA1 and SMA3) matched or surpassed the standard PVDF transducer (T1) showing that transducers built with a CCP backing layer approach the performance of PVDF transducers in normal use. In addition, UBM images obtained with the two types of transducers were qualitatively the same in terms of dynamic range, resolution, and noise level.
The method used here to construct single-element transducers may be easily extended to creating multi-element arrays [12], [13]. This is accomplished by etching an array pattern onto the CCP, commonly referred to as a flex-circuit, and then running electrical traces from the array to the drive electronics. With this technique, the array pattern can take nearly any form as long as each array element is electrically accessible by trace lines or laser-drilled microvias. Because the CCP and PVDF are flexible, the transducer can also be formed into nearly any surface geometry. Typically, these geometries are limited to flat, spherically curved or cylindrically curved surfaces.
VI. Acknowledgments
The authors wish to thank Erin Girard for assistance with the measurements. This work was supported in part by NIH grants EY014371 (JAK) and NS038461 (DHT).
Footnotes
This research was supported in part by grants from the National Institutes of Health (EY014371 and NS038461).
References
- [1].Lockwood GR, Turnbull DH, Christopher DA, Foster FS. “Beyond 30 MHz - Applications of high-frequency ultrasound imaging,”. IEEE Eng. Med. Biol. Mag. 1996;15:60–71. [Google Scholar]
- [2].Silverman RH, Rondeau MJ, Lizzi FL, Coleman DJ. “Three-dimensional high-frequency ultrasonic parameter imaging of anterior segment pathology,”. Ophthalmology. 1995;102:837–843. doi: 10.1016/s0161-6420(95)30948-7. [DOI] [PubMed] [Google Scholar]
- [3].Turnbull DH, Starkoski BG, Harasiewicz KA, Semple JL, From L, Gupta AK, Sauder DN, Foster FS. “40-100 MHz B-scan ultrasound backscatter microscope for skin imaging,”. Ultrasound Med. Biol. 1995;21:79–88. doi: 10.1016/0301-5629(94)00083-2. [DOI] [PubMed] [Google Scholar]
- [4].Harland CC, Kale SG, Jackson P, Mortimer PS, Bamber JC. “Differentiation of common benign pigmented skin lesions from melanoma by high-resolution ultrasound,”. Br. J. Dermatol. 2000;143:281–289. doi: 10.1046/j.1365-2133.2000.03652.x. [DOI] [PubMed] [Google Scholar]
- [5].Vogt M, Ermert H. “Development and evaluation of a high-frequency ultrasound-based system for in vivo strain imaging of the skin,”. IEEE Trans. Ultrason. Ferroelect. Freq. Contr. 2005;52:375–385. doi: 10.1109/tuffc.2005.1417260. [DOI] [PubMed] [Google Scholar]
- [6].Foster FS, Pavlin CJ, Harasiewicz KA, Christopher DA, Turnbull DH. “Advances in ultrasound biomicroscopy,”. Ultrasound Med. Biol. 2000;26:1–27. doi: 10.1016/s0301-5629(99)00096-4. [DOI] [PubMed] [Google Scholar]
- [7].Turnbull DH, Foster FS. “Ultrasound biomicroscopy in developmental biology,”. Trends Biotechnol. 2002;20:S29–S33. [Google Scholar]
- [8].Phoon CKL, Turnbull DH. “Ultrasound biomicroscopy-doppler in mouse cardiovascular development,”. Physiol. Genomics. 2003;14:3–15. doi: 10.1152/physiolgenomics.00008.2003. [DOI] [PubMed] [Google Scholar]
- [9].Lockwood GR, Turnbull DH, Foster FS. “Fabrication of high frequency spherically shaped ceramic transducers,”. IEEE Trans. Ultrason. Ferroelect. Freq. Contr. 1994;41:231–235. [Google Scholar]
- [10].Cannata JM, Ritter TA, Chen WH, Silverman RH, Shung KK. “Design of efficient, broadband single-element (20-80 MHz) ultrasonic transducers for medical imaging applications,”. IEEE Trans. Ultrason. Ferroelect. Freq. Contr. 2003;50:1548–1557. doi: 10.1109/tuffc.2003.1251138. [DOI] [PubMed] [Google Scholar]
- [11].Sherar MD, Foster FS. “The design and fabrication of high-frequency poly(vinylidene fluoride) transducers,”. Ultrason. Imaging. 1989;11:75–94. doi: 10.1177/016173468901100201. [DOI] [PubMed] [Google Scholar]
- [12].Ketterling JA, Aristizábal O, Turnbull DH, Lizzi FL. “Design and fabrication of a 40-MHz annular array transducer,”. IEEE Trans. Ultrason. Ferroelecrt. Freq. Contr. 2005;52:672–681. doi: 10.1109/tuffc.2005.1428050. [DOI] [PMC free article] [PubMed] [Google Scholar]
- [13].Ketterling JA, Ramachandran S, Aristizábal O. “Operational verification of a 40-MHz annular array transducer,”. IEEE Trans. Ultrason. Ferroelecrt. Freq. Contr. 2006;53:623–630. doi: 10.1109/tuffc.2006.1610571. [DOI] [PMC free article] [PubMed] [Google Scholar]
- [14].Leedom DA, Krimholtz R, Matthaei GL. “Equivalent circuits for transducers having arbitrary even- or odd-symmetry piezoelectric excitation,”. IEEE Trans. Sonics Ultrason. 1971;18:128–141. [Google Scholar]
- [15].Aristizábal O, Christopher DA, Foster FS, Turnbull DH. “40-MHz echocardiography scanner for cardiovascular assessment of mouse embryos,”. Ultrasound Med. Biol. 1998;24:1407–1417. doi: 10.1016/s0301-5629(98)00132-x. [DOI] [PubMed] [Google Scholar]


