Abstract
Flow cytometry together with SYBR green I and propidium iodide was used to study the effects of enrofloxacin, ciprofloxacin, gentamicin, chloramphenicol, oxytetracycline, and tylosin on four mycoplasma species. Inhibition of mycoplasma growth could be detected by as early as 3 h after the start of treatment. The strongest effect was observed with enrofloxacin- and ciprofloxacin-treated cells.
Contagious agalactia of small ruminants is a serious disease responsible for causing severe economic losses in goat and sheep farms throughout the world (3, 14). It has four causal agents, Mycoplasma agalactiae, M. putrefaciens, M. capricolum subsp. capricolum, and M. mycoides subsps. mycoides large colony type (LC) (3), which cause a variety of clinical syndromes like mastitis, arthritis, keratoconjunctivitis, and, occasionally, abortion and respiratory disease (3, 14). Contagious agalactia is currently controlled by vaccination and antimicrobial treatment. However, uncontrolled antimicrobial treatment is very common and can lead to the development of antimicrobial agent-resistant strains.
The efficacies of all antimicrobials are described in terms of MICs. Despite reservations about their clinical relevance, MICs are still generally considered the reference point for comparison and evaluation of the sensitivities of other tests (8). Mycoplasmas are slowly growing and highly fastidious; and they do not produce turbidity in broth, nor do they grow on agar surfaces at levels sufficient for conventional antibacterial testing (8).
Flow cytometry is a very powerful technique that makes it possible to study the morphological and physiological characteristics of individual cells and their distributions within large cell populations in a short period of time (1, 4, 6, 17). It has wide-ranging clinical and experimental applications in investigations of eukaryotic cells and also looks very promising in the case of bacteria (4). On the basis of these considerations, it is appropriate to attempt to apply this methodology to the assessment of the antibiotic susceptibilities of these four mycoplasma species because of their importance in disease and because of their increasing resistance to previously active antibiotics (7, 12, 18, 19).
The reference strains of M. mycoides subsp. mycoides LC, M. agalactiae, M. putrefaciens, and M. capricolum subsp. capricolum were obtained from the National Collection of Type Cultures (United Kingdom). Enrofloxacin and ciprofloxacin were obtained from Sigma (St. Louis, MO); and gentamicin, chloramphenicol, oxytetracycline, and tylosin were obtained from Serva (Heidelberg, Germany). Stock solutions of the antibacterial agents were made by standard protocols (8). The MIC was defined as the lowest concentration of agents at which no growth occurred after 1 day in pH broth medium (11) plus 1% glucose for M. mycoides subsp. mycoides LC, M. putrefaciens, and M. capricolum subsp. capricolum and in pH broth medium plus 1% glucose and 0.5% pyruvate for M. agalactiae and was determined by the standard method (8). The MICs of the antibacterial agents for M. agalactiae, M. putrefaciens, M. mycoides subsp. mycoides LC, and M. capricolum subsp. capricolum were 0.03, 0.125, 0.06, and 0.125 μl ml−1, respectively, for enrofloxacin; 0.06, 0.25, 0.06, and 0.25 μl ml−1, respectively, for ciprofloxacin; 1, 32, 64, and 8 μl ml−1, respectively, for gentamicin; 4, 4, 1, and 2 μl ml−1, respectively, for chloramphenicol; 0.25, 0.5, 0.25, and 0.25 μl ml−1, respectively, for oxytetracycline; and 0.06, 0.06, 0.03, and 0.06 μl ml−1, respectively, for tylosin.
For flow cytometric analysis, the antibacterial agents were added to the pH medium at 0.125 time the MIC (1/8 MIC), the MIC (MIC), and eight times the MIC (8 MIC). A tube of each of the mycoplasma species without antibacterial agents was prepared as a positive control. All cultures were incubated at 37°C for 24 h; and at 0, 1, 3, 6, and 24 h, a 10-μl sample was removed from each tube for flow cytometric analysis. The experiments were repeated three times on different days.
In parallel, in order to establish the regions in the flow cytometric analysis that corresponded to live and dead mycoplasma cells, M. mycoides subsp. mycoides LC cells were heat injured at 60°C for 1 h and used as a dead control, whereas an early-logarithmic-phase M. mycoides subsp. mycoides LC culture (24 h) was used as a live control.
Cells were stained (15 min at room temperature, in the dark) with the cell-permeant double-stranded DNA fluorochrome SYBR green I (SYBR; Amresco) at a final concentration of the commercial stock solution of 1:10,000 (vol/vol) (neither the molecular weight nor the chemical formula was provided by the manufacturer) and/or with propidium iodide (PI; Sigma) at a final concentration of 10 μg. SYBR stains the nucleic acids in all cells, while PI stains the nucleic acids in cells with damaged membranes.
Sample analysis was performed with a Coulter Epics Elite flow cytometer (Beckman Coulter Ltd., Luton, United Kingdom) equipped with an air-cooled 488-nm argon ion laser. Each cell was characterized by four optical parameters: side-angle scatter (SSC), forward-angle scatter (FSC), green fluorescence for SYBR (525 nm), and red fluorescence for PI (675 nm). Data were acquired on a four-decade logarithmic scale. Optical alignment was based on an optimized signal from Immuno-Check Epics alignment fluorospheres (Epics Divison). For absolute counts we used 5.5-μm beads (Optoflow, Oslo, Norway) with a known concentration as the reference. The number of cells counted was then converted to the number of cells ml−1.
Data were collected with software supplied by Beckman Coulter and were further analyzed by using WinMDI software version 2.8 (Joseph Trotter, The Scripps Research Institute, La Jolla, CA).
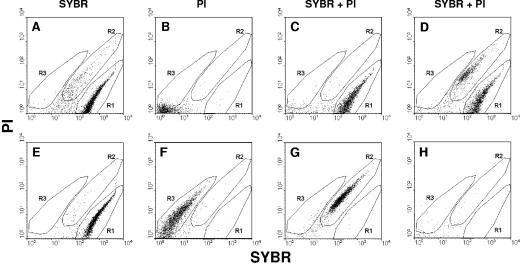
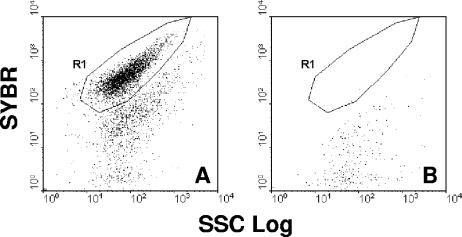
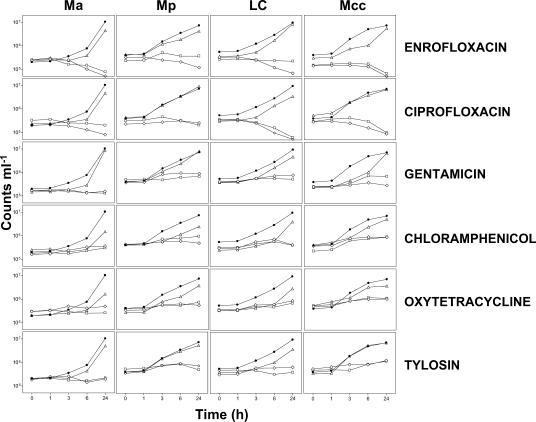
In the preliminary experiments, SYBR and PI were shown to be effective for distinguishing between live and dead mycoplasma cells (Fig. 1). Afterwards, the four mycoplasma species were incubated with different concentrations of the six antibacterial agents, and the extent of their growth was measured by flow cytometry. Total counts were obtained from the SYBR-stained cells (Fig. 2), and growth curves are shown in Fig. 3. Antibacterial agents used at 8 MIC and MIC inhibited the growth of all mycoplasma species used in this study and gave very similar curves. The cultures treated with 1/8 MIC were able to grow, but in some cases a delay in growth (in the first hours of incubation) compared to that of the untreated control was observed (Fig. 3). This result of this observation is that the earliest time that the antibacterial effects of the 8 MIC and MIC samples could be confirmed (compared to the definitive MIC results at 24 h) depended on the antibacterial agent and the mycoplasma species tested. Definitive MIC results were possible only at 24 h for M. agalactiae and M. mycoides subsp. mycoides LC with chloramphenicol and oxytetracycline, whereas definitive MIC results were possible at 6 h postincubation for M. agalactiae with enrofloxacin, ciprofloxacin, gentamicin, and tylosin; for M. putrefaciens with gentamicin and choramphenicol; for M. mycoides subsp. mycoides LC with gentamicin and tylosin; and for M. capricolum subsp. capricolum with gentamicin, chloramphenicol, and oxytetracycline. The rest of the assays gave definitive MIC results at just 3 h postincubation (Fig. 3).
FIG. 1.
Validation of live or dead mycoplasma cell staining. A log-phase culture of M. mycoides subsp. mycoides LC was used as a live cell control (A, B, and C). Mycoplasma cells were heat injured at 60°C for 1 h (E, F, and G). (D) An artificial mixture of live and dead mycoplasma cells; (H) broth medium as a negative control. Cells were stained with SYBR and/or PI. Region R1 corresponds to live cells and region R2 corresponds to dead cells when the double stain was used. Region R3 corresponds to dead cells when only PI stain was used. When SYBR is used alone, it can stain both live and dead cells (R1).
FIG. 2.
Dot plot histograms (SSC versus FL1) of mycoplasma cells stained with SYBR. (A) Mycoplasmas; (B) broth medium. Region R1 corresponds to the mycoplasma population.
FIG. 3.
Total counts (cells ml−1) of the cultures of M. agalactiae (Ma), M. putrefaciens (Mp), M. mycoides subsp. mycoides LC (LC), and M. capricolum subsp. capricolum (Mcc) in time-matched samples with different treatments: enrofloxacin, ciprofloxacin, gentamicin, chloramphenicol, oxytetracycline, and tylosin. The results are for control cells without any treatment (•) and cells treated with 8 MIC (⋄), MIC (□), and −8 MIC (▵).
The results obtained by the traditional method were available only at 24 h postincubation, when a change of color of the medium was visible. At this stage, both methods gave the same result.
The flow cytometric analysis showed that enrofloxacin and ciprofloxacin not only inhibited mycoplasma growth (as was the case with the other antibacterial agents) but also reduced the total counts of mycoplasma cells ml−1 throughout the time-matched samples (Fig. 3).
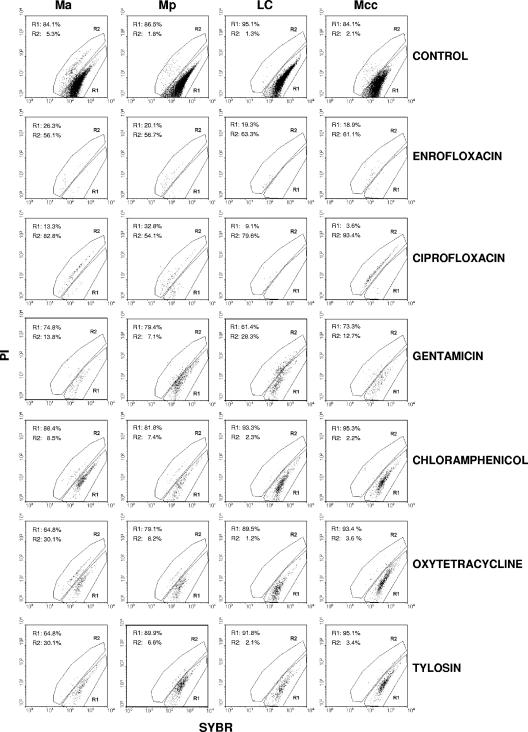
Figure 4 shows the histograms for the cells treated with 8 MIC of all the antibacterial agents in comparison with those for the control cells at 24 h. Fewer cells were counted in the samples with enrofloxacin and ciprofloxacin treatment, and the majority of these cells were located in the region defined as dead cells (Fig. 4, region R2). In contrast, it can be observed that for the rest of the antibacterial agents, the majority of the cells were always located in the region defined as live cells (Fig. 4, region R1).
FIG. 4.
Dot plot histograms of the cultures of M. agalactiae (Ma), M. putrefaciens (Mp), M. mycoides subsp. mycoides LC (LC), and M. capricolum subsp. capricolum (Mcc) at 24 h. The results for enrofloxacin, ciprofloxacin, gentamicin, chloramphenicol, oxytetracycline, and tylosin are shown. Region R1 corresponds to live cells, and region R2 corresponds to dead cells. Control, cells without any treatment.
In the present study we did not test antibacterial susceptibility for long periods; it is possible that the cells that had not incorporated PI could become resistant to the antibacterial agents with time, because their growth may have been just reversibly inhibited.
In previous studies it has been concluded that quinolones and fluoroquinolones such as enrofloxacin and ciprofloxacin were mycoplasmacidal (2, 5, 9, 10). This may explain why we obtained higher percentages of PI-stained cells with enrofloxacin and ciprofloxacin than with the other antibacterial agents that are known to be bacteriostatic (20). However, we did not observe the same behavior in the cells treated with gentamicin, which is also known to be bactericidal. It has been reported that large changes in fluorescence intensity have been observed for several cell-impermeant dyes (PI, TO-PRO-1, and SYTO X) subsequent to the actions of β-lactam antibiotic, but smaller changes (or no change) were seen subsequent to exposure to antimicrobials acting directly or indirectly on nucleic acid synthesis in Escherichia coli (13). It can be stated that the low level of incorporation of PI by the cells treated with some of the antibacterial agents, even at concentrations of 8 MIC, may indicate that a different pathway of membrane damage might be involved in making cells permeable to the dye (15).
On the basis of these results, enrofloxacin (which is currently used in the veterinary field) and ciprofloxacin (which is currently available for human use only) would appear to be the antimicrobials of choice, although concerns have been expressed about the use of new quinolones in the veterinary field (16). Furthermore, it could also be implied that the use of mycoplasmastatic antimicrobials might increase the onset of antimicrobial resistance (12) and should be avoided.
The major advantage of this flow cytometry-based method is the possibility of knowing in nearly real time how the cells are responding to each treatment, although the minimal time required for the confirmation of growth inhibition depends on the growth rates of the different mycoplasma species and the antibacterial agent tested. However, the flow cytometric approach will always give a quicker result than the traditional methods, since the latter are dependent on a change of color of the medium or turbidity, which occurs only when a certain amount of microorganisms are present (in this case, it took 1 day). Furthermore, this method may also be useful for the identification of populations that are resistant to the antibacterial agent, allowing their isolation and study of resistance mechanisms, which will inform drug choice.
Acknowledgments
This work was supported by Gobierno de Canarias (IDT-LP-04/016).
REFERENCES
- 1.Alvarez-Barrientos, A., J. Arroyo, R. Canton, C. Nombela, and M. Sanchez-Perez. 2000. Applications of flow cytometry to clinical microbiology. Clin. Microbiol. Rev. 13:167-195. [DOI] [PMC free article] [PubMed] [Google Scholar]
- 2.Ball, H. J., G. A. C. Reilly, and D. G. Bryson. 1995. Antibiotic susceptibility of Mycoplasma bovis strains isolated in Northern Ireland. Ir. Vet. J. 48:316-318. [Google Scholar]
- 3.Bergonier, D., X. Berthelot, and F. Poumarat. 1997. Contagious agalactia of small ruminants: current knowledge concerning epidemiology, diagnosis and control. Rev. Sci. Tech. Off. Int. Epizoot. 16:848-873. [DOI] [PubMed] [Google Scholar]
- 4.Braga, P. C., C. Bovio, M. Culici, and M. Dal Sasso. 2003. Flow cytometric assessment of susceptibilities of Streptococcus pyogenes to erythromycin and rokitamycin. Antimicrob. Agents Chemother. 47:408-412. [DOI] [PMC free article] [PubMed] [Google Scholar]
- 5.Cooper, A. C., J. R. Fuller, M. K. Fuller, P. Whittlestone, and D. R. Wise. 1993. In vitro activity of danofloxacin, tylosin and oxytetracycline against mycoplasmas of veterinary importance. Res. Vet. Sci. 54:329-334. [DOI] [PubMed] [Google Scholar]
- 6.Davey, H. M., and D. B. Kell. 1996. Flow cytometry and cell sorting of heterogeneous microbial populations: the importance of single-cell analyses. Microbiol. Rev. 60:641-696. [DOI] [PMC free article] [PubMed] [Google Scholar]
- 7.Gautier-Bouchardon, A. V., A. K. Reinhardt, M. Kobisch, and I. Kempf. 2002. In vitro development of resistance to enrofloxacin, erythromycin, tylosin, tiamulin and oxytetracycline in Mycoplasma gallisepticum, Mycoplasma iowae, and Mycoplasma synoviae. Vet. Microbiol. 88:47-58. [DOI] [PubMed] [Google Scholar]
- 8.Hannan, P. C. 2000. Guidelines and recommendations for antimicrobial minimum inhibitory concentration (MIC) testing against veterinary mycoplasma species. Vet. Res. 31:373-395. [DOI] [PubMed] [Google Scholar]
- 9.Hannan, P. C., G. D. Windsor, A. de Jong, N. Schmeer, and M. Stegemann. 1997. Comparative susceptibilities of various animal-pathogenic mycoplasmas to fluoroquinolones. Antimicrob. Agents Chemother. 41:2037-2040. [DOI] [PMC free article] [PubMed] [Google Scholar]
- 10.Hannan, P. C. T., P. J. O'Hanlon, and N. H. Rogers. 1989. In vitro evaluation of various quinolone antibacterial agents against veterinary mycoplasmas and porcine respiratory bacterial pathogens. Res. Vet. Sci. 46:202-211. [PubMed] [Google Scholar]
- 11.Kirchhoff, H., and R. Rosengarten. 1984. Isolation of a motile mycoplasma from fish. J. Gen. Microbiol. 130:2439-2445. [DOI] [PubMed] [Google Scholar]
- 12.Loria, G. R., C. Sammartino, R. A. Nicholas, and R. D. Ayling. 2003. In vitro susceptibilities of field isolates of Mycoplasma agalactiae to oxytetracycline, tylosin, enrofloxacin, spiramycin and lincomycin-spectinomycin. Res. Vet. Sci. 75:3-7. [DOI] [PubMed] [Google Scholar]
- 13.Mortimer, F. C., D. J. Mason, and V. A. Gant. 2000. Flow cytometric monitoring of antibiotic-induced injury in Escherichia coli using cell-impermeant fluorescent probes. Antimicrob. Agents Chemother. 44:676-681. [DOI] [PMC free article] [PubMed] [Google Scholar]
- 14.Nicholas, R. 1995. Contagious agalactia. State Vet. J. 5:13-15. [Google Scholar]
- 15.Novo, D. J., N. G. Perlmutter, R. H. Hunt, and H. M. Shapiro. 2000. Multiparameter flow cytometric analysis of antibiotic effects on membrane potential, membrane permeability, and bacterial counts of Staphylococcus aureus and Micrococcus luteus. Antimicrob. Agents Chemother. 44:827-834. [DOI] [PMC free article] [PubMed] [Google Scholar]
- 16.Sárkösy, G. 2001. Quinolones: a class of antimicrobial agents. Vet. Med. Czech. 46:257-274. [Google Scholar]
- 17.Shapiro, H. M. 2004. Practical flow cytometry. John Wiley & Sons, Inc., New York, N.Y.
- 18.Stakenborg, T., J. Vicca, P. Butaye, D. Maes, F. C. Minion, J. Peeters, A. De Kruif, and F. Haesebrouck. 2005. Characterization of in vivo acquired resistance of Mycoplasma hyopneumoniae to macrolides and lincosamides. Microb. Drug Resist. 11:290-294. [DOI] [PubMed] [Google Scholar]
- 19.Vicca, J., T. Stakenborg, D. Maes, P. Butaye, J. Peeters, A. de Kruif, and F. Haesebrouck. 2004. In vitro susceptibilities of Mycoplasma hyopneumoniae field isolates. Antimicrob. Agents Chemother. 48:4470-4472. [DOI] [PMC free article] [PubMed] [Google Scholar]
- 20.Walsh, C. 2003. Antibiotics: actions, origins, resistance. ASM Press, Washington, D.C.


