Abstract
Yeast strains expressing heterologous l-lactate dehydrogenases can produce lactic acid. Although these microorganisms are tolerant of acidic environments, it is known that at low pH, lactic acid exerts a high level of stress on the cells. In the present study we analyzed intracellular pH (pHi) and viability by staining with cSNARF-4F and ethidium bromide, respectively, of two lactic-acid-producing strains of Saccharomyces cerevisiae, CEN.PK m850 and CEN.PK RWB876. The results showed that the strain producing more lactic acid, CEN.PK m850, has a higher pHi. During batch culture, we observed in both strains a reduction of the mean pHi and the appearance of a subpopulation of cells with low pHi. Simultaneous analysis of pHi and viability proved that the cells with low pHi were dead. Based on the observation that the better lactic-acid-producing strain had a higher pHi and that the cells with low pHi were dead, we hypothesized that we might find better lactic acid producers by screening for cells within the highest pHi range. The screening was performed on UV-mutagenized populations through three consecutive rounds of cell sorting in which only the viable cells within the highest pHi range were selected. The results showed that lactic acid production was significantly improved in the majority of the mutants obtained compared to the parental strains. The best lactic-acid-producing strain was identified within the screening of CEN.PK m850 mutants.
Lactic acid is an organic acid with a wide range of industrial applications. Being classified by FDA as GRAS (for “generally regarded as safe”), it is often used in foods as an acidulant, flavoring agent, pH buffering agent, or preservative. Alongside its application in food, pharmaceuticals, and cosmetics, increased interest has been paid to the production of lactic acid polymers. These polymers have properties similar to petroleum-derived plastic but have the advantage of being biodegradable and environmentally friendly.
Lactic acid can be manufactured by chemical synthesis or by carbohydrate fermentation (14). While chemical synthesis requires several steps and leads to a racemic mixture, carbohydrate fermentation is a less expensive method and, depending on the organism used, can lead to optically pure l- or d-lactic acids. Current industrial lactic acid fermentations are performed with lactic acid bacteria. Although several strategies have been applied in order to improve the productivity of these bacteria, the problem of their pH sensitivity has not been solved. During the fermentation process, the pH declines, affecting the growth of the bacteria and their productivity. To counteract this acidification, neutralization is performed during the overall process. Additional operations are required afterward to regenerate the undissociated acid and to allow its extraction from the growth medium. Therefore, among the desirable characteristics of the industrial microorganism is the ability to ferment in an acidic environment and provide high yields of the preferred stereospecific lactic acid.
Due to the ability to grow and survive at low pH values, special attention has been paid to yeast systems. New methods for the production of lactic acid with engineered yeast have been reported. Dequin and Barre (7) first described in 1994 a metabolically engineered Saccharomyces cerevisiae strain expressing a heterologous l-lactate dehydrogenase. In these strains, the expression of l-lactate dehydrogenase leads to the production of lactic acid in addition to ethanol. Further improvements in lactic acid productivity were obtained by using S. cerevisiae strains lacking any pyruvate decarboxylase activity and thus unable to produce ethanol (15). Production of lactic acid was also attempted in nonconventional yeasts, e.g., Kluyveromyces lactis (2, 17), Torulaspora delbrueckii (16), and Zygosaccharomyces bailii (4). Recently, it has been shown that the production of lactic acid in S. cerevisiae is strongly dependent on the genetic background of the host and on the source of the heterologous l-lactate dehydrogenase (5).
Although yeasts are more tolerant of acidic environments than are lactic acid bacteria, it is known that the presence of weak organic acids itself exerts a high level of stress on the cells. In acidic environments, the undissociated organic acids can diffuse through the plasma membrane and acidify the cytoplasm. The cells tend to counteract this intracellular acidification by proton extrusion through the plasma membrane ATPase, but this is performed at the expense of ATP and leads to a reduction of the growth yield. The phenomena of growth delay and growth inhibition of the yeast S. cerevisiae have been observed after the addition of weak organic acids to the growth medium (3, 11, 20).
In the present work, we analyzed two pyruvate decarboxylase-negative S. cerevisiae strains expressing a heterologous l-lactate dehydrogenase. These strains are able to convert glucose to lactic acid without any ethanol production. Batch culture of the strains was performed in the presence of high glucose concentrations. To better understand the effect of the lactic acid produced by the cells on their physiology, we analyzed both intracellular pH (pHi) and viability. The results showed a correlation between the ability of the cells to produce large amounts of lactic acids and their ability to maintain their pHi. Based on this observation, we designed a new strategy aimed at the isolation of more-robust yeast strains, i.e., strains capable of improved lactic acid production. By following our approach, based on cell sorting technology, we produced mutants with improved lactic acid production.
MATERIALS AND METHODS
Strains.
The S. cerevisiae strains used in this study derive from strain CEN.PK RWB837 (MATa pdc1::loxP pdc5::loxP pdc6::loxP ura3-52) (19). Strain CEN.PK RWB876 is strain CEN.PK RWB837 transformed with the multicopy plasmid YEpLpLDH (13). In this plasmid, the Lactobacillus plantarum lactic dehydrogenase gene was expressed under control of the S. cerevisiae TPI1 promoter. Strain CEN.PK m850 is a mutant selected from strain CEN.PK RWB876 (13).
Growth conditions.
The strains were propagated on agar plates containing 1.7 g/liter yeast nitrogen base (YNB) without amino acids, 10 g/liter ethanol, and 10 g/liter glycerol. Two different liquid media were used to cultivate the strains: a preinoculum medium containing 0.31 g/liter CaCO3, 1.7 g/liter YNB without amino acids and without (NH4)2SO4, 1.5 g/liter urea, 10 g/liter ethanol, and 0.5 g/liter glucose and a fermentation medium containing 4.5 g/liter CaCO3, 1.7 g/liter YNB without amino acids and without (NH4)2SO4, 1 g/liter urea, 5 g/liter ethanol, and 70, 75, or 100 g/liter glucose, as specified.
Batch culture was performed, unless otherwise stated, at 28°C in 250-ml quadruple baffled shake flasks. The cells were harvested from fresh cultures grown on agar plates and used to inoculate 100 ml of preinoculum medium at an optical density at 600 nm (OD600) of 0.3. After 24 h these cells were harvested and used to inoculate 100 ml of fermentation medium at an OD600 of 3.0. Batch cultures were monitored for approximately 70 h.
Only for the screening of the mutants, batch culture was performed at 28°C in 100-ml Erlenmeyer flasks. In this case, the cells were harvested from fresh cultures grown on agar plates and used to inoculate 20 ml of preinoculum medium at an OD600 of 0.3. After 40 h these cells were harvested and used to inoculate 20 ml of fermentation medium at an OD600 of 3.0.
Intracellular pH determination.
Intracellular pH determination was performed with flow cytometry by staining the cells with the probe cSNARF-4F AM [SNARF-4F 5-(and-6)-carboxylic acid, acetoxymethyl ester, acetate; Molecular Probes] as previously described (18). The cells were harvested and incubated with 20 μM cSNARF-4F AM in citrate phosphate buffer, pH 3.0, for 11 min at 28°C.
An in situ calibration was generated for each experiment. Cells previously stained with cSNARF-4F AM were permeabilized through incubation with 30 μM amphotericin B in citrate phosphate buffers having different pH values for 1 h at 37°C.
For every sample, the fluorescence emission in channels FL2 and FL3 was analyzed with a FACSCalibur as described below and converted in a spreadsheet through the WinMDI 2.8 software. During the elaboration of the data, we calculated for every cell a ratio of the fluorescence emissions (FL2/FL3) and for every sample the mean fluorescence ratio.
The in situ calibration curve was constructed by plotting the mean fluorescence ratio of the different samples as a function of the pH of the buffer in which they were incubated. The data were fitted with a second-order polynomial function to generate an equation that converts the ratio of the fluorescence to pHi values.
The pHi values of the samples were determined through the in situ calibration curve.
UV mutagenesis.
Batch culture was performed in fermentation medium with 70 g/liter glucose, as previously described. The cells from strains CEN.PK RWB876 and CEN.PK m850 were collected after 14 and 16 h, respectively. The cells were washed, resuspended in sterile 0.9% NaCl solution to a final concentration of 8 × 10⁶ cells per ml, and exposed to 253 nm UV light for an amount of time that allows only 0.1 to 1% of cells to survive. Times of UV exposure of 7.5 and 5 min were determined for strains CEN.PK RWB876 and CEN.PK m850, respectively. After this treatment, only 0.5% of the cells were able to form colonies.
In order to prevent photoreactivation (repair of UV-induced DNA damage in the presence of light), all of the mutagenesis steps, including recovery of the cells after UV exposure, were performed in darkness.
Viability determination.
A cell sample corresponding to 1 ml at an OD600 of 0.25 was collected by centrifugation (2 min at 13,000 rpm) and resuspended in 250 μl of citrate phosphate buffer, pH 3.0, containing 30 mg/liter ethidium bromide. After 1 min of incubation at room temperature, the cells were collected by centrifugation (2 min at 13,000 rpm) and resuspended in 250 μl of citrate phosphate buffer, pH 3.0. The samples were put on ice, and the fluorescence emission was acquired by flow cytometry through filters FL2 and FL3.
Flow cytometric analysis.
Flow cytometric analyses were performed on a FACSCalibur system (Becton Dickinson, Franklin Lakes, NJ) with 488-nm excitation from a 15 mW air-cooled argon-ion laser. Fluorescence emission was acquired through a 585/21-nm band-pass filter (FL2) and a 670-nm long-pass filter (FL3) in linear and logarithmic modes. Acquisition of the forward scatter (FSC) and the side scatter (SSC) was performed in linear mode at every measurement. Threshold settings were adjusted so that the cell debris were excluded from the data acquisition; 10,000 cells were measured for every sample.
Cell sorting.
Cell sorting was performed with the FACSCalibur system equipped with the sorting option under sterile conditions. Sorting was performed according to the FACSCalibur user guide. Cells were stained with cSNARF-4F AM and analyzed. After the analysis, we defined two gates for cell sorting. Gate G1, defined on the dot plot as FSC versus SSC, contained viable cells, and gate G2, defined on the dot plot as FL2 versus FL3, contained the cells with the highest pHi range. More details on gate definition are provided in “Results,” below. Only cells belonging to both gates were selected. In order to improve the purity of the sorted population, the cells were sorted with the exclusion mode. A total of 5 × 10⁶ cells were sorted at a rate of approximately 400 cells/s.
The selected cells were collected and concentrated by using the cell concentrator module. Afterward, the cells were gently resuspended in sterile phosphate-buffered saline by gentle up and down pipetting and were transferred in preinoculum medium containing antibiotics (60 mg/liter penicillin, 100 mg/liter streptomycin, and 100 mg/liter gentamicin) to suppress possible contamination. The cells were grown for 3 days and then used to inoculate a fermentation medium.
Metabolites.
The residual glucose and lactic acid produced were determined with enzymatic kits from Megazyme, the glucose assay kit K-GLUC and the l-lactic acid kit K-LATE, respectively, according to the manufacturer's manual.
RESULTS
Analysis of pHi of lactic-acid-producing strains.
Two lactic-acid-producing strains of S. cerevisiae were analyzed: strain CEN.PK RWB876, expressing a Lactobacillus plantarum l-lactate dehydrogenase, and strain CEN.PK m850, which was previously selected from strain CEN.PK RWB876 for its acid tolerance (13). The strains were cultivated with 70 g/liter of glucose. Under this growth condition, strain CEN.PK m850 could consume all the glucose present in the medium and produce approximately 60 to 65 g/liter of lactic acid, while strain CEN.PK RWB876 could use only half of the glucose and as a consequence could produce just 30 to 35 g/liter of lactic acid. Alongside the lactic acid production, a decrease of the external pH was observed. The supernatants were harvested after 70 h with an external pH value lower than 3.0.
In order to study the pHi of these strains, the cells were stained with the pH-dependent probe cSNARF-4F and analyzed by flow cytometry, as previously described (18). This probe shows two fluorescence emission peaks at two different wavelengths (detected by filters FL2 and FL3) that are inversely related to the pH. At high pH there is low fluorescence emission in FL2 and high fluorescence emission in FL3, and vice versa at low pH. Therefore, the pHi of every cell can be calculated from the ratio of the fluorescence intensities measured at the two wavelengths through an appropriate calibration system. Based on the principle that the ratio of the fluorescence intensities (FL2 divided by FL3) is inversely correlated to the pHi of the cells, the slope of the cloud of cells in a dot plot of FL2 versus FL3 correlates to the pHi. Further processing of the data, i.e., conversion of the fluorescence intensities of every single cell to pHi values, provides the distribution of the pHi of the sample of cells analyzed.
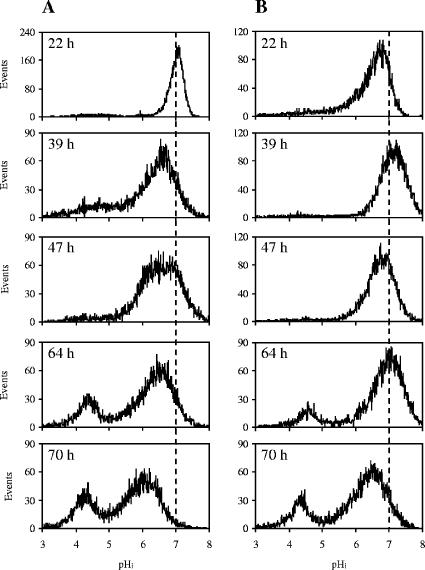
Analysis of pHi performed during the overall batch culture showed for both strains a progressive reduction of the mean pHi. Nevertheless, strain CEN.PK m850 always had a higher mean pHi than strain CEN.PK RWB876. Further analyses showed in both strains a shift from a homogeneous to a heterogeneous pHi distribution (Fig. 1). In particular, in samples harvested after 64 h, a subpopulation of cells with a strongly decreased pHi appeared. A subsequent enrichment of this subpopulation at the expense of the subpopulation with high pHi was visible in the samples harvested after 70 h. Interestingly, we observed that the two subpopulations of strain CEN.PK m850 had higher mean pHi values than the corresponding subpopulations of strain CEN.PK RWB876. For example, in cells harvested after 70 h, the mean pHi values of the two subpopulations were 4.5 and 6.6 for strain CEN.PK m850 and 4.3 and 6.0 for strain CEN.PK RWB876.
FIG. 1.
pHi distribution of strains CEN.PK RWB876 (A) and CEN.PK m850 (B) during batch culture with 70 g/liter glucose. Analysis of the pHi was performed by flow cytometry through staining with the pH-dependent probe cSNARF-4F. The culture time is reported in the graphs.
Analysis of the viability of lactic-acid-producing strains.
Analyses of cell viability were performed by staining of the cells with ethidium bromide. This probe can cross intact cytoplasmic membranes but is actively pumped out of viable cells; therefore, only impaired cells retain the ethidium bromide and show fluorescence emission at two different wavelengths (detected by filters FL2 and FL3, as described in Materials and Methods). By performing this staining, we observed in both strains an increase in the percentage of dead cells during batch cultivation.
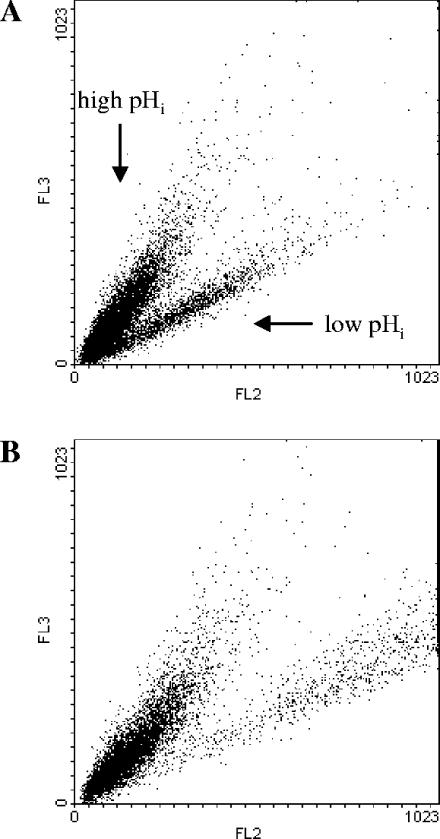
Moreover, combined analyses of pHi and viability were performed. In this case the fluorescence emission of cells stained with cSNARF-4F was compared to the fluorescence emission of the same sample of cells simultaneously stained with cSNARF-4F and ethidium bromide. For example, we report the results obtained with CEN.PK RWB876 cells harvested after 66 h. While staining with cSNARF-4F shows the presence of two distinct subpopulations, one with high pHi and one with low pHi (Fig. 2A), double staining showed that the subpopulation of cells with low pHi shifts to the right and upper part of the dot plot (Fig. 2B). This shift is due to the additional fluorescence emission of the ethidium bromide in channels FL2 and FL3, respectively. In fact, ethidium bromide fluorescence adds to cSNARF-4F fluorescence and increases the total fluorescence emission of the dead cells. The results showed that the cells with low pHi were dead.
FIG. 2.
Analysis of pHi and viability. (A) Fluorescence emission of cells of strain CEN.PK RWB876 stained with the pH-dependent probe cSNARF-4F. The fluorescence in FL2 (585 nm) is plotted against the fluorescence in FL3 (670 nm). This dot plot shows the presence of two subpopulations of cells with high and low pHi. (B) Fluorescence emission of the same sample of cells stained with cSNARF-4F and the viability probe ethidium bromide. Due to the additional fluorescence of ethidium bromide in FL2 and FL3, dead cells shift toward the right and upper part of the dot plot. This dot plot shows that the cells with low pHi are dead.
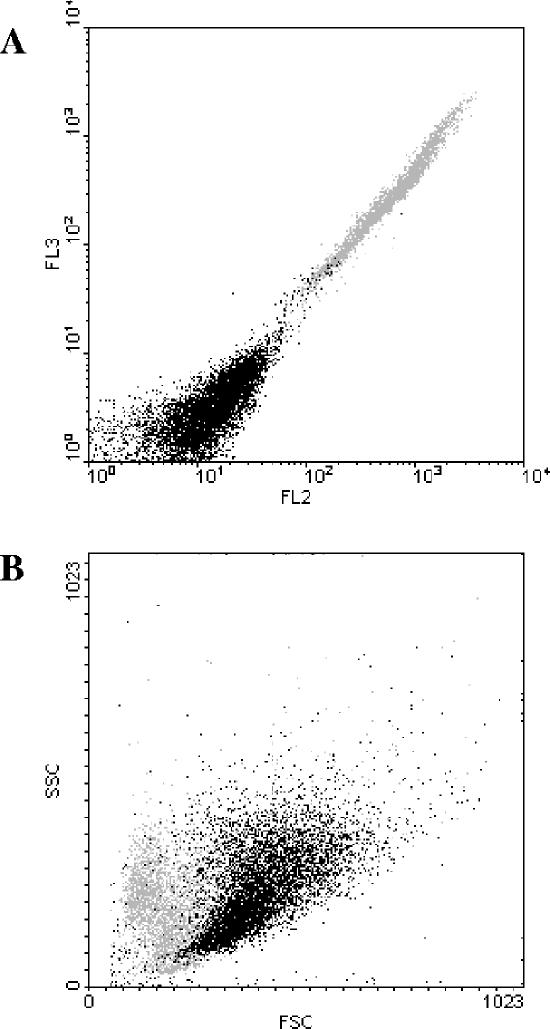
Additional information concerning the subpopulation of dead cells was obtained through analysis of the FSC, which is related to cell size, and the SSC, which is related to the internal granularity or complexity of the cell. Thus, a sample of CEN.PK RWB876 cells was stained with ethidium bromide and further analyzed. In order to determine the autofluorescence of the cells under study, a sample of unstained cells was also analyzed (data not shown). When the fluorescence emissions in FL2 and FL3 of the stained sample were plotted, two subpopulations were identified (Fig. 3A). The comparison between stained and unstained cells showed the presence of a subpopulation with a weak fluorescence signal that corresponds to the autofluorescence, thus identifying the viable cells, and a subpopulation with a high fluorescence signal (defined with a gray color), identifying the dead cells. When the FSC and SSC signals of the ethidium bromide-stained cells were plotted, we observed that the dead cells (gray color) localized together, creating a subpopulation of cells characterized by a smaller FSC signal than that of the viable cells (Fig. 3B). The same relation among pHi, viability, and FSC was observed during the analysis of samples of CEN.PK m850 cells (data not shown).
FIG. 3.
Analysis of dead cells. (A) Fluorescence emission of cells of strain CEN.PK RWB876 stained with ethidium bromide (acquisition in logarithmic scale). This dot plot shows the presence of two subpopulations of cells: one with low fluorescence (viable cells) and one with high fluorescence (dead cells). The dead cells are identified with a gray color. (B) FSC and SSC of the same sample. This dot plot shows that the dead cells identified in panel A (gray color) have a reduced volume.
The results showed that the dead cells appearing during the production of lactic acid have a low pHi and are smaller than the fraction of viable cells.
Design of a new strategy to improve lactic acid production.
Based on the observations that the better lactic-acid-producing strain has a higher pHi and that the cells belonging to the subpopulation with the higher pHi are the viable cells, we designed a new strategy aimed at the selection of cells that are better able to maintain the pHi during the production of lactic acid. The strategy was first tested on strain CEN.PK RWB876, which was unable to consume all of the glucose and consequently could produce a smaller amount of lactic acid.
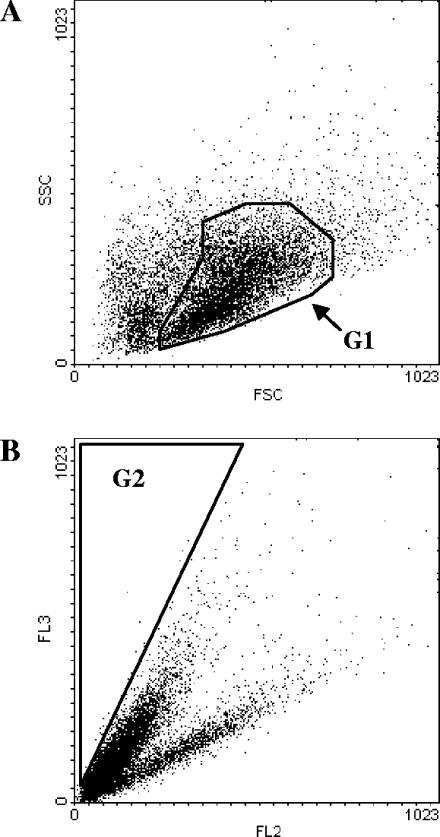
A UV-mutagenized population of strain CEN.PK RWB876 was cultivated in a batch culture with 70 g/liter of glucose, harvested after 65 h, stained with cSNARF-4F, and analyzed by flow cytometry. According to the results described above (Fig. 2 and 3), we defined two gates for cell sorting. Gate G1 was defined on the dot plot as FSC versus SSC in order to select the viable cells (Fig. 4A), and gate G2 was defined on the dot plot as FL2 versus FL3 in order to select the cells within the highest pHi range (Fig. 4B). Notably, gate G2 was defined in such a way as to include only a small percentage of cells (2 to 4%). Only the cells belonging to both gates were sorted and recovered in preinoculum medium. This preinoculum was then used to start a new batch culture, and after 65 h the cells were subjected to a further round of sorting. New gates were adjusted at every round of sorting. In all, three consecutive rounds of sorting were performed.
FIG. 4.
Definitions of the gates for cell sorting. (A) Gate G1 is designed in the dot plot of FSC versus SSC to include only viable cells. (B) Gate G2 is designed in the dot plot of FL2 versus FL3 to include the cells with the highest pHi.
After the last round, 5% of the sorted cells were plated to allow the isolation of individual mutants.
Analysis of mutants selected from strain CEN.PK RWB876.
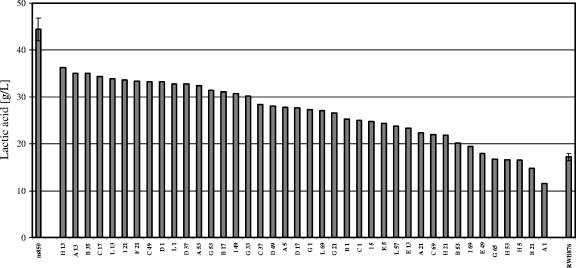
Screening of the mutants isolated from the sorting procedure was performed in 100-ml Erlenmeyer flasks instead of 250-ml baffled flasks. Forty mutants were analyzed in parallel with the parental strain CEN.PK RWB876 and strain CEN.PK m850 in batch cultures with 70 g/liter glucose. The cells were harvested after 70 h. The results showed that 85% of the selected mutants produced significantly more lactic acid than did the parental strain CEN.PK RWB876 (Fig. 5). Generally, lower lactic acid production was observed when the screening was performed with small volumes. For instance, strain CEN.PK RWB876 was able to produce 30 to 35 g/liter lactic acid in 250-ml shake flasks and only 18 g/liter in 100-ml shake flasks.
FIG. 5.
Screening of clones selected from strain CEN.PK RWB876. The lactic acid production of 40 clones harvested after 70 h is shown. Comparison with strain CEN.PK m850 (left bar) and the parental strain CEN.PK RWB876 (right bar) showed that 85% of the clones produced significantly more lactic acid than did the parental strain. The standard deviations for three and two independent batch cultures of strains CEN.PK m850 and CEN.PK RWB876, respectively, are indicated.
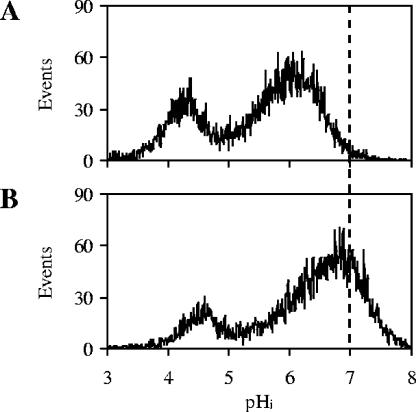
We further proceeded with the characterization of one mutant that falls in between the best and worst lactic acid producer, namely, strain G33. Batch culture with 70 g/liter glucose was performed and showed that after 70 h, strains CEN.PK RWB876 and G33 were able to produce 31 and 45 g/liter of lactic acid, respectively. Furthermore, analyses of pHi and viability showed that after 70 h, both strains have two subpopulations of cells: one with low pHi (dead cells) and one with high pHi (viable cells) (Fig. 6). Comparison of the two strains shows that while the subpopulations of dead cells have the same mean pHi values (4.3), the subpopulations of viable cells have mean pHi values of 6.0 and 6.4 in strains CEN.PK RWB876 and G33, respectively. Therefore, strain G33, which was identified for its improved lactic acid production, also has a higher pHi than the parental strain.
FIG. 6.
pHi distribution of strains CEN.PK RWB876 (A) and G33 (B). The strains were harvested after 70 h, and the pHi values of single cells were analyzed by flow cytometry through staining with the pH-dependent probe cSNARF-4F.
Analysis of mutants selected from strain CEN.PK m850.
The strategy of selection based on three consecutive rounds of sorting of viable cells with higher pHi was also applied to the better lactic-acid-producing strain, CEN.PK m850. As this strain is able to consume 70 g/liter of glucose, the UV-mutagenized population of strain CEN.PK m850 was cultivated in a batch with an increased glucose concentration, i.e., 100 g/liter of glucose.
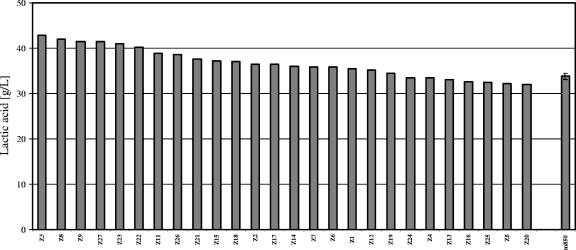
Screening of the mutants isolated from the sorting procedure was performed, as previously described, in 100-ml Erlenmeyer flasks. Twenty-seven mutants were analyzed in parallel with the parental strain CEN.PK m850 in batch cultures with 100 g/liter glucose. Supernatants were harvested after 70 h. The results showed that 65% of the mutants under screening had improved lactic acid production compared to the parental strain CEN.PK m850 (Fig. 7).
FIG. 7.
Screening of clones selected from strain CEN.PK m850. The lactic acid production of 26 clones harvested after 70 h is shown; 65% of the clones produced significantly more lactic acid than did the parental strain CEN.PK m850 (right bar). The standard deviation of three independent batch cultures of strain CEN.PK m850 is indicated.
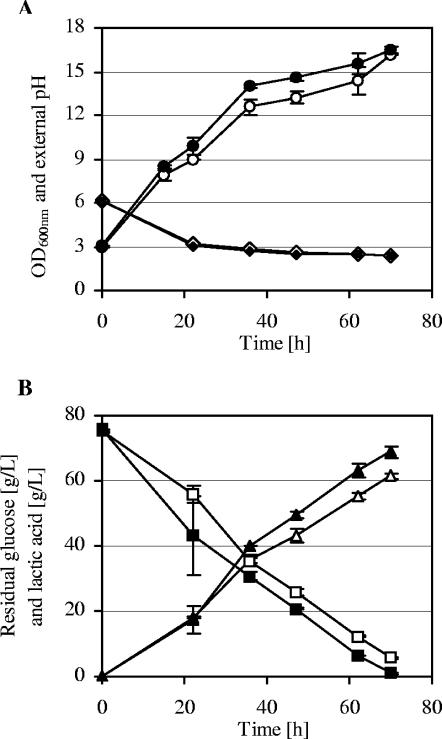
Further characterization in 250-ml shake flasks of some of the strains with improved lactic acid production highlighted the better performance of strain Z26. Batch cultures with 75 g/liter glucose showed that strain Z26 can reach a slightly higher optical density (OD600) than the parental strains (Fig. 8A). The same decrease in the external pH was observed for the two strains. The results showed that strain Z26 had, from the beginning of the batch culture, an advantage in the ability to consume glucose and produce lactic acid (Fig. 8B). This advantage allowed strain Z26 to consume 75 g/liter of glucose in 70 h, with a lactic acid production of 70 g/liter. In the same period of time, strain CEN.PK m850 could consume only 70 g/liter of glucose and produce just 62 g/liter of lactic acid. Statistical analyses of two independent experiments using Student's t test indicated that the differences in lactic acid production between the two strains were significant. The better performance of strain Z26 was shown also in batch cultures performed with 80 and 90 g/liter of glucose (data not shown). Although strain Z26 could produce more lactic acid than strain CEN.PK m850, similar pHi values for the two strains were determined (data not shown).
FIG. 8.
Batch cultures of strains CEN.PK m850 (empty symbols) and Z26 (filled symbols) with 75 g/liter of glucose. (A) OD600 (circles) and external pH (diamonds). (B) Residual glucose (squares) and lactic acid produced (triangles). Error bars indicate the standard deviations from two independent experiments.
DISCUSSION
In the present study, we analyzed two lactic-acid-producing strains of S. cerevisiae. With the aim of improving their lactic acid production, we first analyzed the strains in batch cultures with 70 g/liter glucose. Under this growth condition, we observed that strain CEN.PK m850 could produce 60 to 65 g/liter of lactic acid, while strain CEN.PK RWB876 could produce only 30 to 35 g/liter of lactic acid.
Analyses of the pHi, performed by flow cytometry (18), showed that along with lactic acid production and acidification of the medium, both strains undergo a reduction in mean pHi. To explain this result, it must be considered that when the medium is acidified below the pKa value of lactic acid (3.86), the lactic acid in the culture supernatant is mainly undissociated and can diffuse back through the plasma membrane. Once inside the cells, due to the presence of a more neutral environment, the acid dissociates, causing acidification of the cytosol. A similar explanation has been generally accepted to explain the intracellular acidification observed after incubation of yeast cells in acetic acid (5) or sorbic acid (3) and after perfusion of yeast cells with acetic acid (1, 10). Notably, it has been shown for S. cerevisiae that the decrease in pHi was dependent on the concentration of the undissociated acid (1).
Although both lactic-acid-producing strains showed a reduction in pHi during batch culture, we observed that the strain with the higher lactic acid production had always a higher pHi. In the literature, only few examples of pHi analyses in yeasts that exhibit different tolerances to weak organic acids have been reported. One example concerns the short-term pHi response to acetic acid (1). The authors showed that the yeast Z. bailii, well known for its higher tolerance to acetic acid, is better able to keep a constant pHi after perfusion with acetic acid solution than is S. cerevisiae. A second example concerns tolerance of lactic acid (11). In this case, batch culture at low pH in the presence of lactic acid and experiments on cell perfusion with a solution at low pH containing lactic acid were performed. In contrast to the inability of S. cerevisiae to grow under this condition and the strong decrease in its pHi after perfusion, Candida krusei was able to grow and to keep a constant pHi after perfusion.
Further information was obtained through analyses of the pHi distribution within the cell samples under study. The results showed that during batch cultivation the two strains undergo a shift from a homogeneous to a heterogeneous pHi distribution. Both strains show the appearance and subsequent enrichment of a subpopulation of cells characterized by low pHi. In previous work, we showed that a similar trend in the distribution of the pHi becomes visible after incubation of S. cerevisiae cells in buffers with progressively decreased pH values (18). In particular, we observed a different behaviors in cells harvested at different growth phases. The results showed that stationary-phase cells are better able than exponentially growing cells to maintain their pHi homeostasis with respect to changes in the external pH (18).
Moreover, we present here a first example of simultaneous analysis of pHi and viability in the yeast S. cerevisiae at the single-cell level by using flow cytometry. Notably, simultaneous staining with the probes cSNARF-4F and ethidium bromide proved that the cells belonging to the subpopulation with low pHi were dead. This fact was verified by using three additional viability probes (data not shown). This result is in good agreement with previous indications of a correlation between pHi and viability in yeast cells obtained by independent methods for the determination of pHi and viability (9, 12, 20). In contrast to our experiments, those authors performed the analyses with independent samples of cells and by different methods. Furthermore, we observed that dead cells are smaller than viable cells, probably as a consequence of cell shrinkage. Additional analyses are necessary for an understanding of this phenomenon, but we can suppose that this morphological change is related to the process of cell death. In support of our hypotheses, cell shrinkage has been observed in S. cerevisiae cells during sugar-induced apoptosis (8).
Based on the results obtained, we designed a strategy for the selection of cells that are better able to maintain pHi during the production of lactic acid. In order to increase the heterogeneity of the population, the experiment was performed starting with a UV-mutagenized population. In our strategy, UV mutagenesis was followed by three consecutive rounds of cell sorting, in which only the viable cells with the highest pHi were selected. By this procedure we obtained mutants with improved lactic acid production. Actually, production was improved in 85% of the tested mutants selected from strain CEN.PK RWB876. Although the level of lactic acid production of the CEN.PK m850 cells was not reached, we hypothesize that additional rounds of sorting could lead to further improvement in lactic acid production up to that level of performance. Moreover, to further prove our hypothesis we showed that strain G33, identified for its improved lactic acid production, also has a higher pHi than the parental strain.
Consequently, we screened mutants selected from strain CEN.PK m850 and obtained a strain with improved lactic acid production. The strain, namely Z26, was selected after three rounds of sorting of strain CEN.PK m850. It is important to emphasize that due to the ability of strain CEN.PK m850 to consume 70 g/liter of glucose, and in order to analyze it under stressed growth conditions, the batch cultures were performed with 100 g/liter of glucose instead of 70 g/liter as described for strain CEN.PK RWB876. The improved performance of strain Z26 was confirmed in batch cultures with different glucose concentrations, e.g., 75, 80, or 90 g/liter.
Comparison of the results obtained with the two strains showed that the better improvement in lactic acid production compared to the parental strain was obtained by sorting of strain CEN.PK RWB876. This result may be explained by considering that the performance of strain CEN.PK m850, previously selected for its acid resistance, is probably close to a limit.
In conclusion, we report here that through the selection of cells with higher pHi it is possible to identify improved lactic acid producers. To the best of our knowledge, we show for the first time that the ability of S. cerevisiae to produce large amounts of lactic acid is related to its ability to maintain a higher pHi. Evidently, additional experiments are now required to understand the mechanisms that underlie the ability of the strains with improved lactic acid production to better counteract the intracellular acidification induced by the lactic acid produced.
Furthermore, due to the common properties of weak organic acids, we believe that a similar strategy can be used to select mutants able to produce or tolerate large amounts of other weak organic acids and, more generally, compounds responsible for extracellular and intracellular acidification.
Acknowledgments
This work was supported by Tate and Lyle Americas, Decatur, Ill.
REFERENCES
- 1.Arneborg, N., L. Jespersen, and M. Jakobsen. 2000. Individual cells of Saccharomyces cerevisiae and Zygosaccharomyces bailii exhibit different short-term intracellular pH responses to acetic acid. Arch. Microbiol. 174:125-128. [DOI] [PubMed] [Google Scholar]
- 2.Bianchi, M. M., L. Brambilla, F. Protani, C. L. Liu, J. Lievense, and D. Porro. 2001. Efficient homolactic fermentation by Kluyveromyces lactis strains defective in pyruvate utilization and transformed with the heterologous LDH gene. Appl. Environ. Microbiol. 67:5621-5625. [DOI] [PMC free article] [PubMed] [Google Scholar]
- 3.Bracey, D., C. D. Holyoak, G. Nebe-von Caron, and P. J. Coote. 1998. Determination of the intracellular pH (pHi) of growing cells of Saccharomyces cerevisiae: the effect of reduced-expression of the membrane H+-ATPase. J. Microbiol. Methods 31:113-125. [Google Scholar]
- 4.Branduardi, P., M. Valli, L. Brambilla, M. Sauer, L. Alberghina, and D. Porro. 2004. The yeast Zygosaccharomyces bailii: a new host for heterologous protein production, secretion and for metabolic engineering applications. FEMS Yeast Res. 4:493-504. [DOI] [PubMed] [Google Scholar]
- 5.Branduardi, P., M. Sauer, L. De Gioia, G. Zampella, M. Valli, D. Mattanovich, and D. Porro. 2006. Lactate production yield from engineered yeasts is dependent from the host background, the lactate dehydrogenase source and the lactate export. Microb. Cell Fact. 5:4. [DOI] [PMC free article] [PubMed] [Google Scholar]
- 6.Carmelo, V., H. Santos, and I. Sa-Correia. 1997. Effect of extracellular acidification on the activity of plasma membrane ATPase and on the cytosolic and vacuolar pH of Saccharomyces cerevisiae. Biochim. Biophys. Acta 1325:63-70. [DOI] [PubMed] [Google Scholar]
- 7.Dequin, S., and P. Barre. 1994. Mixed lactic acid-alcoholic fermentation by Saccharomyces cerevisiae expressing the Lactobacillus casei L(+)-LDH. Biotechnology (New York) 12:173-177. [DOI] [PubMed] [Google Scholar]
- 8.Granot, D., A. Levine, and E. Dor-Hefetz. 2003. Sugar-induced apoptosis in yeast cells. FEMS Yeast Res. 4:7-13. [DOI] [PubMed] [Google Scholar]
- 9.Guadalupe Cabral, M., I. Sa-Correia, and C. A. Viegas. 2004. Adaptative responses in yeast to the herbicide 2-methyl-4-chlorophenoxyacetic acid at the level of intracellular pH homeostasis. J. Appl. Microbiol. 96:603-612. [DOI] [PubMed] [Google Scholar]
- 10.Guldfeldt, L. U., and N. Arneborg. 1998. Measurement of the effects of acetic acid and extracellular pH on intracellular pH of nonfermenting, individual Saccharomyces cerevisiae cells by fluorescence microscopy. Appl. Environ. Microbiol. 64:530-534. [DOI] [PMC free article] [PubMed] [Google Scholar]
- 11.Halm, M., T. Hornbaek, N. Arneborg, S. Sefa-Dedeh, and L. Jespersen. 2004. Lactic acid tolerance determined by measurement of intracellular pH of single cells of Candida krusei and Saccharomyces cerevisiae isolated from fermented maize dough. Int. J. Food Microbiol. 94:97-103. [DOI] [PubMed] [Google Scholar]
- 12.Imai, T., and T. Ohno. 1995. The relationship between viability and intracellular pH in the yeast Saccharomyces cerevisiae. Appl. Environ. Microbiol. 61:3604-3608. [DOI] [PMC free article] [PubMed] [Google Scholar]
- 13.Liu, C. L., and J. C. Lievense. May 2005. Lactic-acid-producing yeast. U.S. patent application 2005/0112737.
- 14.Narayanan, N., P. K. Roychoudhury, and A. Srivastava. 2004. L (+) lactic acid fermentation and its product polymerization. Electron. J. Biotechnol. 7(2):review. [Online.] http://www.ejbiotechnology.info/content/vol7/issue2/full/7/index.html (ISSN 0717-3458).
- 15.Porro, D., L. Brambilla, B. M. Ranzi, E. Martegani, and L. Alberghina. 1995. Development of metabolically engineered Saccharomyces cerevisiae cells for the production of lactic acid. Biotechnol. Prog. 11:294-298. [DOI] [PubMed] [Google Scholar]
- 16.Porro, D., M. M. Bianchi, B. M. Ranzi, L. Frontali, M. Vai, A. A. Winkler, and L. Alberghina. March 1999. Yeast strains for the production of lactic acid. International patent application WO 99/14335.
- 17.Porro, D., M. M. Bianchi, L. Brambilla, R. Menghini, D. Bolzani, V. Carrera, J. Lievense, C. L. Liu, B. M. Ranzi, L. Frontali, and L. Alberghina. 1999. Replacement of a metabolic pathway for large-scale production of lactic acid from engineered yeasts. Appl. Environ. Microbiol. 65:4211-4215. [DOI] [PMC free article] [PubMed] [Google Scholar]
- 18.Valli, M., M. Sauer, P. Branduardi, N. Borth, D. Porro, and D. Mattanovich. 2005. Intracellular pH distribution in Saccharomyces cerevisiae cell populations, analyzed by flow cytometry. Appl. Environ. Microbiol. 71:1515-1521. [DOI] [PMC free article] [PubMed] [Google Scholar]
- 19.van Maris, A. J., A. A. Winkler, D. Porro, J. P. van Dijken, and J. T. Pronk. 2004. Homofermentative lactate production cannot sustain anaerobic growth of engineered Saccharomyces cerevisiae: possible consequence of energy-dependent lactate export. Appl. Environ. Microbiol. 70:2898-2905. [DOI] [PMC free article] [PubMed] [Google Scholar]
- 20.Viegas, C. A., P. F. Almeida, M. Cavaco, and I. Sa-Correia. 1998. The H+-ATPase in the plasma membrane of Saccharomyces cerevisiae is activated during growth latency in octanoic acid-supplemented medium accompanying the decrease in intracellular pH and cell viability. Appl. Environ. Microbiol. 64:779-783. [DOI] [PMC free article] [PubMed] [Google Scholar]


