Abstract
The web program GeMprospector (URL: http://cgi-www.daimi.au.dk/cgi-chili/GeMprospector/main) allows users to automatically design large sets of cross-species genetic marker candidates targeting either legumes or grasses. The user uploads a collection of ESTs from one or more legume or grass species, and they are compared with a database of clusters of homologous EST and genomic sequences from other legumes or grasses, respectively. Multiple sequence alignments between submitted ESTs and their homologues in the appropriate database form the basis of automated PCR primer design in conserved exons such that each primer set amplifies an intron. The only user input is a collection of ESTs, not necessarily from more than one species, and GeMprospector can boost the potential of such an EST collection by combining it with a large database to produce cross-species genetic marker candidates for legumes or grasses.
INTRODUCTION
Comparative genetics allows the transfer of genetic information from one species to another. In legumes (Fabaceae), comparative genetics holds the promise to transfer information from well-studied genetic models, such as Lotus japonicus and Medicago truncatula, to some of the agriculturally very important, but genetically understudied legumes among the 18 000 species in this family (e.g. peas, beans, lentils, soybeans, peanuts). The family of grasses (Poaceae, also known as Gramineae) contains 10 000 species including rice, wheat, barley, maize and forage grasses; it is the only family of plants more important to humans than legumes. For grasses, the primary source of genetic information is rice.
Genetic markers, DNA polymorphisms between genomes of two mapping parents, are the work-horse of this information transfer by synteny. In order to detect polymorphisms at loci which can be placed at unique positions on the genetic maps of several related species, a polymorphism identification strategy which focuses on introns of highly conserved genes has been proposed [e.g. by Lyons et al. (1)].
We have built an automated bioinformatics pipeline for the identification of cross-species genetic marker candidates, as defined by sets of primer pairs for PCR amplification of introns, which we have used extensively to find family specific marker candidates in the legume and grass families (2). This paper presents a tool which lets the user compare his own legume or grass EST sequence data with the two respective databases built by our pipeline in order to find novel cross-species genetic marker candidates.
GeMprospector users should cite this paper and GeMprospector's URL (http://cgi-www.daimi.au.dk/cgi-chili/GeMprospector/main) in order to refer the program.
MATERIALS AND METHODS
The database holds gene indices (3), rice coding sequences and Arabidopsis peptides (4) from The Institute of Genomic Research, genomic Lotus sequences from The National Center for Biotechnology Information (NCBI) and genomic Medicago sequences from www.medicago.org. We use the Blast program package from NCBI (5) for sequence comparisons with the cut-off E-value 10−7 for sequence homology. PriFi (6), (http://nar.oxfordjournals.org/cgi/content/full/33/suppl_2/w516) is used for primer design; Clustalw is used to perform multiple alignments (with permission from the European Bioinformatics Institute website: http://www.ebi.ac.uk/clustalw/).
RESULTS
The preprocessing underlying GeMprospector
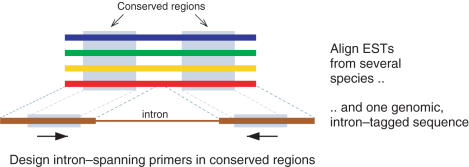
GeMprospector aims at identifying regions of sequence conservation across several related species that include at least one intron, and then design primers such that the segment containing the intron is amplified (Figure 1). This maximizes the chance that
The primers work for most species in the clade, including those for which no sequence information is available.
The PCR product contains a polymorphism making the locus a potential genetic marker.
Figure 1.
Aligning an intron-containing genomic sequence with several homologous gene indices and designing primers in conserved regions.
For our grass application of the pipeline we use genomic sequences from Oryza sativa (rice) and gene indices from Oryza sativa, Sorghum bicolor and Hordeum vulgare (barley). In the legume application, genomic sequences from L.japonicus and M.truncatula are used, but since these genomes are not completely sequenced yet, Arabidopsis thaliana is also included as a reference species. Gene index collections derive from L.japonicus, M.truncatula, Glycine max, Phaseolus vulgaris and Arachis spp. The pipeline follows steps i–iv listed below.
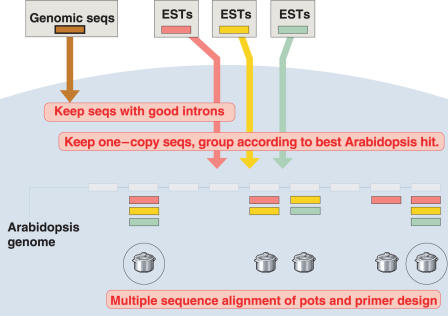
Markers are maximally useful if they define a unique genetic position. Since the currently available Lotus and Medicago genome sequences are incomplete, we cannot rule out that a given legume sequence has several copies in these two plants. To get a copy number estimate from a complete plant genome, legume gene indices are compared with the Arabidopsis proteome, and predicted single-copy gene indices from all species are indexed according to their best Arabidopsis hit. For grasses, all indices are blasted against the rice genome and single-copy sequences are kept, indexed by their rice homologue.
Relevant gene indices are compared against their genomes in order to identify sequences with introns (Lotus and Medicago in the legume application, rice in the grass application). Gene indices are intron-tagged at the corresponding positions. For legumes, these sequences are again indexed according to their best Arabidopsis hit.
Each group of homologous sequences (in case of the legumes, sequences with the same Arabidopsis index) is called a pot. This bisected multitude of pots is the underlying database of GeMprospector; some are legume pots, some are for grasses. Each pot contains one sequence with inserted intron tags plus one or several gene index sequences from the other species, all homologous to the same Arabidopsis or rice sequence.
Finally, our specially designed software PriFi (6) is batch-run on all pots, first creating multiple alignments and then suggesting primers which fulfill the requirements in terms of conservation, intron length, melting temperature, etc. Forcing the primers to span an intron increases the chance of a polymorphic amplicon due to the lower selection pressure on introns—and hence increases the chance that the primers and amplicon constitute a genetic marker.
The legume version of the pipeline is diagrammed in Figure 2. Only some of the multiple sequence alignments yield marker candidates (marked by circles in Figure 2). The remaining alignments did not allow the design of valid primer pairs. Given new sequence information, these ‘dormant’ alignments may well become ‘activated’ and yield further marker candidates.
Figure 2.
The legume version of the pipeline underlying GeMprospector. See text.
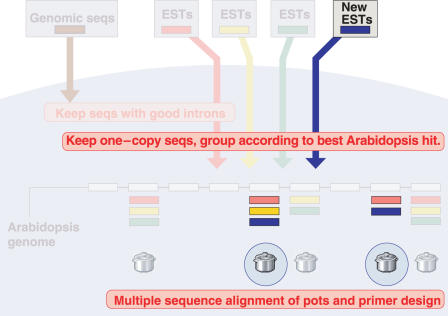
Here we present the tool GeMprospector. GeMprospector acts against the backdrop of this preassembled database. The user submits a set of ESTs (legume or grass) in Fasta format, and these ESTs undergo the same analysis as each of the above mentioned gene index collections, as shown in Figure 3. The submitted ESTs are drawn in blue; they are compared with the Arabidopsis proteome/rice genome, respectively, and non-rejected sequences are merged with the appropriate database sequences and subjected to PriFi. If the new sequences add sufficient information to some of the ‘dormant’ alignments, for example by raising the conservation score, valid primer pairs can now be produced and hence new marker candidates are found (marked by circles), each incorporating one of the uploaded sequences and data from the underlying database. Primers and associated information are reported to the user. In other words, the GeMprospector tool allows new ESTs from one species to drive the design of genetic markers for many species.
Figure 3.
Running GeMprospector with new legume ESTs. Two dormant alignments give rise to new candidate markers because of the uploaded ESTs.
The web interface
The main page of the GeMprospector website is very simple. The user must upload a Fasta file of ESTs (or choose the available demo file), click either the legume or grass database, and start the analysis. There is also a link to the tool documentation (‘About this tool’).
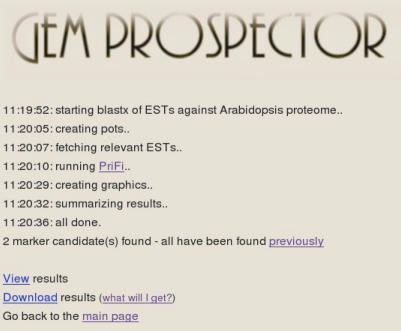
After submitting the sequences, the user is taken to a new page which dynamically reports the current step of the process, automatically reloading at suitably increasing intervals depending on the job size. When the analysis is complete, a summary tells the number of novel marker candidates found and offers links to view and download the results (Figure 4).
Figure 4.
Screen shot displaying the analysis progress and summary.
Viewing results
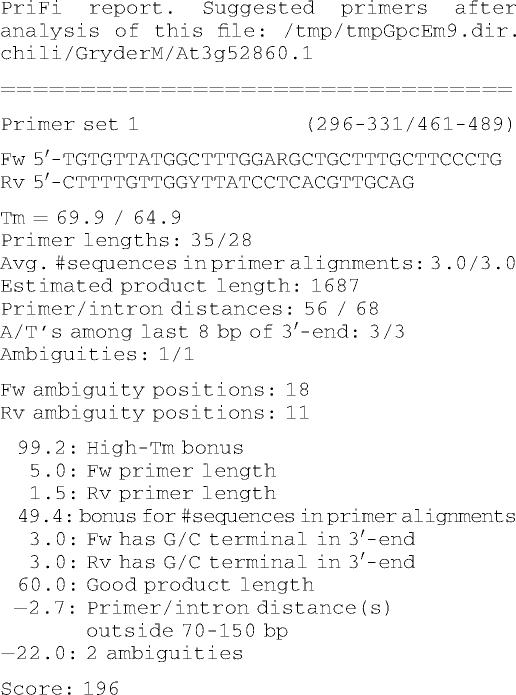
Clicking ‘View’ takes the user to a tabular view of the results (Figure 6). The column headers of the table are ID of the marker candidates, best Arabidopsis/rice homolog, forward and reverse primers, PriFi score, and annotation of the Arabidopsis/rice homologue. By clicking (some of) the headers, the user can sort the table based on various criteria, e.g. the PriFi score (expected quality) of the primer pair. In the results table, the score serves as a link to a report with detailed information about the corresponding primers. The report may hold up to three alternative primer suggestions. Below is an example [for details on PriFi primer reports, see (6)]:
 |
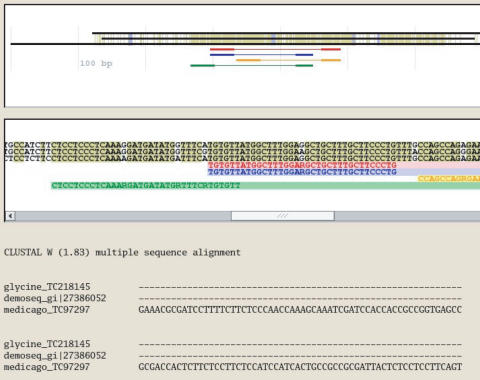
The ID string of each marker candidate serves as a link to a display of the multiple sequence alignment underlying the marker candidate, including the position of the suggested primers and intron(s). The alignment is shown both as multi-colored sequences of letters and gaps, as a multi-color line sketch for quickly overviewing conserved regions (highlighted in olive-green) and primer placements, and as a ClustalW alignment (Figure 5).
Figure 5.
Displaying the alignment underlying a marker candidate, including suggested primers.
The results can also be downloaded as a zipped file containing the same information as the results table.
Running time
The running time of GeMprospector depends on the combined length of the uploaded sequences, and on how many markers are found. For the demonstration file containing five legume sequences of 3 kilobases combined length, the complete analysis takes ∼40 s. Running GeMprospector on our unpublished collection of 1081 Arachis hypogaea EST clusters (total 0.6 megabases, file size 641 KB) took 5 min against the legume database. For the full set of 9484 P. vulgaris gene indices (total 6.3 megabases, file size 7.2 MB) against the legume database, the analysis was completed in 46 min. Finally, we also compared a set of 7205 gene indices from maize (total 5.5 megabases, file size 6.1 MB) against the grass database which took 1 h and 19 min (see Table 1). Currently, to limit the work load on our server for the benefit of other users, there is a file size maximum of 10 MB.
Table 1.
Analysis times for four particular runs with different EST collections
| Uploaded data | Database | Sequences | Nucleotides | File size (bytes) | Markers found | Analysis time |
|---|---|---|---|---|---|---|
| Website test file | legumes | 5 | 2954 | 3130 | 2 | 40 s |
| Arachis EST clusters | legumes | 1081 | 6 14 424 | 640 916 | 11 | 5 min |
| Phaseolus GIs | legumes | 9484 | 6 344 504 | 7 187 446 | 117 | 46 min |
| Maize GIs | grasses | 7205 | 5 482 827 | 6 067 588 | 312 | 79 min |
DISCUSSION
GeMprospector is a specialized tool for the design of cross-species marker candidates using user-submitted sequence data originating either from the legume family or the grass family; as the user data are merged with a database of groups of intra-homologous sequences, submitted ESTs from only one species can still produce cross-species marker candidates. When mapped, such cross-species markers will allow information transfer through syntenic relationships between important crop- and model-plants.
Any new primer pair proposed by GeMprospector will have a very high probability of amplifying an intron in the species of the submitted sequences. The primer pair is also likely to amplify introns of any other species within the clade of sequence representation. Furthermore the primer pair will be an educated guess in order to amplify introns in species which are outside of the clade of the represented sequence. For example, we have currently designed 459 cross-species marker candidates in legumes; so far, 76 of these have been tested resulting in the successful development of 56 markers in the ‘in-group’ bean and 43 in the ‘out-group’ peanut (2).
We have chosen the legume and grass families because of the availability of genomic sequences from the well-studied rice, Lotus japonicus and Medicago truncatula, and because of the enormous importance of these families to humans (7). In principle, non-legume or -grass ESTs might also align, but they are likely prohibitively different from the database gene indices to allow multiple sequence alignments of sufficient quality to pass through PriFi’s primer design requirements.
Our focus here is on family-wide anchor primer design, i.e. primers with potential to amplify sequences from distantly related members of the same plant family. Longer primers are expected to be less sensitive to any mismatches between primer and target which are likely to occur in this setup, and therefore, with the current settings GeMprospector suggests primers with accepted lengths between 18 and 35 nt. For our legume database, the average primer length is 29.5 nt; for the grasses, it is 28.7 nt.
We are planning a future GeMprospector version whose databases include maize and wheat, species for which large EST collections also exist. This will certainly lead to any additional markers, but with a potentially more narrow application. We imagine a comprehensive tool which lets the user pick individual species from a given set and combine their sequences with his own uploaded set in a ‘user-designed’ database, targeting the results to the user's specific needs.
GeMprospector allows maximal information gain from new legume/grass EST sequence collections when designing candidate cross-species genetic markers. Results of an analysis are only accessible to the submitting user.
Figure 6.
How the results are displayed.
Acknowledgments
The authors thank the Danish Agricultural and Veterinary Research Council for support. L.S. is supported by the Danish Research Council for Nature and Universe. J.F. is supported by the Danish Agricultural and Veterinary Research Council. B.K.H. is funded by the Council for Development Reasearch (RUF) under the Danish Ministry of Foreign Affairs, project number 91210. The authors also thank the European Union INCO Programme (ARAMAP, reference: ICA4-2001-10072), and the Generation Challenge Program for financial support. Funding to pay the Open Access publication charges for this article was provided by Council for Development Research.
Conflict of interest statement. None declared.
REFERENCES
- 1.Lyons L.A., Laughlin T.F., Copeland N.G., Jenkins N.A., Womack J.E., O’Brien S.J. Comparative anchor tagged sequences (CATS) for integrative mapping of mammalian genomes. Nature Genet. 1997;15:47–56. doi: 10.1038/ng0197-47. [DOI] [PubMed] [Google Scholar]
- 2.Fredslund J., Madsen L.H., Hougaard B.K., Nielsen A.M., Bertioli D., Sandal N., Stougaard J., Schauser L. A general strategy for the development of anchor markers for comparative genomics in plants. (under review) 2006. [DOI] [PMC free article] [PubMed] [Google Scholar]
- 3.Quackenbush J., Cho J., Lee D., Liang F., Holt I., Karamycheva S., Parvizi B., Pertea G., Sultana R., White J. The TIGR Gene Indices: analysis of gene transcript sequences in highly sampled eukaryotic species. Nucleic Acids Res. 2001;29:159–164. doi: 10.1093/nar/29.1.159. [DOI] [PMC free article] [PubMed] [Google Scholar]
- 4.Haas B.J., Wortman J.R., Ronning C.M., Hannick L.I., Smith R.K., Jr, Maiti R., Chan A.P., Yu C., Farzad M., Wu D., et al. Complete reannotation of the Arabidopsis genome: methods, tools, protocols and the final release. BMC Biol. 2005;3:7. doi: 10.1186/1741-7007-3-7. [DOI] [PMC free article] [PubMed] [Google Scholar]
- 5.Altschul S.F., Gish W., Miller W., Myers E.W., Lipman D.J. Basic local alignment search tool. J. Mol. Biol. 1990;215:403–410. doi: 10.1016/S0022-2836(05)80360-2. [DOI] [PubMed] [Google Scholar]
- 6.Fredslund J., Schauser L., Madsen L.H., Sandal N., Stougaard J. PriFi: using a multiple alignment of related sequences to find primers for amplification of homologs. Nucleic Acids Res. 2005;33:W516–W520. doi: 10.1093/nar/gki425. [DOI] [PMC free article] [PubMed] [Google Scholar]
- 7.Graham P.H., Vance C.P. Legumes: importance and constraints to greater use. Plant Physiol. 2003;131:872–877. doi: 10.1104/pp.017004. [DOI] [PMC free article] [PubMed] [Google Scholar]


