

Abstract
Photodynamic therapy is a promising antitumor treatment modality approved for the management of both early and advanced tumors. The mechanisms of its antitumor action include generation of singlet oxygen and reactive oxygen species that directly damage tumor cells and tumor vasculature. A number of mechanisms seem to be involved in the protective responses to PDT that include activation of transcription factors, heat shock proteins, antioxidant enzymes and antiapoptotic pathways. Elucidation of these mechanisms might result in the design of more effective combination strategies to improve the antitumor efficacy of PDT. Using DNA microarray analysis to identify stress-related genes induced by Photofrin-mediated PDT in colon adenocarcinoma C-26 cells, we observed a marked induction of heme oxygenase-1 (HO-1). Induction of HO-1 with hemin or stable transfection of C-26 with a plasmid vector encoding HO-1 increased resistance of tumor cells to PDT-mediated cytotoxicity. On the other hand, zinc (II) propoporphyrin IX, an HO-1 inhibitor, markedly augmented PDT-mediated cytotoxicity towards C-26 and human ovarian carcinoma MDAH2774 cells. Neither bilirubin, biliverdin nor carbon monoxide, direct products of HO-1 catalysed heme degradation, was responsible for cytoprotection. Importantly, desferrioxamine, a potent iron chelator significantly potentiated cytotoxic effects of PDT. Altogether our results indicate that HO-1 is involved in an important protective mechanism against PDT-mediated phototoxicity and administration of HO-1 inhibitors might be an effective way to potentiate antitumor effectiveness of PDT.
Keywords: photodynamic therapy, Photofrin, heme oxygenase, cancer
Introduction
Photodynamic therapy (PDT) is among the most promising cancer treatment regimens that appeared in the last decades in clinical oncology (McBride, 2002). It consists of laser light, a photosensitizer and molecular oxygen that are harmless to the cells alone but highly cytotoxic when combined together (Dougherty et al., 1998). PDT has been approved for clinical use with both palliative as well as curative intents. It is registered in USA, Canada, Japan and most EU countries for the management of lung, esophageal, laryngeal, urinary bladder and stomach cancers (McBride, 2002). The mechanisms of antitumor activity of PDT result from the combination of direct effects on tumor cells, destruction of blood vessels and activation of inflammatory and immune responses (Dougherty et al., 1998; Castano et al., 2004; Nowis et al., 2005). Molecular mechanisms of photodynamic action result from generation of oxidative stress. In the presence of molecular oxygen, light of appropriate wavelength excites the photosensitizer that undergoes two types of reactions. In type 1 reactions, excited photosensitizer reacts directly with organic cellular substrates to form radical anions or radical cations that may react further with molecular oxygen to produce reactive oxygen species (ROS). In type 2 reactions, the excited photosensitizer transfers its energy directly to oxygen (already a triplet in its ground state) to form highly reactive but short-lived singlet oxygen (1O2) (Sharman et al., 2000; Castano et al., 2004).
Type 1 reactions lead to generation of superoxide anions , which can be enzymatically converted into hydrogen peroxide and oxygen in a reaction catalysed by superoxide dismutase (SOD). Superoxide anions can also be donors of electrons to reduce metal ions (such as ferric ion, Fe3+) that catalyse conversion of H2O2 into hydroxyl radical (HO•) and hydroxide ion (HO−) in a Fenton reaction. Singlet oxygen and ROS are oxidizing molecules that readily react with biological molecules. They can oxidatively modify selected amino-acid residues, unsaturated lipids or damage DNA (Bachowski et al., 1994; Grune et al., 2001; Woods et al., 2004). If unrepaired, those PDT-generated lesions in cellular biomolecules lead to cell death in a necrotic or apoptotic mechanism. In a clinical setting, those tumor regions that contain the highest photosensitizer concentrations and receive maximal light fluence undergo necrosis and apoptosis. At less optimal conditions, PDT-treated cells initiate rescue responses that help them cope with oxidative stress.
Because of limited light penetration through tissues (resulting from its absorption, scattering and reflection), the antitumor effects of PDT are limited to just a few centimeters. Deeper layers of the tumor receive light doses that are ineffective to fully excite the photosensitizers. Sublethal damage to tumor cells and the vasculature is therefore readily managed by constitutive or induced protective mechanisms. The surviving cells might be the cause of relapse rendering the treatment less effective. Therefore, elucidation of these protective mechanisms, molecular changes in the treated cells as well as identification of drugs that might interfere with rescue responses becomes an important area of investigation.
Eukaryotic cells developed a number of constitutive as well as inducible protective mechanisms that help them cope with stress conditions, including heat, excessive oxidizing stress, hypoxia, exposure to toxic compounds or changes in osmolarity. Some of these mechanisms have been shown to play a role in protection against PDT (Almeida et al., 2004). For example, PDT-mediated oxidative stress initiates transient induction of early-response genes encoding transcription factors (c-jun, c-fos, egr-1, c-myc) (Luna et al., 1994; Kick et al., 1996), activation of transcription factors involved in cytoprotection (NF-κB) (Granville et al., 2000), and heat shock proteins (Hsp27, Hsp60, Hsp70, Hsp90 and Grp78) (Gomer et al., 1996; Wang et al., 2002; Jalili et al., 2004). Additionally, to some extent, PDT is also antagonized by cellular antioxidant defense mechanisms, including the glutathione system, manganese superoxide dismutase (Mn-SOD), catalase or lipoamide dehydrogenase (Kliukiene et al., 1997; Golab et al., 2003; Dolgachev et al., 2005; Oberdanner et al., 2005). Other mechanisms that protect tumor cells against PDT-mediated damage include stabilization of hypoxia-inducible factor alpha (Ferrario et al., 2000; Koukourakis et al., 2001), activity of antiapoptotic Bcl-2 proteins (Granville et al., 1999; Srivastava et al., 2001), induction of cyclooxygenases-2 (COX-2) (Ferrario et al., 2002; Hendrickx et al., 2003), activation of several signal transduction pathways including protein kinase C (Rasch et al., 1997), Etk/Bmx tyrosine kinase (Xue et al., 1999) or protein kinase B (PKB/Akt) (Zhuang and Kochevar, 2003).
Oligonucleotide microarrays are used to analyse RNA expression levels of multiple of genes simultaneously. They seem to be a sensitive and comprehensive approach to investigate the cellular response of tumor cells to PDT and a powerful method for the initial screening of genes that might be involved in inducible protective mechanisms facing cellular damage (Verwanger et al., 2002; Wang et al., 2002; Makowski et al., 2003; Wild et al., 2005). Therefore, the aim of our studies was to screen for genes induced by PDT and to select those that could potentially be targeted in combination treatment with selective inhibitors.
Results
PDT induces expression of heme oxygenase-1
Using Atlas Mouse Stress Array, we have previously identified that only a few genes appear to be upregulated 2 h following PDT in colon adenocarcinoma (C-26) cells. The genes with at least twofold upregulation included aldehyde dehydrogenase (ALDH4), RhoB, cytochrome P450 (CYP 3A25), COX-2 and heme oxygenase-1 (HO-1) (Makowski et al., 2003). Radioactively labeled cDNA of PDT-treated and untreated control tumor cells were hybridized to Atlas Mouse Stress Array and processed as described in Materials and methods. Again, we observed a marked induction of HO-1 gene, already detectable at 1 h after PDT, reaching maximum 2 h after treatment and a lower, albeit still higher level than in controls after 4 h (Figure 1a). In agreement with microarray studies, we observed a time-dependent induction of HO-1 protein levels that peaked 8 h following PDT in C-26 and after 9 h in human ovarian carcinoma MDAH2774 cells (Figure 1b). Increased levels of HO-1 in C-26 cells were also observed using immunofluorescence microscopy (Figure 1c). Even stronger and faster induction of HO-1 was observed after illumination of C-26 and EMT6 cells incubated in the presence of Verteporfin, another photosensitizer (Figure 1d).
Figure 1.

PDT induces the expression of HO-1 in tumor cells. (a) C-26 cells were exposed to 10 μg/ml Photofrin for 24 h and then to 6.0 kJ/m2 light. After 1, 2 or 4 h, [33P]-labeled cDNA probes generated from poly(A)+ RNA from control and Photofrin-based PDT-treated C-26 cells were hybridized to a nylon array containing 140 mouse stress response genes. Enlarged windows point to HO-1 gene. The far left line is the internal control of the microarray assay. (b) C-26 and MDAH 2774 cells were treated with PDT as described above and incubated for indicated times. Total cell lysates were prepared, and Western blot analysis was performed using anti-HO-1 or anti-α-tubulin antibodies. (c) Indirect immunofluorescence microscopy was performed using a laser scanning confocal microscope. C-26 cells treated with PDT as described above. After 8 h, the cells were stained with an antibody against HO-1. (d) C-26 and EMT6 cells were exposed to 5 μg/ml Verteporfin for 1 h and then to 6.0 kJ/m2 light and incubated for indicated times. Total cell lysates were prepared, and Western blot analysis was performed using anti-HO-1 or anti-α-tubulin antibodies.
Overexpression of HO-1 correlates with resistance to PDT in vitro and in vivo
Both C-26 and MDAH2774 cells are relatively sensitive to PDT in vitro. We have also identified two cell lines that are either highly resistant (mouse mammary carcinoma EMT6 cells) or extremely sensitive (mouse skin carcinoma RT101 cells) to cytotoxic effects of PDT in vitro (Figure 2). Using PDT regimens causing approximately the same cytotoxicity (60%) (Photofrin at 10 μg/ml, light at a fluence of 4.5 kJ/m2 RT101 and 18 kJ/m2 for EMT6 cells), we observed that in PDT-resistant EMT6 cells the expression level of HO-1 is significantly higher at 8 h (Figure 2) and remains elevated for at least 48 h (not shown) than in highly sensitive RT101 cells. Note, that at these defined PDT conditions about 60% of RT101 cells are killed, while similar cytotoxic effects are obtained in EMT6 cells using at least threefold higher light doses. Because correlative data obtained with different cell lines are never fully compelling, we decided to upregulate the level of HO-1 in C-26 cells using hemin, an endogenous inducer of this enzyme. As shown in Figure 3a, 24 h incubation of C-26 cells with hemin at non-toxic concentrations of 5 and 10 μm resulted in increased levels of HO-1 (Figure 3a). C-26 cells preincubated with hemin for 24 h were significantly more resistant to PDT in vitro (Figure 3b). For example, at 4.5 kJ/m2 PDT induced killing of 50% of cells, whereas preincubation with 10 μm hemin decreased PDT-mediated cytotoxicity to 26%.
Figure 2.
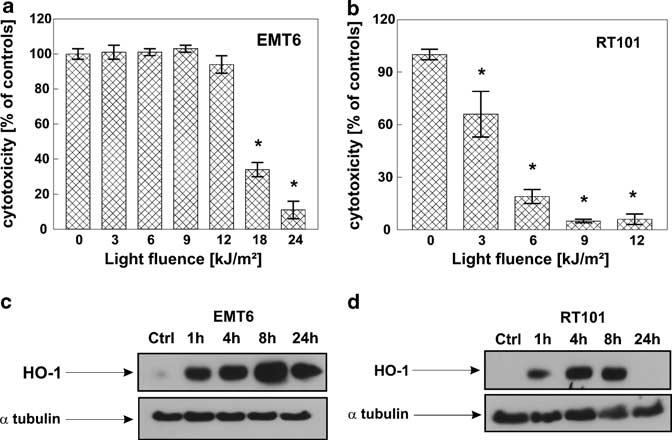
Higher HO-1 expression after PDT correlates with resistance to PDT treatment. Two different murine cell lines EMT6 (a) and RT101 (b) were seeded onto 35 mm plates at the concentration of 2.5 × 10⁵ cells/3 ml/dish, incubated for 24 h with 10 μg/ml Photofrin and then exposed to different doses of light, 3–24 kJ/m2 for EMT6 cells and 3–12 kJ/m2 for RT101 cells. Immediately after PDT, cells were trypsinized and seeded onto 96-well plate in the dilution of 1:50 in eight repeats. Following 24 h of incubation, the cytotoxic effects were measured by crystal violet staining. The bars represent percent cytotoxicity versus untreated controls. Data refer to mean±s.d. *P<0.03 versus controls (Student's t-test). EMT6 (c) and RT101 (d) cells were exposed to 10 μg/ml Photofrin for 24 h and then to different light doses, resulting in 60% cytotoxicity, according to the crystal violet staining test results. Namely, EMT6 cells were exposed to light fluence of 18 kJ/m2, whereas RT101 cells to 4.5 kJ/m2. After indicated times of incubation, total cell lysates were prepared, and Western blot analysis was performed using anti-HO-1 or anti-α-tubulin antibodies.
Figure 3.
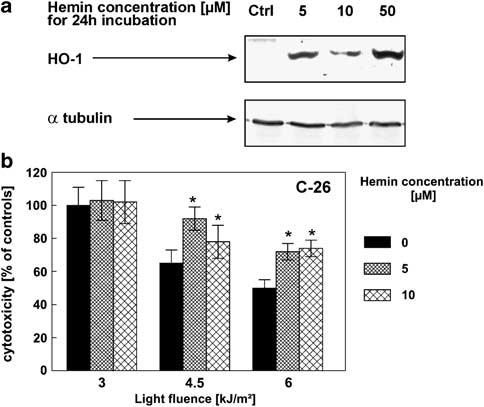
Hemin-induced expression of HO-1 protects C-26 cells against PDT-mediated cytotoxicity. (a) C-26 cells were incubated for 24 h with indicated concentrations of hemin. Then, total cell lysates were prepared, and Western blot analysis was performed using anti-HO-1 or anti-α-tubulin antibodies. (b) C-26 cells were seeded onto 35 mm plates at the concentration of 2.5 × 10⁵ cells/3 ml/dish and pretreated with 10 μg/ml Photofrin and 5 or 10 μm concentration of hemin. After 24 h of incubation, the cells were illuminated with a 50 W sodium lamp with a light filtered through a red filter. Immediately after PDT, cells were trypsinized and seeded onto 96-well plate in the dilution of 1:50 in eight repeats. Fresh medium containing hemin at the indicated concentrations was added. Following 24 h of incubation, the cytotoxic effects were measured by crystal violet staining and are expressed as mean±s.d. *P<0.05 versus PDT only treated cells (Student's t-test).
To further verify the role of HO-1 in the response of tumor cells to PDT, we stably transfected C-26 cells with a plasmid vector encoding murine HO-1 (a mixture of clones are referred to as C-26-B6 cells) or with an empty plasmid vector (C-26-pcDNA3 cells). These latter cells expressed higher levels of basal HO-1 protein than untransfected controls (compare Figure 4b and Figure 1b). This effect might result from G418-mediated stimulation of HO-1 expression as reported previously (Shiraishi et al., 2001). The stably transfected C-26-B6 cells expressed higher levels of constitutive HO-1, measured by both enzyme-linked immunosorbent assay (ELISA) (Figure 4a) and Western blotting (Figure 4b) and were significantly more resistant to PDT cytotoxi-city at all investigated light fluences (Figure 4c) as compared to mock-transfected cells. For example, at a fluence of 4.5 kJ/m2 PDT induced killing of 46% of control and 51% of mock-transfected C-26, whereas only 15% of HO-1-transfected cells. Tumors that formed after inoculation of C-26-B6 cells into syngeneic BALB/c mice responded with initial equal sensitivity to PDT as tumors that formed after inoculation of wild-type or mock-transfected cells. Nonetheless, the antitumor effects of PDT seemed to persist slightly slower, as C-26-B6 tumors started to regrow earlier than tumors formed after inoculation of wild-type or mock-transfected cells (Figure 4d).
Figure 4.

C-26 cells overexpressing HO-1 are less sensitive to PDT treatment both in vitro and in vivo. (a) C-26 cells were stably transfected with a control plasmid (C-26-pcDNA3) or plasmid containing HO-1 (C-26-B6). The bars represent expression level of HO-1 in cell lysates of C-26-pcDNA3 cells and C-26-B6 cells measured by ELISA and expressed as mean concentration (pg/ml)±s.d. (b) C-26-pcDNA3 and C-26-B6 cells were exposed to 10 μg/ml Photofrin for 24 h and then to 6.0 kJ/m2 light and incubated for 8 h. Total cell lysates were prepared, and Western blot analysis was performed using anti-HO-1 or anti-α-tubulin antibodies. (c) C-26, C-26-pcDNA3 and C-26-B6 cells were seeded onto 35 mm plates at the concentration of 2.5 × 10⁵ cells/3 ml/dish, incubated for 24 h with 10 μg/ml Photofrin and then exposed to different doses of light, from 3 to 12 kJ/m2. Immediately after PDT, cells were trypsinized and seeded onto 96-well plate in the dilution of 1:50 in eight repeats. Following 24 h of incubation, the cytotoxic effects were measured by crystal violet staining. The bars represent percent cytotoxicity versus untreated controls, different for each separate cell line. Data refer to mean±s.d. * P<0.05 versus nontransfected controls and C-26 cells transfected with empty vector (Student's t-test). (d) BALB/c mice were inoculated with 1 × 10⁶ C-26, C-26-pcDNA3 or C-26-B6 cells into the right hindlimb. Photofrin™ was administered intraperitoneally at a dose of 10 mg/kg on fifth day after inoculation of tumor cells and 24 h later, the tumor site was illuminated with a laser light at a dose of 120 J/m2. Measurements of tumor diameter were started on fifth day of the experiment and were performed every 2 days. The graph represents the influence of the PDT treatment on the growth of C-26 tumors (n = 8–9).
To verify whether HO-1 is a ‘druggable’ target for the combination treatment, we performed in vitro PDT with or without a HO-1 inhibitor, Zn(II) protoporphyrin IX (Zn(II)PPIX). In a microplate assay with crystal violet staining using C-26 and MDAH2774 cells and in clonogenic assay with MDAH2774 cells (C-26 do not form colonies that precludes the clonogenic assay), we observed that Zn(II)PPIX potentiates the cytotoxic effects of PDT (Figure 5a-c). For example, for C-26, PDT at 4.5 kJ/m2 induced killing of 40% of cells, and this effect was potentiated by Zn(II)PPIX to 71%. In MDAH 2774 cells, PDT at 4.5 kJ/m2 killed 56% of cells, and in combination with Zn(II)PPIX over 80% of cells were killed. In a separate experiment, we have shown that Zn(II)PPIX itself is not a photosensitizer, as at a concentration of 2.5 μm and a light fluence of 6 kJ/m2 it did not photosensitize the cells (Figure 5d).
Figure 5.
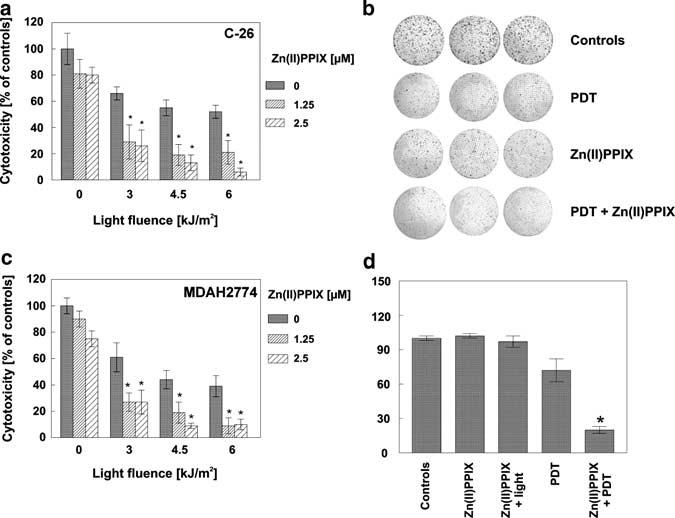
Zn(II)PPIX, an HO-1 competitive inhibitor, potentiates cytotoxic activity of PDT in vitro. C-26 (a) and MDAH2774 (c) cells were seeded onto 35 mm plates at the concentration of 2.5 × 10⁵ cells/3 ml/dish and incubated for 24 h with 10 μg/ml Photofrin and/or 1.25 or 2.5 μm concentration of Zn(II)PPIX. After 24 h of incubation, the cells were exposed to different doses of light, from 3 to 6 kJ/m2. Immediately after PDT, cells were trypsinized and seeded onto 96-well plate in the dilution of 1:50 in eight repeats. Fresh medium containing Zn(II)PPIX was added. Following 24 h of incubation, the cytotoxic effects were measured by crystal violet staining. The bars represent percent cytotoxicity versus untreated controls. Data refer to mean±s.d. * P<0.03 versus PDT only treated cells (Student's t-test). (b) For the clonogenic assay, MDAH 2774 cells were plated at a concentration of 2.5 × 10⁵ cells/3 ml/dish. On the next day, 10 μg/ml Photofrin and/or 2.5 μm concentration of Zn(II)PPIX was added for 24 h of incubation. On the following day, the cells were illuminated with a light dose of 6 kJ/m2, delivered by a 50-W sodium lamp with a light filtered through a red filter. Immediately after PDT, cells were trypsinized and seeded onto 35 mm plates in triplets at the concentration of 1 × 10³ cells per dish. Medium containing Zn(II)PPIX was replaced daily for 6 consecutive days. On day 14 after PDT, the plates were fixed with methanol and stained with crystal violet. (d) C-26 cells were seeded onto 35 mm plates at the concentration of 2.5 × 10⁵ cells/3 ml/dish and incubated for 24 h with 10 μg/ml Photofrin and/or 2.5 μm concentration of Zn(II)PPIX. After 24 h of incubation, the cells were illuminated with a light at a dose of 6 kJ/m2. Immediately after PDT, cells were trypsinized and seeded onto 96-well plate in the dilution of 1:50 in eight repeats. Fresh medium containing Zn(II)PPIX was added. Following 24 h of incubation, the cytotoxic effects were measured by crystal violet staining. The bars represent percent cytotoxicity versus untreated controls. Data refer to mean±s.d. *P<0.05 versus PDT only treated cells (Student's t-test).
Role of HO-1 downstream mediators in PDT resistance
HO-1 catalyses oxidative degradation of heme to produce biliverdin (rapidly converted to bilirubin by biliverdin reductase), carbon monoxide (CO) and iron (Wagener et al., 2003). Because all these products were shown to play cytoprotective roles, we decided to investigate their importance in mediating PDT resistance conferred by upregulated HO-1. We performed extensive studies where C-26 and MDAH2774 cells were incubated with increasing concentrations of bilirubin or biliverdin. Both pigments were added to cell cultures either before (4 or 24 h) or after PDT, or the co-culture was started before and continued for 24 h after PDT. Neither short-term (4 h) preincubation, nor long-term (24 h) preincubation, nor addition of bilirubin and biliverdin after or before and after light exposure influenced the cytotoxic effects of PDT. Similarly, culture of C-26 cells with the mixture of gases enriched with CO at two different concentrations of 500 and 1500 p.p.m. did not affect the viability of cells exposed to PDT (Figure 6f). Preincubation of C-26 cells with desferrioxamine (DFO), a potent iron chelator, significantly potentiated cytotoxic effects of PDT (Figure 6e). At a fluence of 4.5 kJ/m2, PDT induced killing of 22% of C-26 cells, and co-culture with DFO resulted in killing of 59 and 79% at DFO concentrations of 5 and 10 μm, respectively. Addition of hemin (at a concentration of 10 μm) nearly completely reversed the potentiating effects of DFO on PDT-mediated cytotoxicity (it decreased cytotoxicity from 59 to 38% and from 79 to 35%, for DFO at 5 and 10 μm concentration, respectively) (Figure 6e).
Figure 6.

Bilirubin, biliverdin and CO are not responsible for the cytoprotective effects of HO-1 in PDT-treated cells. C-26 (a, c, e, f) and MDAH 2774 (b, d) cells were seeded onto 35 mm plates at the concentration of 2.5 × 10⁵ cells/3 ml/dish and incubated for 24 h with 10 μg/ml Photofrin and/or bilirubin at two different concentrations (0.1 and 1 μm). The following day, the cells were illuminated with a light dose of 6 kJ/m2. Immediately after PDT, cells were trypsinized and seeded onto 96-well plate in the dilution of 1:50 in eight repeats. Fresh medium containing indicated concentrations of bilirubin (a, b), biliverdin (c, d) or DFO and/or hemin (f) was added. (e) One hour prior PDT, the growing medium was replaced with CO-enriched medium. Then the cells were exposed to different doses of light, from 3 to 6 kJ/m2. Immediately after PDT, cells were trypsinized and seeded onto 96-well plate in the dilution of 1:50 in eight repeats and placed in a container filled with a mixture of gases enriched with CO to two different concentrations (500 or 1500 p.p.m.). After 24 h of incubation, the cytotoxic effects were measured by crystal violet staining and are expressed as mean±s.d. The bars represent viability versus untreated controls. Data refer to mean±s.d. *P<0.05 versus PDT controls, **P<0.03 versus PDT only treated cells (Student's t-test).
Discussion
HO-1 catalyses the rate-limiting step in the oxidative degradation of heme by opening its tetrapyrrole ring structure to yield iron, CO and biliverdin which is rapidly converted to bilirubin by biliverdin reductase (Wagener et al., 2003). Each of these products plays a unique protective role in the human body. HO-1 is ubiquitously distributed and strongly induced by a variety of stress stimuli including oxidative injury (Keyse and Tyrrell, 1989; Deshane et al., 2005). Increased expression of HO-1 has been observed after hypoxia (Motterlini et al., 2000), hyperoxia (Lee et al., 1996), heat shock (Shibahara et al., 1987), H2O2 (Poss and Tonegawa, 1997), reactive nitrogen species (Tanaka et al., 2003) or ultraviolet A (Keyse and Tyrrell, 1989). Induction of HO-1 by these stimuli provides an important cellular defense mechanism against injury. Several mechanisms seem to account for the protective effects of HO-1. This enzyme was recently shown to mediate upregulation of SOD (Frankel et al., 2000; Turkseven et al., 2005), which seems to play a protective role against PDT-induced cell death (Golab et al., 2003; Dolgachev et al., 2005). H2O2-induced expression of vascular endothelial growth factor is at least partly dependent on induction of HO-1 (Cisowski et al., 2005). Both biliverdin and bilirubin are potent antioxidants capable of scavenging peroxy radicals and inhibiting lipid peroxidation (Stocker et al., 1987; Kapitulnik, 2004). Bilirubin appears to be one of the most abundant endogenous antioxidants in human serum (Minetti et al., 1998). It exerts potent scavenging activity against superoxide, peroxyl radical and peroxynitrite (Minetti et al., 1998; Dore et al., 1999). By releasing free iron from heme, HO-1 potentially contributes to pro-oxidant state within a cell. However, HO-1 induction is accompanied by increased ferritin activity, which exerts an additional antioxidant effect by chelating free iron (Balla et al., 1992). Additionally, HO-1 represses the expression of ferrous iron-ATPase transporter involved in iron efflux from the cell (Dore et al., 1999). Finally, HO-1 liberates the diatomic gas CO that, at low concentrations, possesses significant anti-inflammatory and antiapoptotic properties (Dulak and Jozkowicz, 2003). At low concentrations, CO suppresses the production of cytokines and growth factors, and induces vasodilation and angiogenesis (Dulak and Jozkowicz, 2003; Ryter and Otterbein, 2004). This latter effect might be of special importance in in vivo PDT, as the antitumor efficacy of this treatment results from the damage to both tumor cells and the vasculature (Abels, 2004).
It was previously shown that HO-1 is induced by PDT with Photofrin (Gomer et al., 1991) or by some photosensitizers at mRNA level (Bressoud et al., 1992). Additionally, Lin and Girotti (1996) demonstrated that long-term exposure to hemin, which is known to induce the expression of HO-1, leads to hyperresistance of leukemia cells to PDT. Therefore, in our studies we decided to address the role of HO-1 in the response of tumor cells to the cytotoxic effectiveness of PDT. Because of such pleiotropic effects exerted by HO-1, its roles in the antitumor effects of PDT are difficult to pinpoint. The expression of this enzyme is significantly induced by PDT (Gomer et al., 1991) (Figures 1 and 2). Interestingly, the cells that expressed constitutively higher levels of HO-1 and readily increased copious amounts of this enzyme were more resistant to PDT. Induction of HO-1 by hemin before PDT conferred resistance to subsequent treatment. Transfection of tumor cells with HO-1 gene or blockade of its enzymatic activity with Zn(II)PPIX further confirmed that HO-1 plays a protective role against PDT. Unexpectedly, considering the cytoprotective and antioxidant properties of HO-1 products, neither bilirubin, biliverdin nor CO administered to tumor cell cultures alone conferred protection against PDT. However, taking into account that HO-1 generates all these products simultaneously, it might be possible that together they might play a more significant protective role.
The cytotoxic effects of PDT were significantly potentiated by DFO, a potent iron chelator. DFO has previously been shown to induce expression of ferritin heavy chains (FHCs), which exerts antioxidative and cytoprotective effects (Pham et al., 2004). Therefore, it seemed possible that HO-1 catalysed release of iron might result in augmented expression of FHCs. Western blot analysis revealed, however, that expression of FHCs precedes induction of HO-1 thereby making this hypothesis unlikely (data not shown).
Altogether, our studies show for the first time that HO-1 plays a protective role against PDT-mediated cytotoxicity. Although the role played by HO-1 seems to be enormously complex and requires further studies, our results implicate HO-1 elicited iron-ferritin pathway to be an important effector of cytoprotection against PDT-mediated damage. Importantly, HO-1 seems to be a potential target for combination treatments. Zn(II)PPIX, an HO-1 inhibitor, has recently been shown to exert significant antitumor effects (Sahoo et al., 2002; Tanaka et al., 2003) and potentiates antitumor effects of PDT in vitro (Figure 5). Zn(II)PPIX has also been demonstrated to potentiate antitumor activity of other antitumor treatments that relay on generation of oxidative stress, including radiotherapy, chemotherapy with doxorubicin, gemcitabine and camptothecin (Fang et al., 2004; Berberat et al., 2005). Additionally, it can be hypothesized that hemorrhages and hemolysis in vascularized tumors that lead to increased hemin deposition could compromise the efficacy of PDT. The combined treatment with HO-1 inhibitors might be especially effective in potentiating antitumor effectiveness of PDT in such conditions.
Materials and methods
Mice
BALB/c mice, 8–12 weeks of age, were used in the experiments. Breeding pairs were obtained from the Institute of Oncology (Warsaw, Poland). Mice were kept in conventional conditions with full access to food and water during experiments. All the animal studies were performed in accordance with the guidelines approved by the Ethical Committee of the Medical University of Warsaw.
Reagents
Photofrin (Axcan Pharma Inc., Houdan, France) was dissolved in dextrose and used in a concentration of 10 μg/ml in all experiments. Verteporfin was a generous gift of QLT PhotoTherapeutics, Inc. (Vancouver, BC, Canada). HO-1 inhibitor, Zn(II)PPIX, was purchased from Frontier Scientific Europe Ltd (Carnforth, Lancashire, UK) and was dissolved in dimethylsulfoxide (Sigma, St Louis, USA) to the final stock concentration of 5 mm. Hemin (Sigma) was dissolved in 0.1 n KOH and then diluted with water to the final stock concentration of 2 mm in 10 mm KOH. Bilirubin (Sigma) was dissolved in 0.1 n NaOH to the final stock concentration of 10 mm. Biliverdin dihydrochloride (ICN Biomedicals Inc., OH, USA) was dissolved in 0.2 n NaOH to the final stock concentration of 2 mm and neutralized with 4 n NaOH to the final pH of 7.4. All the solutions were prepared in the dark right before adding to the cell cultures.
Tumor cells
Human ovarian carcinoma (MDAH2774), murine breast carcinoma (EMT6) and murine skin carcinoma (RT101) cell lines were purchased from ATCC (Manassas, VA, USA). Murine colon adenocarcinoma (C-26) was obtained from Professor Danuta Dus (Institute of Immunology and Experimental Medicine, Wroclaw, Poland). Cells were cultured in RPMI 1640 medium (C-26) (Invitrogen, Carlsbad, CA, USA) or Dulbecco's modified Eagle's medium (MDAH2774, EMT6, RT101) supplemented with 10% heat-inactivated fetal calf serum, antibiotics, 2-mercaptoethanol (50 mm) and l-gluta-mine (2 mm) (all from Invitrogen), hereafter referred to as culture medium.
Immunofluorescence microscopy
C-26 cells were cultured with Photofrin for 24 h before illumination. After washing with phosphate-buffered saline (PBS), the cells were illuminated with a 50 W sodium lamp (Philips) with a light filtered through a red filter to a final dose of 6.0 kJ/m2, as described previously (Golab et al., 2003). The immunofluorescence-microscopic studies were performed in cytospin preparations of the C-26 cells collected 8 h after PDT as described (Jalili et al., 2004). The primary goat polyclonal anti-HO-1 antibody (Santa Cruz Biotechnology, Inc., Santa Cruz, CA, USA) was applied overnight at 4°C, diluted 1:500 in 5% normal donkey serum in PBS. Secondary detection reagent was biotinylated donkey anti-goat antibody followed by streptavidin-Cy3 (Jackson Immuno Research). Cell nuclei were counterstained with Hoechst 33342 (Molecular Probes, The Netherlands).
DNA microarray analysis
C-26 cells were cultured with Photofrin for 24 h before illumination and illuminated as above. One, two or four hours later, total RNA was extracted from control and PDT-treated C-26 cells using TRIzol reagent (Invitrogen). DNA microarray analysis was performed as described (Makowski et al., 2003) using Atlas Mouse Stress Array consisting of 140 known murine genes under tight transcriptional control as described by the manufacturer.
Stable HO-1 transfection
The preparation of pcDNA3-based HO-1 gene-containing plasmid was described earlier (Dulak et al., 2002). C-26 cells were transfected using LipofectAMINE™ 2000 (Invitrogen). Stable transfectants were selected with neomycin (G418 from Sigma) for 3 weeks. The mixture of clones of HO-1-transfected cells are referred to as C-26-B6 cells and empty plasmid transfected cells are referred to as C-26-pcDNA3. The transfected cell cultures were isolated and tested for HO-1 expression in cell lysates using Western blotting and ELISA kit (Stressgen, Victoria, Canada), according to the vendor's protocol. Data were normalized to the protein content, assessed with BCA assay (Sigma).
Western blotting
For Western blotting C-26, MDAH2774, EMT6 and RT101 cells were cultured with Photofrin for 24 h or with 5 μg/ml Verteporfin for 1 h before illumination. The cells were illuminated as described to a final dose of 6.0 kJ/m2. After indicated time of culture in the fresh medium, the cells were washed with PBS and lysed with radioimmunoprecipitation assay buffer containing Tris base 50 mm, NaCl 150 mm, NP-40 1%, sodium deoxycholate 0.25% and ethylenediaminetetraacetic acid 1 mm supplemented with Complete® protease inhibitor cocktail tablets (Roche Diagnostics, Mannheim, Germany). Protein concentration was measured using BioRad Protein Assay (BioRad, Hercules, CA, USA). Equal amounts of whole-cell proteins were separated on 12% SDS-polyacrylamide gel, transferred onto Protran® nitrocellulose membranes (Schleicher and Schuell BioScience Inc., Keene, NH, USA), blocked with TBST (Tris-buffered saline (pH 7.4) and 0.05% Tween 20) supplemented with 5% nonfat milk and 5% fetal bovine serum. The following antibodies at 1:1000 dilution were used for the 24 h incubation: mouse monoclonal anti-α-tubulin (Calbiochem, Darmstadt, Germany) and goat polyclonal anti-HO-1 antibody (Santa Cruz). After extensive washing with TBST, the membranes were with corresponding alkaline phosphatase-coupled or horseradish peroxidase-coupled secondary antibodies (both from Jackson Immuno Research). The reaction was developed using SuperSignal WestPico Kit® (Pierce).
Cytostatic/cytotoxic assay
The cytostatic and/or cytotoxic effects of treatment of tumor cells were measured using crystal violet staining. Briefly, C-26 or MDAH2774 cells were dispensed into a 35-mm plates (Nunc) at a concentration of 2.5 × 10⁵ cells per dish and allowed to attach overnight. The following day 10 μg/ml Photofrin was added. For hemin, DFO, biliverdin and bilirubin, a 24-h co-incubation with Photofrin was used. After 24 h of incubation, the cells were washed with PBS and were illuminated as described. Immediately after the illumination cells were trypsinized and seeded into a 96-well microtiter plate (Nunc) at the dilution of 1:50 in eight repeats. All experiments were repeated at least three times with similar results. Fresh medium containing reagents mentioned above was added for 24 h incubation after PDT. DFO was added 24 h before PDT. Then, 24 h after PDT, the cells were rinsed with PBS and stained with 0.5% crystal violet in 30% ethanol for 10 min at room temperature. Plates were extensively washed with water and cells were lysed with 1% SDS solution. Absorbance was measured at 595 nm using an ELISA reader (SLT Labinstrument GmbH, Salzburg, Austria), equipped with a 595-nm filter. Cytotoxicity was expressed as relative viability of tumor cells (% of control cultures incubated with medium only) and was calculated as follows: relative viability = (Ae–Ab) × 100/(Ac–Ab), where Ab is the background absorbance, Ae is experimental absorbance and Ac is the absorbance of untreated controls.
In the experiments evaluating the role of exposition of PDT-treated cells to CO, C-26 cells were dispensed into 35-mm plates (Nunc) and were put into Modular Incubator Chamber (Billups-Rothenberg Inc., Del Mar, CA, USA), which was filled with a gas mixture enriched with CO at two different concentrations: 500 or 1500 p.p.m. Additionally, the gas mixture contained 5% CO2, 21% O2 and 73.95 or 73.85% of N2 (the latter was dependent on the amount of CO).
Clonogenic assay
MDAH2774 cells were plated at 2.5 × 10⁵ cells per 35-mm dish (Nunc). On the next day, Photofrin and/or 2.5 μm Zn(II)PPIX were added. After 24 h of incubation, the cells were washed with PBS and were illuminated as described to a final dose of 6.0 kJ/m2. Immediately after the illumination, cells were trypsinized and seeded onto 35-well plates in triplets at the concentration of 1 × 10³ cells per a dish. Fresh medium containing Zn(II)PPIX was added. The medium was removed daily for the 6 following days. After 14 days incubation in the dark, the cells were rinsed with PBS, fixed for 10 min in pure methanol and stained with 0.5% crystal violet in 30% ethanol for 10 min at room temperature. Then the plates were washed four times with tap water and air-dried. The images of the plates were made using the Olympus Camedia C750 Ultra Zoom digital camera.
Tumor treatment and monitoring
Exponentially growing C-26, C-26-pcDNA3 or C-26-B6 cells were harvested and injected (1 × 10⁶ cells in 20 μl) into the footpad of the right hindlimb of experimental mice. Photofrin was administered intraperitoneally at a dose of 10 mg/kg 24 h before illumination with 630 nm light (on the day 5 of the experiment). Control mice received 5% dextrose. The light source was a He–Ne ion laser (Amber, Warsaw, Poland). The light was delivered on day 6 of the experiment using a fiber optic light delivery system as described (Golab et al., 2000, 2002). The total light dose delivered to the tumors was 120 J/cm2. During the light treatment, mice were anesthetized with ketamine (87 mg/kg) and xylazine (13 mg/kg) and restrained in a specially designed holder and kept in the temperature of 37°C. Local tumor growth was determined as described (Golab et al., 2003) by the formula: tumor volume (mm3) (longer diameter) × (shorter diameter)2. Relative tumor volume was calculated as: relative tumor volume = [(tumor volume)/(initial volume)] × 100%.
Statistical analysis
Data were calculated using Microsoft™ Excel 98. Differences in in vitro cytotoxicity assays and tumor volume were analysed for significance o by Student's t-test. Significance was defined as a two-sided P<0.05.
Acknowledgements
This work was supported in part by Grants: 1M19/M2, 1M19/NK and 1M19/W1 from the Medical University of Warsaw; Grants PBZ-KBN-107-/P04/2004 and PBZ-KBN-091/P05/54 from the State Committee for Scientific Research, Poland. Marcin Makowski is a recipient of the Foundation for Polish Science Award.
Abbreviations
- CO
carbon monoxide
- COX
cyclooxygenase
- DFO
desferrioxamine
- HO-1
heme oxygenase-1
- Hsp
heat shock protein
- PBS
phosphate-buffered saline
- PDT
photodynamic therapy
- ROS
reactive oxygen species
- SOD
superoxide dismutase
- Zn(II)PPIX
zinc (II) propoporphyrin IX
References
- Abels C. Photochem Photobiol Sci. 2004;3:765–771. doi: 10.1039/b314241h. [DOI] [PubMed] [Google Scholar]
- Almeida RD, Manadas BJ, Carvalho AP, Duarte CB. Biochim Biophys Acta. 2004;1704:59–86. doi: 10.1016/j.bbcan.2004.05.003. [DOI] [PubMed] [Google Scholar]
- Bachowski GJ, Korytowski W, Girotti AW. Lipids. 1994;29:449–459. doi: 10.1007/BF02578241. [DOI] [PubMed] [Google Scholar]
- Balla G, Jacob HS, Balla J, Rosenberg M, Nath K, Apple F, et al. J Biol Chem. 1992;267:18148–18153. [PubMed] [Google Scholar]
- Berberat PO, Dambrauskas Z, Gulbinas A, Giese T, Giese N, Kunzli B, et al. Clin Cancer Res. 2005;11:3790–3798. doi: 10.1158/1078-0432.CCR-04-2159. [DOI] [PubMed] [Google Scholar]
- Bressoud D, Jomini V, Tyrrell RM. J Photochem Photobiol B. 1992;14:311–318. doi: 10.1016/1011-1344(92)85110-g. [DOI] [PubMed] [Google Scholar]
- Castano AP, Demidova TN, Hamblin MR. Photodiagn Photodyn Ther. 2004;1:279–293. doi: 10.1016/S1572-1000(05)00007-4. [DOI] [PMC free article] [PubMed] [Google Scholar]
- Cisowski J, Loboda A, Jozkowicz A, Chen S, Agarwal A, Dulak J. Biochem Biophys Res Commun. 2005;326:670–676. doi: 10.1016/j.bbrc.2004.11.083. [DOI] [PubMed] [Google Scholar]
- Deshane J, Wright M, Agarwal A. Acta Biochim Pol. 2005;52:273–284. [PubMed] [Google Scholar]
- Dolgachev V, Oberley LW, Huang TT, Kraniak JM, Tainsky MA, Hanada K, et al. Biochem Biophys Res Commun. 2005;332:411–417. doi: 10.1016/j.bbrc.2005.04.141. [DOI] [PubMed] [Google Scholar]
- Dore S, Takahashi M, Ferris CD, Zakhary R, Hester LD, Guastella D, et al. Proc Natl Acad Sci USA. 1999;96:2445–2450. doi: 10.1073/pnas.96.5.2445. [DOI] [PMC free article] [PubMed] [Google Scholar]
- Dougherty TJ, Gomer CJ, Henderson BW, Jori G, Kessel D, Korbelik M, et al. J Natl Cancer Inst. 1998;90:889–905. doi: 10.1093/jnci/90.12.889. [DOI] [PMC free article] [PubMed] [Google Scholar]
- Dulak J, Jozkowicz A. Acta Biochim Pol. 2003;50:31–47. [PubMed] [Google Scholar]
- Dulak J, Jozkowicz A, Foresti R, Kasza A, Frick M, Huk I, et al. Antioxidant Redox Signal. 2002;4:229–240. doi: 10.1089/152308602753666280. [DOI] [PubMed] [Google Scholar]
- Fang J, Sawa T, Akaike T, Greish K, Maeda H. Int J Cancer. 2004;109:1–8. doi: 10.1002/ijc.11644. [DOI] [PubMed] [Google Scholar]
- Ferrario A, Von Tiehl K, Wong S, Luna M, Gomer CJ. Cancer Res. 2002;62:3956–3961. [PubMed] [Google Scholar]
- Ferrario A, von Tiehl KF, Rucker N, Schwarz MA, Gill PS, Gomer CJ. Cancer Res. 2000;60:4066–4069. [PubMed] [Google Scholar]
- Frankel D, Mehindate K, Schipper HM. J Cell Physiol. 2000;185:80–86. doi: 10.1002/1097-4652(200010)185:1<80::AID-JCP7>3.0.CO;2-W. [DOI] [PubMed] [Google Scholar]
- Golab J, Nowis D, Skrzycki M, Czeczot H, Baranczyk-Kuzma A, Wilczynski GM, et al. J Biol Chem. 2003;278:407–414. doi: 10.1074/jbc.M209125200. [DOI] [PubMed] [Google Scholar]
- Golab J, Olszewska D, Mroz P, Kozar K, Kaminski R, Jalili A, et al. Clin Cancer Res. 2002;8:1265–1270. [PubMed] [Google Scholar]
- Golab J, Wilczynski G, Zagozdzon R, Stoklosa T, Dabrowska A, Rybczynska J, et al. Br J Cancer. 2000;82:1485–1491. doi: 10.1054/bjoc.1999.1078. [DOI] [PMC free article] [PubMed] [Google Scholar]
- Gomer CJ, Luna M, Ferrario A, Rucker N. Photochem Photobiol. 1991;53:275–279. doi: 10.1111/j.1751-1097.1991.tb03934.x. [DOI] [PubMed] [Google Scholar]
- Gomer CJ, Ryter SW, Ferrario A, Rucker N, Wong S, Fisher AM. Cancer Res. 1996;56:2355–2360. [PubMed] [Google Scholar]
- Granville DJ, Carthy CM, Jiang H, Levy JG, McManus BM, Matroule JY, et al. Blood. 2000;95:256–262. [PubMed] [Google Scholar]
- Granville DJ, Jiang H, An MT, Levy JG, McManus BM, Hunt DW. Br J Cancer. 1999;79:95–100. doi: 10.1038/sj.bjc.6690017. [DOI] [PMC free article] [PubMed] [Google Scholar]
- Grune T, Klotz LO, Gieche J, Rudeck M, Sies H. Free Radic Biol Med. 2001;30:1243–1253. doi: 10.1016/s0891-5849(01)00515-9. [DOI] [PubMed] [Google Scholar]
- Hendrickx N, Volanti C, Moens U, Seternes OM, de Witte P, Vandenheede JR, et al. J Biol Chem. 2003;278:52231–52239. doi: 10.1074/jbc.M307591200. [DOI] [PubMed] [Google Scholar]
- Jalili A, Makowski M, Switaj T, Nowis D, Wilczynski GM, Wilczek E, et al. Clin Cancer Res. 2004;10:4498–4508. doi: 10.1158/1078-0432.CCR-04-0367. [DOI] [PubMed] [Google Scholar]
- Kapitulnik J. Mol Pharmacol. 2004;66:773–779. doi: 10.1124/mol.104.002832. [DOI] [PubMed] [Google Scholar]
- Keyse SM, Tyrrell RM. Proc Natl Acad Sci USA. 1989;86:99–103. doi: 10.1073/pnas.86.1.99. [DOI] [PMC free article] [PubMed] [Google Scholar]
- Kick G, Messer G, Plewig G, Kind P, Goetz AE. Br J Cancer. 1996;74:30–36. doi: 10.1038/bjc.1996.311. [DOI] [PMC free article] [PubMed] [Google Scholar]
- Kliukiene R, Maroziene A, Nivinskas H, Cenas N, Kirveliene V, Juodka B. Biochem Mol Biol Int. 1997;41:707–713. doi: 10.1080/15216549700201751. [DOI] [PubMed] [Google Scholar]
- Koukourakis MI, Giatromanolaki A, Skarlatos J, Corti L, Blandamura S, Piazza M, et al. Cancer Res. 2001;61:1830–1832. [PubMed] [Google Scholar]
- Lee PJ, Alam J, Wiegand GW, Choi AM. Proc Natl Acad Sci USA. 1996;93:10393–10398. doi: 10.1073/pnas.93.19.10393. [DOI] [PMC free article] [PubMed] [Google Scholar]
- Lin F, Girotti AW. Cancer Res. 1996;56:4636–4643. [PubMed] [Google Scholar]
- Luna MC, Wong S, Gomer CJ. Cancer Res. 1994;54:1374–1380. [PubMed] [Google Scholar]
- Makowski M, Grzela T, Niderla J, M LA, Mroz P, Kopee M, et al. Clin Cancer Res. 2003;9:5417–5422. [PubMed] [Google Scholar]
- McBride G. J Natl Cancer Inst. 2002;94:1740–1742. doi: 10.1093/jnci/94.23.1740. [DOI] [PubMed] [Google Scholar]
- Minetti M, Mallozzi C, Di Stasi AM, Pietraforte D. Arch Biochem Biophys. 1998;352:165–174. doi: 10.1006/abbi.1998.0584. [DOI] [PubMed] [Google Scholar]
- Motterlini R, Foresti R, Bassi R, Calabrese V, Clark JE, Green CJ. J Biol Chem. 2000;275:13613–13620. doi: 10.1074/jbc.275.18.13613. [DOI] [PubMed] [Google Scholar]
- Nowis D, Makowski M, Stoklosa T, Legat M, Issat T, Golab J. Acta Biochim Pol. 2005;52:339–352. [PubMed] [Google Scholar]
- Oberdanner CB, Plaetzer K, Kiesslich T, Krammer B. Photochem Photobiol. 2005;81:609–613. doi: 10.1562/2004-08-23-RN-284. [DOI] [PubMed] [Google Scholar]
- Pham CG, Bubici C, Zazzeroni F, Papa S, Jones J, Alvarez K, et al. Cell. 2004;119:529–542. doi: 10.1016/j.cell.2004.10.017. [DOI] [PubMed] [Google Scholar]
- Poss KD, Tonegawa S. Proc Natl Acad Sci USA. 1997;94:10925–10930. doi: 10.1073/pnas.94.20.10925. [DOI] [PMC free article] [PubMed] [Google Scholar]
- Rasch MH, Tijssen K, Lagerberg JW, Corver WE, VanSteveninck J, Dubbelman TM. Photochem Photobiol. 1997;66:209–213. doi: 10.1111/j.1751-1097.1997.tb08645.x. [DOI] [PubMed] [Google Scholar]
- Ryter SW, Otterbein LE. Bioessays. 2004;26:270–280. doi: 10.1002/bies.20005. [DOI] [PubMed] [Google Scholar]
- Sahoo SK, Sawa T, Fang J, Tanaka S, Miyamoto Y, Akaike T, et al. Bioconjug Chem. 2002;13:1031–1038. doi: 10.1021/bc020010k. [DOI] [PubMed] [Google Scholar]
- Sharman WM, Allen CM, van Lier JE. Methods Enzymol. 2000;319:376–400. doi: 10.1016/s0076-6879(00)19037-8. [DOI] [PubMed] [Google Scholar]
- Shibahara S, Muller RM, Taguchi H. J Biol Chem. 1987;262:12889–12892. [PubMed] [Google Scholar]
- Shiraishi F, Visner GA, Nick HS, Agarwal A. Anal Biochem. 2001;289:303–305. doi: 10.1006/abio.2000.4965. [DOI] [PubMed] [Google Scholar]
- Srivastava M, Ahmad N, Gupta S, Mukhtar H. J Biol Chem. 2001;276:15481–15488. doi: 10.1074/jbc.M006920200. [DOI] [PubMed] [Google Scholar]
- Stocker R, Yamamoto Y, McDonagh AF, Glazer AN, Ames BN. Science. 1987;235:1043–1046. doi: 10.1126/science.3029864. [DOI] [PubMed] [Google Scholar]
- Tanaka S, Akaike T, Fang J, Beppu T, Ogawa M, Tamura F, et al. Br J Cancer. 2003;88:902–909. doi: 10.1038/sj.bjc.6600830. [DOI] [PMC free article] [PubMed] [Google Scholar]
- Turkseven S, Kruger A, Mingone CJ, Kaminski P, Inaba M, Rodella LF, et al. Am J Physiol Heart Circ Physiol. 2005 doi: 10.1152/ajpheart.00024.2005. [DOI] [PubMed] [Google Scholar]
- Verwanger T, Sanovic R, Aberger F, Frischauf AM, Krammer B. Int J Oncol. 2002;21:1353–1359. [PubMed] [Google Scholar]
- Wagener FA, Volk HD, Willis D, Abraham NG, Soares MP, Adema GJ, et al. Pharmacol Rev. 2003;55:551–571. doi: 10.1124/pr.55.3.5. [DOI] [PubMed] [Google Scholar]
- Wang HP, Hanlon JG, Rainbow AJ, Espiritu M, Singh G. Photochem Photobiol. 2002;76:98–104. doi: 10.1562/0031-8655(2002)076<0098:urohpa>2.0.co;2. [DOI] [PubMed] [Google Scholar]
- Wild PJ, Krieg RC, Seidl J, Stoehr R, Reher K, Hofmann C, et al. Mol Cancer Ther. 2005;4:516–528. doi: 10.1158/1535-7163.MCT-04-0141. [DOI] [PubMed] [Google Scholar]
- Woods JA, Traynor NJ, Brancaleon L, Moseley H. Photochem Photobiol. 2004;79:105–113. [PubMed] [Google Scholar]
- Xue LY, Qiu Y, He J, Kung HJ, Oleinick NL. Oncogene. 1999;18:3391–3398. doi: 10.1038/sj.onc.1202687. [DOI] [PubMed] [Google Scholar]
- Zhuang S, Kochevar IE. Photochem Photobiol. 2003;78:361–371. doi: 10.1562/0031-8655(2003)078<0361:soaopk>2.0.co;2. [DOI] [PubMed] [Google Scholar]