

Abstract
The ability of cat superior colliculus (SC) neurons to synthesize information from different senses depends on influences from two areas of the cortex: the anterior ectosylvian sulcus (AES) and the rostral lateral suprasylvian sulcus (rLS). Reversibly deactivating the inputs to the SC from either of these areas in normal adults severely compromises this ability and the SC-mediated behaviors that depend on it. In the present study we found that removal of these areas in neonatal animals precluded the normal development of multisensory SC processes. At maturity there was a substantial decrease in the incidence of multisensory neurons, and those multisensory neurons that did develop were highly abnormal. Their cross-modal receptive field register was severely compromised, as was their ability to integrate cross-modal stimuli. Apparently, despite the impressive plasticity of the neonatal brain, it cannot compensate for the early loss of these cortices. Surprisingly, however, neonatal removal of either AES or rLS had comparatively minor consequences on these properties. At maturity multisensory SC neurons were quite common: they developed the characteristic spatial register among their unisensory receptive fields and exhibited normal adult-like multisensory integration. These observations suggest that during early ontogeny, when the multisensory properties of SC neurons are being crafted, AES and rLS may have the ability to compensate for the loss of one another’s cortico-collicular influences so that normal multisensory processes can develop in the SC.
Keywords: development, sensory cortex, cross-modal, plasticity, compensation, multisensory integration
INTRODUCTION
A remarkable property of superior colliculus (SC) neurons is their ability to integrate information from different senses in order to guide overt orientation behaviors. When cross-modal sensory stimuli originate from the same event, they fall within the overlapping receptive fields of a given multisensory neuron and result in multisensory enhancement: a response that is greater than that evoked by the individual component stimuli. On the other hand, when these stimuli originate from different events, such that one falls within and the other outside its respective receptive field, the eccentric stimulus can degrade the effectiveness of the within-field stimulus, thereby producing multisensory depression (Meredith and Stein, 1983, 1996; Kadunce et al., 1997; Jiang and Stein, 2003). Multisensory integration can thus be seen as a mechanism for modulating the physiological salience of external events, and the same conditions that enhance or depress the response of SC neurons will enhance or depress SC-mediated behaviors (Stein et al., 1988; 1989).
Most important in the current context is that SC multisensory integration is under the control of two cortical areas: the anterior ectosylvian (AES) and rostral lateral suprasylvian (rLS) sulci (see Stein et al., 2004). These interconnected areas (Scannel et al., 1995, see Also Meredith 1994) contain visual, auditory and somatosensory neurons (Thompson et al 1963; Clemo and Stein 1982, 1983; Mucke et al., 1982; Benedek et al., 1983; Toldi and Feher, 1984; Olson and Graybiel, 1987; Wallace et al., 1993, Jiang et al., 1994a,b) that project to the SC (Stein et al., 1983, Huerta and Harting, 1984; Segal and Beckstead, 1984; McHaffie et al., 1988) and can affect its neuronal properties (Clemo and Stein, 1984, 1986; Meredith and Clemo, 1989). The unisensory AES cortico-collicular convergence patterns match those received by SC neurons from other sources (Wallace et al., 1993), a pattern likely to be paralleled by projections from rLS (Jiang et al., 2001).
The importance of influences from these cortical areas is most apparent on multisensory enhancement, the most robust index of multisensory integration. When cortical influences are temporarily compromised, the different modality-specific stimuli still elicit responses in multisensory SC neurons, but their combination is now no more effective than is the best of these component stimuli presented alone (Wallace and Stein, 1994; Jiang et al., 2001; Jiang and Stein, 2003), an effect that is also reflected at the behavioral level (Wilkinson et al., 1996; Jiang et al., 2002). Similar, though less severe, effects are observed on multisensory depression (Jiang et al., 2002; Jiang and Stein, 2003).
This role of cortex in multisensory integration is not yet established at birth, and the multisensory properties of SC neurons, and the cortico-collicular influences of cortex, develop gradually over the first few postnatal months (Stein et al., 1973; Wallace and Stein, 1997, 2000; Wallace et al., 1997) during the period of maximal brain plasticity (Wickelgren and Sterling, 1969; Buonomano and Merzenich, 1998; Rauschecker, 1999). In the present experiments we sought to determine whether the brain could compensate for the loss of AES and/or rLS during this maturational period and construct alternate circuits capable of supporting SC multisensory integration. Preliminary descriptions of these experiments have been presented (Jiang and Stein, 2002).
MATERIALS AND METHODS
All survival surgery was conducted using aseptic techniques and in accordance with the Guide for the Care and Use of Laboratory Animals (NIH Publication 86–23) and an approved ACUC protocol at Wake Forest University School of Medicine.
Neonatal cortical ablation
All cortical ablations were conducted when animals were 3 wks postnatal. This is just before visual stimuli begin to activate deep (i.e., multisensory) laminae SC neurons, and approximately 1 week prior to the time at which cortical inputs from AES and rLS are first able to facilitate multisensory integration in some SC neurons (Stein et al., 1973; Kao et al., 1994; Wallace et al., 1997; Wallace and Stein, 2000). Animals were anesthetized with ketamine hydrochloride (15–30 mg/kg, i.m. and acepromazine 0.05–0.1 mg/kg, i.m.) followed by inhalation of isoflurane (0.2–3%). A skin incision was made, followed by a unilateral craniectomy that exposed AES and rLS. Both sulci are clearly evident at this time and the tissue forming either one or both of them was then removed via subpial aspiration until the underlying white matter was visible. The surgical area was then covered with saline-soaked gelfoam, the bone segments were replaced and the area was covered with gelfoam. The skin was then sutured closed. The animals were given postsurgical analgesics (butorphanol tartrate, 0.1–0.4 mg/kg/6hr) as needed and received antibiotic treatments for 7–10 days (ceftriaxone 20 mg/kg/b.i.d. or enrofloxacin 5mg/kg/b.i.d.).
Cortical deactivation coil implantation
Two animals that had neonatal ablation of AES & rLS were implanted as adults with cortical deactivation coils over the ablated areas. The coils were used during recording experiments to examine whether those SC neurons developing multisensory integration capabilities reflected residual inputs from AES-rLS tissue that was inadvertently spared during the ablation procedure. Each animal was pretreated with ketamine hydrochloride (20–30 mg/kg, i.m.) and acepromazine maleate (0.05–0.1 mg/kg, i.m.), intubated through the mouth and anesthetized with isoflurane (1–3%). Body temperature (37–38 °C) was maintained with a hot water heating pad. The animal was placed into a stereotaxic head-holder, and craniectomies exposed the cortex overlying both the left and right SC. The dura over the presumptive AES-rLS area was opened and a cortical deactivation (i.e., “cooling”) coil was inserted. The coil was approximately 11 x 5 mm and crafted from 21-gauge stainless steel tube. It formed a “foot” that rested on the surface of the damaged cortex (see Jiang et al., 2001 for a description of the coils). The area was covered with gelfoam and sealed with orthopedic cement. A hollow cylinder was attached to the skull to provide access to the SC and an atraumatic means of holding the animal’s head during recording (McHaffie and Stein, 1983). This cylinder, or head holder device, was also implanted in all other animals (both controls and experimental animals) before recording began. After implantation surgery the animal was given analgesics (butorphanol tartrate, 0.1–0.4 mg/kg/6hr) as needed and received antibiotic treatments for 7–10 days (ceftriaxone 20 mg/kg/b.i.d. or enrofloxacin 5mg/kg/b.i.d.).
Recording
After surgical wounds had healed, an animal was prepared for recording with ketamine hydrochloride (an initial dose of 20–30 mg/kg, i.m. and then maintained at 2–5 mg/kg/hr i.v.) and acepromazine (0.05–0.1 mg/kg., i.m.). No wounds or pressure points were induced during recording and the animal’s head was held via horizontal bars that could be inserted into openings in the metal head holder implanted on the skull. Anesthetic level was determined by continuously monitoring heart rate and blood oxygenation by pulse oximetry (Nonin 8600C). Fluids (5% Dextrose Ringers 3–6 ml/h i.v.) were infused and the animal was artificially respired and paralyzed (pancuronium bromide, initial dose: 0.3 mg/kg, then: 0.1–0.2 mg/kg/hr i.v.). End tidal CO2 was maintained at approximately 4.0% and body temperature at ~38 °C. The eye contralateral to the SC being studied was dilated with 1% atropine sulfate and a contact lens corrected its refractive errors. An opaque lens occluded the other eye. Single neurons were recorded using epoxylite-insulated tungsten microelectrodes (tip diameter 1–3 im, impedance 1–3 MΩ at 1 kHz). The electrode was positioned via an X–Y translational stage and lowered to the dorsal surface of the SC (identified by characteristic visual activity). Once at the SC surface, the electrode was advanced via a hydraulic microdrive while sensory search stimuli were presented. Only neurons that were clearly isolated from background activity with stable amplitudes and waveforms were studied. At the end of each recording session drugs were discontinued and, when stable respiration and coordinated locomotion returned, the animal was returned to its home cage. All experimental animals were adults of similar ages (between 1 and 1.5 years of age) at the time of implantation surgery and the onset of their recording periods, which could last up to one year.
Receptive field mapping
Sensory-responsive neurons were sought using a variety of visual, auditory and somatosensory search stimuli. Visual search stimuli consisted of moving and stationary flashed visual stimuli. Auditory search stimuli consisted of 20–20,000 Hz noise bursts as well as hisses, clicks, claps and whistles. Somatosensory search stimuli consisted of taps, brushes and manual manipulation of deep tissue and movement of joints. When a sensory-responsive multisensory neuron was located, its receptive fields were mapped. Visual receptive fields were mapped with moving bars and spots of light, and auditory receptive fields were mapped using broad-band noise bursts via any of 16 hoop-mounted speakers placed 15° apart and 15cm from the head on a rotating hoop so that elevation could be examined (see Meredith and Stein, 1986a,b). Somatosensory receptive fields were mapped with camel’s hair brushes and von Frey hairs. Receptive fields were plotted on standardized representations of visual-auditory space and diagrams of the body surface (see Stein and Meredith, 1993). Receptive fields encompassed areas of activity that significantly exceeded background spontaneous rates. For most neurons, however, either no background rates were detected or these rates were extremely low, thereby having little effect on the ability to accurately delimit receptive field borders.
Calculating Cross-Modal Receptive Field Register
The spatial register between the visual and auditory receptive fields of a given neuron was calculated using a geometric convention in which an X–Y coordinate system was constructed using the visual receptive field center as the center of that system. The two receptive fields were assumed to be circular, using an average value of their actual vertical and horizontal radii (the population averages showed that this “correction” did not alter receptive field areas). A line was drawn to measure the center-to-center angular distance (labeled “a” in figure 1) between the visual and auditory receptive fields, and the formula for assessing the percentage of receptive field overlap based on these measures is shown in figure 1. The resultant receptive field overlap was expressed as the percentage of the neuron’s visual receptive field overlapped by its auditory receptive field.
Figure 1.

Calculating receptive field overlap: This was expressed as the percentage of the visual receptive field encompassed by the auditory receptive field and required solving for Aa and Av as shown in the figure. When a > rv + ra there is no overlap, and when a < ra – rv there is 100% overlap (a = distance between the centers of the two receptive fields).
General Testing Paradigm
The onset, duration, physical parameters, cross-modal stimulus onset asynchronies, and intertrial intervals were controlled independently. Visual stimuli consisted of computer-controlled moving bars of light generated by a Barcodata projector. Bars and spots of light (0.11–13.0 cd/m2 against a background of 0.10 cd/m2) were projected onto the tangent screen and could be moved in all directions across the receptive field at amplitudes of 1–110° and speeds of 1–400°/sec. Auditory stimuli were computer-controlled broad-band noise bursts delivered from any of the speakers. Auditory stimulus duration varied from 20–100 ms at intensities of 55–70 dB SPL against a background SPL of 51.4–52.0 dB. Thus, the effective auditory stimuli were the differences between background and stimulus level. Somatosensory stimuli consisted of indentation of the hair and skin with a computer-controlled probe, whose tip was of variable size and attached to a moving coil vibrator (Ling 102A shaker).
A neuron’s multisensory integrative properties were first explored with spatially aligned visual-auditory stimuli (to test for multisensory enhancement). Responses to each modality-specific stimulus (e.g., visual, auditory) and to their cross-modal combination (visual-auditory) were determined quantitatively by presenting each category of stimulus (interleaved) 8–10 times at 8–20 second intertrial intervals. Stimulus effectiveness was manipulated by altering visual and/or auditory stimulus intensity in proportionate steps through the intensity ranges indicated above. Each unisensory and multisensory test was then repeated at each level of stimulus effectiveness. The various levels of effectiveness are ordinal and are shown for each neuron documented in Results by numbers (e.g., 1–4). The objective here was not to fully explore the dynamic ranges of these neurons, but to ensure that any lesion-induced changes that were noted at a given level of stimulus effectiveness were not specific to a given response level. In multisensory trials, the two cross-modal stimuli were either simultaneous or within 20–200 ms of one another. The stimulus parameters, including stimulus intensities and cross-modal stimulus onset asynchronies, were chosen to maximize the amplitude of multisensory enhancement (e.g., see Jiang et al., 2001; Kadunce, et al., 2001; Perrault et al., 2005; Stanford et al., 2005). In order to examine multisensory depression, the visual stimulus was presented in the center of the visual receptive field and the auditory stimulus was presented outside the auditory receptive field (either centrally or peripherally). The interstimulus interval and the parameters (e.g., intensity, size, position, motion direction and speed, etc.) of each modality-specific stimulus were chosen based on previous studies (Meredith and Stein, 1996; Kadunce et al., 1997) to maximize multisensory depression.
Cortical deactivation
The deactivation of cortex was accomplished by circulating refrigerated water through the indwelling coil. The reactivation of cortex was accomplished either passively or by subsequently circulating warm (36–38°C) water through the same coil. During deactivation the cortical temperature around the coil decreased to approximately 10°C in 2–3 minutes and the temperature stabilized at that level. At temperatures below 17–19°C neurons in AES and rLS cease both spontaneous and sensory-evoked discharges (Jiang et al., 2001; see also Horel, 1991; Lomber et al., 1999). The effective decrease in cortical temperature was circumscribed to an area of about a 2 mm radius around each coil. This was previously determined by sampling and recording the cortical temperature with a thermistor inserted into the cortex at points within a grid pattern around the deactivation coil. Beyond the 2mm point the decrement in cortical temperature did not preclude neural activity (i.e., at 3 mm from the coil cortical temperature remained > 24°C during this time period, see Jiang et al., 2001). Both the cortical temperature and the responsiveness of cortical neurons were reinstated several minutes after the onset of warm water circulation.
Histology
When all testing was concluded the animal was deeply anesthetized with pentobarbital sodium (100mg/kg i.v.) and perfused transcardially with formalin (10%). The brain was removed, photographed, blocked, and cut into 50 m frozen sections. Every fourth section was mounted on a slide and stained with cresyl violet or neutral red. The pattern of sulci and gyri was traced from photographs and the tissue was examined with low-power and high-power microscopy and reconstructed serially by projecting and tracing scanned sections through the lesion site.
Data Acquisition and Analysis
For the assessment of multisensory integration, each neuron served as its own control. Each neuron’s response (number of impulses) to each modality-specific and cross-modal stimulus combination was measured using the time window that bracketed the longest response train. Although spontaneous rates were low, responses were corrected by subtracting spontaneous activity (i.e., the number of impulses measured in a 1 sec interval preceding the first stimulus and normalized for the time window in which responses were counted). The timing of onset and offset of a neuron’s discharge train was determined by the beginning of the first and the end of the last bin (5 ms) at which the mean number of impulses significantly exceeded the average spontaneous firing (p<0.05). The same time window was used to measure responses of a given neuron in each of the different stimulus conditions (i.e., modality-specific, multisensory, control and cortical deactivation). Statistical analysis was performed with SYSTAT (SPSS Inc.). The criterion for multisensory integration was the same under all conditions: a statistically significant (Student’s t-test, p<0.05) change (either increase, “enhancement” or decrease, “depression”) in the response to the cross-modal stimulus combination as compared to the dominant unisensory response. In instances in which the statistical criterion for multisensory integration was reached, the magnitude of the multisensory response (% change) was then calculated using the formula devised by Meredith and Stein (1983):
CM = the mean number of impulses evoked by the multisensory (visual-auditory) stimulus and SMmax = the mean number of impulses evoked by the “dominant” (i.e., the most effective) modality-specific stimulus.
Multisensory response enhancement was evoked only when the cross-modal stimuli were spatially coincident and within their respective excitatory receptive fields. Multisensory response depression was evoked only when one of those stimuli was within and the other outside its excitatory receptive field. In several cases in which a neuron, in an animal with an AES & rLS lesion, exhibited multisensory integration, the cortex at the lesion site was deactivated and the tests were repeated. The same tests were repeated a third time after the cortex was reactivated. For each neuron, the effect of cortical deactivation on the unisensory responses was determined using a Student’s t-test. The difference in the multisensory responses obtained in the control and cortical deactivation conditions was assessed using ANOVA (a possible interaction between the treatment and the unisensory response was incorporated into the analysis).
RESULTS
Eleven animals were used in the present experiments: 5 were normal controls; 3 had both AES & rLS ablated and 3 had only one of these areas ablated (i.e., 2 had AES ablated; and 1 had rLS ablated). All cortical ablations were made at 3 weeks postnatal, and recordings were made from the SC of these animals once they had matured (i.e., 1–2 yrs of age)
Normal Control Animals
A total of 94 electrode penetrations were made in the 5 normal control animals, and 979 neurons were recorded. Of these, 787 were in the multisensory (i.e., deep) laminae of the SC. All quantitative comparisons were made on neurons in the multisensory laminae. Although the electrode penetrations in these animals were more concentrated in rostral SC where receptive fields are smallest, they did span all quadrants of the SC. The data from these control neurons formed the standard with which to assess the effects of these cortical lesions on SC multisensory properties (see Table I for a summary of neuron numbers and modality convergence patterns in each group).
Table I.
Database of neurons studied.
| Category | Normal | AES & rLS | AES alone | rLS alone | |
|---|---|---|---|---|---|
| Number of animals | 5 | 3 | 2 | 1 | |
| Deep SC | # of penetration | 94 | 91 | 14 | 12 |
| # of neurons | 787 | 806 | 119 | 101 | |
| Neurons/penetration | 8.4 | 8.9 | 8.5 | 8.4 | |
| Unisensory neurons | V | 176 | 172 | 30 | 31 |
| A | 39 | 99 | 9 | 9 | |
| S | 120 | 247 | 30 | 18 | |
| Multisensory neurons | VA | 276 | 145 | 24 | 25 |
| VS | 67 | 52 | 5 | 7 | |
| AS | 20 | 27 | 6 | 3 | |
| VAS | 33 | 25 | 7 | 3 | |
| No Response | 56 | 39 | 8 | 5 | |
| χ2 results* | * p<0.01 | NS (p>0.1) | NS (p>0.1) |
V=visual, A=auditory, S=somatosensory, VA=visual-auditory, VS=visual-somatosensory, AS=auditory-somatosensory, VAS=visual-auditory-somatosensory.
Results of Chi-square statistics compared the modality distribution pattern of each experimental group with the normal animal control group.
The data obtained from the normal control animals did not differ substantially from those we obtained using similar procedures in previous studies of cat SC (e.g., Stein et al., 1976; Meredith and Stein, 1986a; Kadunce et al., 1997; Wallace et al., 1998; Jiang et al., 2001; see also Stein 1998). All sensory-responsive neurons in the superficial layers (stratum opticum and above) were unisensory visual, whereas unisensory nonvisual (i.e., auditory or somatosensory) and multisensory neurons were confined to the deep layers of the structure. Within the multisensory layers neurons were encountered having each of the possible modality convergence patterns (see fig. 3) previously reported in cat SC (Stein et al., 1976; Meredith and Stein, 1983 Meredith and Stein, 1986a; Middlebrooks and Knudsen, 1984; Binns and Salt, 1996; Peck, 1996; Kadunce et al., 1997; Wallace et al., 1998; Populin and Yin, 2002; Perrault et al., 2003) as well as in the SC of other mammals (see Drager and Hubel, 1976; Stein and Dixon, 1979; King and Palmer, 1985; Wallace et al., 1996; Frens and van Opstal, 1998; Bell et al., 2001; Zangenehpour and Chaudhuri, 2001; see also Calvert et al., 2001). Each multisensory neuron had multiple receptive fields, one for each modality to which it was responsive. These different receptive fields were also in good spatial register with one another, a characteristic feature of SC multisensory neurons (see Stein and Meredith, 1993). The mean visual-auditory receptive field overlap was approximately 77%, a figure that corresponds with previous estimates from normal animals (Meredith and Stein 1996; Kadunce et al., 2001). In addition, the majority of the multisensory neurons exhibited the typical enhanced responses to spatially coincident cross-modal stimuli and depressed responses to spatially disparate cross-modal stimuli (see Table II).
Figure 3.
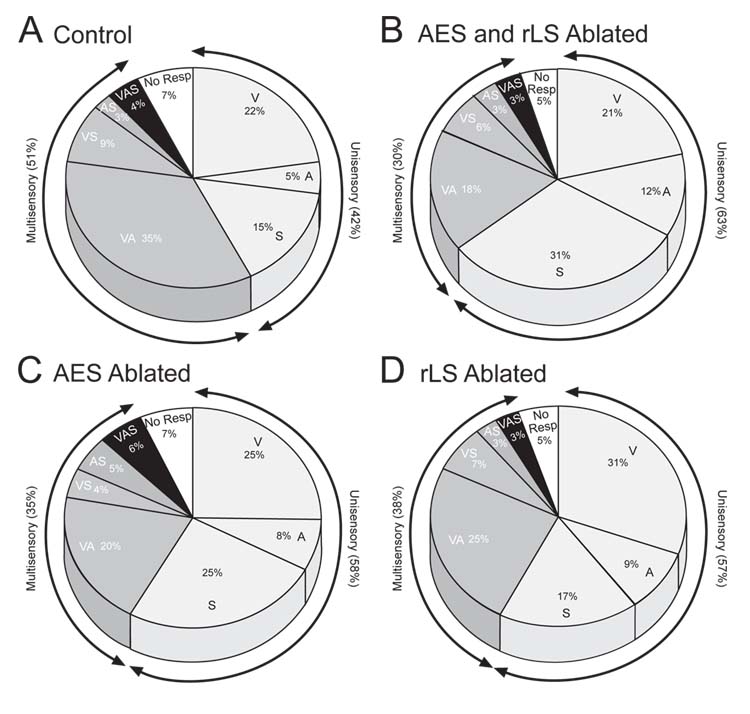
Modality Convergence Patterns: The pattern in control animals (A) was significantly (p < .05) altered by each of the neonatal lesions. Most significant in this context was the decrease in the incidence of multisensory neurons, which was greatest after combined lesions of AES & rLS (B) and least after ablation of either one of these areas (C & D). Each modality convergence type is indicated by letter(s), and the percentage of the entire neuronal sample is given as well. V=visual, A=auditory, S = somatosensory, No Resp. = unresponsive neurons.
Table II.
Proportion of multisensory neurons that exhibited multisensory integration.
| Modality | n | Enhancement | n | Depression | |
|---|---|---|---|---|---|
| Normal | All neurons | 299 | 190 (64%) | 143 | 105 (73%) |
| VA | 243 | 144 (59%) | 133 | 97 (73%) | |
| VS | 56 | 46 (82%) | 10 | 8 (80%) | |
| AES & rLS Lesion | All neurons | 219 | 32 (15%)* | 58 | 35 (60%)* |
| VA | 159 | 20 (13%)* | 51 | 31 (61%)* | |
| VS | 60 | 12 (20%)* | 7 | 4 (57%) | |
| AES or rLS Lesion | All neurons | 57 | 32 (56%) | 34 | 21 (62%) |
| VA | 47 | 28 (60%) | 29 | 18(62%) | |
| VS | 10 | 6 (60%) | 5 | 3 (60%) |
Pearson Chi-square, p<0.05.
Cortical Ablations
Figure 2 presents representative surface drawings and cross-section reconstructions of brains from each experimental group. Perhaps because of the large size of the ablated areas and the early maturational stage at which the ablations were made, at maturity substantial differences from normal were noted in sulcal and gyral patterns that extended well beyond the borders of the lesion. Note the shift of the lateral sulcus and its multiple sulcal offshoots, as well as the rostral shift and forward curvature of the posterior ectosylvian sulcus after AES & rLS ablation. These sulcal patterns did not match those in the intact hemisphere of these animals nor did they typify the normal brain. Configurational changes varied considerably among animals, and in some cases it appeared as if all the surrounding tissue had migrated and been stretched toward the lesion cavity, distorting the local cortical geometry in the process. In the absence of reliable cytoarchitectonics in rLS and in much of AES, these gross morphological changes made accurate cross-sectional reconstruction of the lesions problematic.
Figure 2.

Cortical lesion reconstructions. A schematic of the dorsolateral surface of the brain is shown at the bottom left. To the right is shown examples of combined AES & rLS ablations as well as ablations or AES or rLS individually. Note the presence of changes in tissue adjacent to, and distant from the lesion. Combined AES & rLS ablation produced changes in cortical architecture that were most pronounced in the posterior ectosylvian and coronal sulci. Particularly evident after AES lesions were changes in the lateral sulcus. It developed interruptions along its extent and multiple sulcal offshoots. Lesions of rLS were smallest and produced the fewest changes in cortical architecture. Above these illustrations of the dorsal aspect of the brain are cross-sections from the brains of these animals. Shaded areas on the cross sections illustrate areas that were not removed during the ablation but were damaged and necrotic. AES = anterior ectosylvian sulcus; L = lateral sulcus; LS = lateral suprasylvian sulcus; rLS = rostral lateral suprasylvian sulcus; PES = posterior ectosylvian sulcus.
Distortions of cortical architecture by the ablations may also have been facilitated by the inclusion of some of the underlying white matter. This occurred to a varying extent in each experimental group and would be expected to have produced functional consequences greater than those associated with the dimensions of the lesions on the cortical surface (see Discussion). In light of this, it was surprising to note that the actual changes in the multisensory properties of SC neurons after early lesions that were restricted to AES or rLS were minimal.
Animals With Neonatal Cortical Ablation of AES and rLS
The visual topography of the SC was used as a referent to ensure that the same regions of the SC were sampled in experimental and control groups. Though the rostral SC was most heavily sampled, particular attention was paid to sampling as much of the rostrocaudal extent of the structure as possible, so that neurons with small central (rostral), as well as large peripheral (caudal) receptive fields would be included. No obvious lesion-induced differences in visual topography were evident in experimental and control animals, and neither the average distance of the visual receptive field center from the midline nor its average size differed among experimental and control groups (control animals: average receptive field center was 12.2Ε∀7.7Ε contralateral, and average receptive field radius was 12.7Ε∀3.8Ε; whereas in animals with AES & rLS lesions the average receptive field center was 12.0Ε∀9.1Ε contralateral and the average radius was 13.0Ε∀ 4.8Ε). In addition, the lesions did not appear to change the incidence of sensory-responsive and unresponsive neurons/electrode penetration (see Table I).
Although all modality convergence patterns were evident in the SC of these animals (Fig. 3), there was some decrement in the incidence of multisensory neurons and a corresponding increase in the incidence of unisensory neurons. Particularly striking, however, was the observation that the spatial register of the different receptive fields of multisensory neurons was disrupted. Significant cross-modal receptive field misalignment is highly atypical of normal animals of any age.
Although receptive field misalignment in animals with these lesions appeared to be present in neurons with all multisensory convergence patterns, it was most readily quantified in visual-auditory neurons because their receptive fields are mapped in the same spatial coordinates. Individual examples of normal and atypical cross-modal receptive field alignments are shown in figure 4, and the distribution of neurons with different degrees of receptive field register are shown for each group in figure 5. Note that the modal range of receptive field overlap was 81–100% both in control animals and in animals with ablations of either AES or rLS. In the case of animals with combined AES & rLS ablations, however, the modal range was 0–20%, a significant decrease in receptive field overlap.
Figure 4.

Characteristic examples of visual-auditory receptive field overlap. A: It was common to find complete cross-modal receptive field overlap in multisensory neurons of normal (control) animals. But also shown (far left) is one of the infrequent examples in which there was < 50% overlap. Below are shown examples of the typical patterns of cross-modal receptive field overlap in animals with neonatal lesions of AES & rLS (B), AES (C) and rLS (D). Note that only combined lesions of AES & rLS disrupted the normal pattern.
Figure 5.
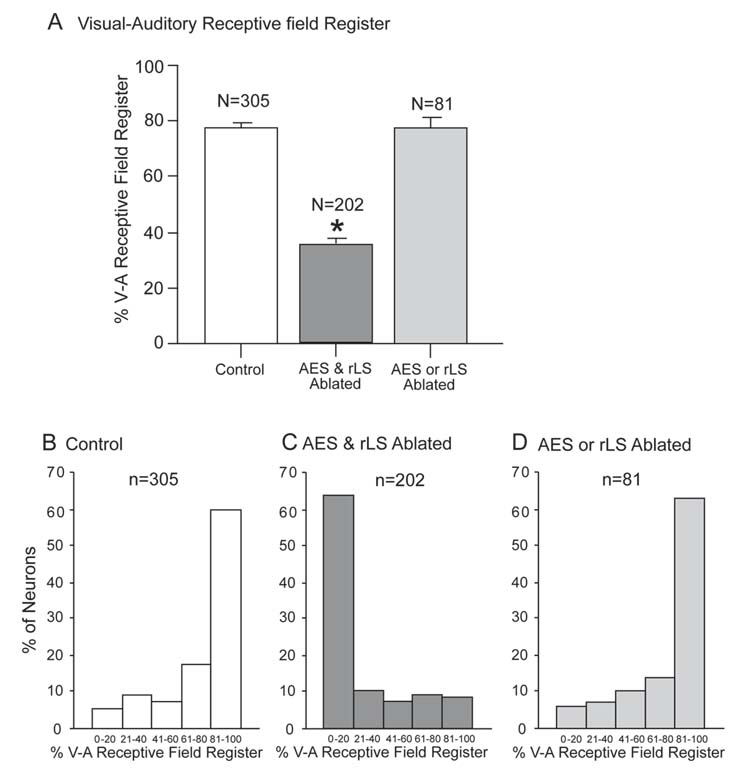
The percentage of visual-auditory receptive field register in SC neurons. A. The high degree of receptive field overlap characteristic of normal controls was significantly degraded in animals with combined AES & rLS lesions, but not in animals with single cortical lesions (AES or rLS)(vertical bars = SEM, * = < 0.05). This was also evident in the distribution of the incidence of neurons with differing degrees of receptive field overlap. B. In the majority of neurons in normal control animals, visual-auditory receptive field overlap exceeded 81%. C. However, in animals with combined AES & rLS ablation, the majority of neurons showed <20% overlap. D. Animals with either AES or rLS ablated showed no significant changes from normal.
Multisensory Integration: Enhancement
Of greatest significance in the present context was the substantial change in how the SC neurons of AES & rLS ablated animals responded to cross-modal stimuli. For purposes of comparison, a characteristic example of the responses to such stimuli in a normal animal is shown in figure 6. In this case nearly all the visual receptive field was subsumed within the auditory receptive field. Visual and auditory test stimuli were placed within their respective receptive fields in approximately the same spatial location and their intensities increased in successive tests. Increasing the intensity of the visual stimulus produced progressively more robust responses, but, in this particular neuron, the auditory response was largely insensitive to changes in stimulus intensity. When the two cross-modal stimuli were coupled, a significantly enhanced multisensory response was evoked. This response was significantly greater than was either unisensory response and was greater than the predicted sum of the unisensory responses at every intensity level tested. However, the magnitude of the enhancement decreased as the effectiveness of the visual stimulus increased, which is a typical pattern of inverse effectiveness (see Meredith and Stein, 1986a; Jiang et al., 2001).
Figure 6.
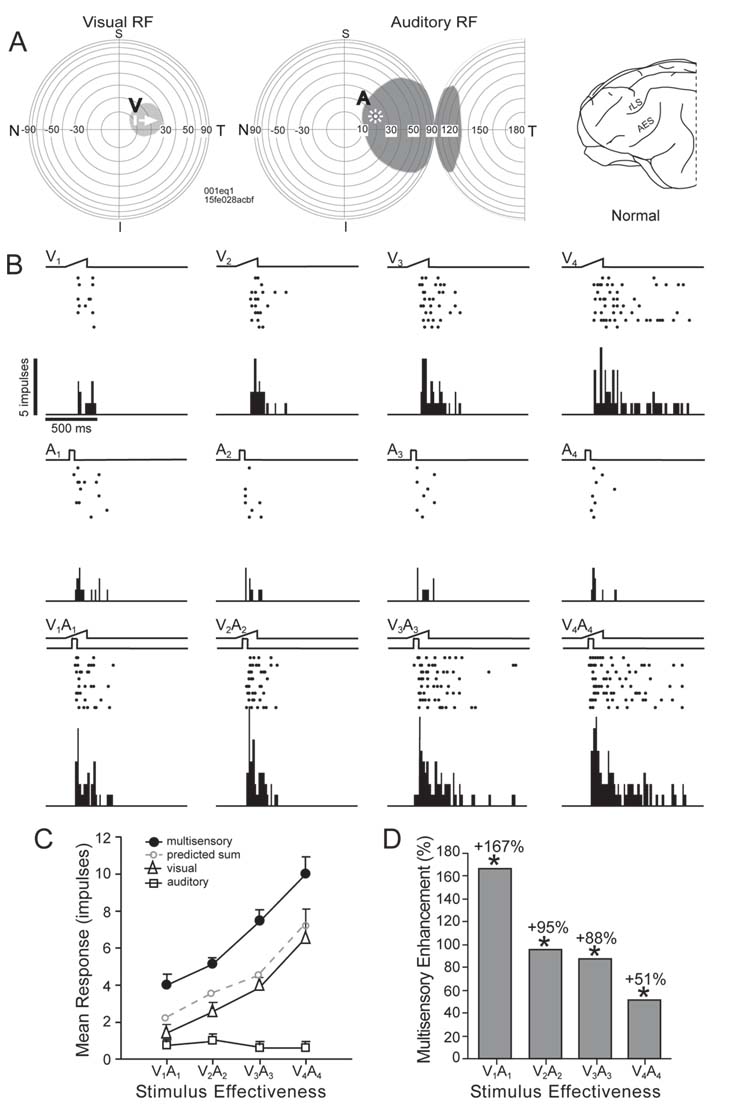
Multisensory enhancement evoked in a normal control SC neuron. A: Shown are the visual and auditory receptive fields (shaded area) of this neuron and the locations of visual and auditory test stimuli (icons labeled V and A). Each of the concentric circles in the schematics of visual and auditory space represents 10Ε (N=nasal, T=temporal). B: The ramp (visual, top row) and square wave (auditory, second row) above the rasters and peristimulus time histograms represent, respectively, the movement of the visual stimulus through the visual receptive field and the onset and offset of the auditory stimulus within the auditory receptive field. Stimulus intensity was increased in 4 steps (e.g., V1–V4), but only the visual response was modulated. Results of tests in which the spatially coincident cross-modal stimulus combination (V1A1, etc.) was presented are shown in the third row and reveal significantly enhanced responses at all intensities. These responses are plotted in the graph in C. Note that the cross-modal stimulus combination produced responses that exceeded the predicted sum of the visual and auditory responses at each of the intensities tested. Vertical lines through the points show the standard errors of the mean. The average magnitude of each enhanced response is plotted in D. *p < .05).
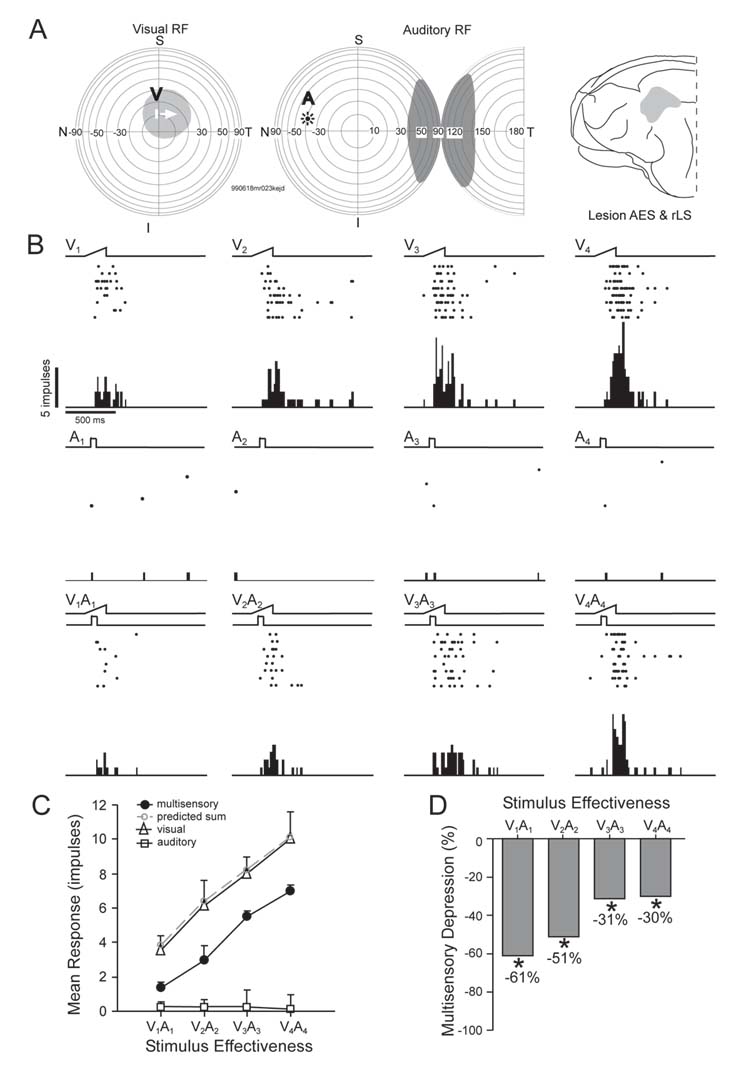
Figure 7 shows an example of a typical visual-auditory neuron from an animal that had AES & rLS ablated as a neonate. Immediately obvious is that, while the visual receptive field is central, the auditory receptive field is far peripheral; they do not overlap each other. Despite this abnormality in cross-modal receptive field register, the unisensory responses evoked by the modality-specific visual and auditory stimuli were quite similar to those obtained in the normative example in figure 6: the visual response was strongly graded by stimulus intensity, while the auditory response showed far less modulation. Nevertheless, the multisensory response was quite different from that obtained above. Absent was the enhanced response to the cross-modal stimulus combination. Rather, the multisensory response was not substantially different from the visual response at any of the stimulus intensity levels examined and was, thus, significantly below the predicted sum of the unisensory responses at each of these stimulus intensity levels.
Figure 7.

Neonatal ablation of AES & rLS disrupted the development of SC multisensory enhancement. The ablated area of cortex is shown as shading on the schematic of the brain (upper right in {A}). Characteristically, spatially coincident cross-modal stimuli failed to evoke multisensory enhancement at any stimulus intensity and the multisensory response was less than the response predicted by summing the individual unisensory responses (B & C). The multisensory response was nearly identical to the best unisensory response (visual). All conventions are the same as in previous figures.
Although the overwhelming majority of SC neurons in animals with combined ablation of AES & rLS responded to cross-modal stimuli much as did the neuron in figure 7, there was a small minority of neurons (32/219,15%, see Table II) that were capable of multisensory enhancement. These 32 examples included both visual-auditory (n = 20) and visual-somatosensory (n =12) neurons. One possibility is that this capability developed in these particular neurons independent of cortical influences, but another is that some of the relevant cortical tissue was spared by the lesion and developed the capability to support this SC function. To test the possibility of spared cortical tissue supporting this function, several (n = 3) of these neurons were studied prior to, during, and after cortical deactivation.
Cortical deactivation was accomplished via a cryogenic probe that had been placed over the AES/rLS lesion site and which, when activated, could lower cortical temperature below that necessary for cortical neurons to function (see Methods, see also Jiang et al., 2001, 2002; Jiang and Stein, 2003). In 2 of the 3 neurons studied, the same results were obtained: responses to the modality-specific stimuli remained, but multisensory enhancement was eliminated. The data obtained from one of these neurons is illustrated in figure 8. Although this visual-somatosensory neuron did not show the expected degree of cross-modal receptive field alignment (central visual fields are generally coupled with somatosensory receptive fields that include portions of the face or head, see Stein and Meredith, 1993), it did respond to cross-modal stimuli with an enhanced multisensory response. The enhancement was eliminated during cortical deactivation despite the absence of a significant change in either of the unisensory responses. Reactivating (i.e., rewarming) cortex reinstated multisensory enhancement to its pre-deactivation level within several minutes. This result suggests that spared cortex at the lesion site accounted for these multisensory capabilities in these neurons, and raises the possibility that it might have accounted for these properties in other neurons as well (see Discussion).
Figure 8.

The rare cases of SC multisensory enhancement following neonatal AES & rLS lesions may reflect spared cortex at or around the lesion site. This visual-somatosensory SC neuron (the receptive fields are depicted in A) showed significant response enhancement to the combination of visual and somatosensory stimuli (B). The combined response was 77% better than the response to the most effective modality-specific stimulus (visual) and equal to the sum of the visual and somatosensory responses as shown in C (“control”). However, cryogenic deactivation at the lesion site eliminated this enhancement, rendering the multisensory response equal to the visual response. Reactivation of the tissue at the lesion site reinstated the multisensory enhancement. All conventions are the same as in previous figures.
It is interesting to note that multisensory enhancement occurred in this neuron (Fig. 8) despite the poor register of its cross-modal receptive fields, something that is generally not seen in normal SC neurons. When the likelihood of cross-modal receptive field register was examined quantitatively among visual-auditory neurons from AES & rLS ablated animals (n=159), it was found that fewer of those having < 40% receptive field overlap (4/65, 6%) showed multisensory enhancement than those having > 40% cross-modal receptive field overlap (16/84, 19%, see Fig. 9). Apparently, these factors were somewhat interrelated, but were not inextricably linked. Thus, ablation appears to have affected them in a somewhat independent fashion.
Figure 9.

The probability of multisensory enhancement in SC neurons following neonatal ablation of AES & rLS was greatest when receptive field overlap exceeded 40%.
Multisensory Integration: Depression
There was also a statistically significant decrease in the incidence of neurons exhibiting multisensory depression in these lesioned animals. Nevertheless, there was not a direct parallel between the effects of combined neonatal AES & rLS ablation on the development of the two indices of multisensory integration. Many neurons did develop the ability to exhibit multisensory depression (see Table II), albeit the magnitude of that depression was usually less than that observed in normal animals, where it is not uncommon to find that even robust within-field excitatory responses can be eliminated by a spatially-disparate cross-modal stimulus (Jiang and Stein, 2003).
An illustrative example of a multisensory neuron in an animal that had AES & rLS removed as a neonate is presented in figure 10. This neuron had a significant disruption of cross-modal receptive field register, though this didn’t affect its unisensory responses. Robust and intensity-graded responses were evoked by visual stimuli. These responses were substantially degraded by a spatially disparate auditory stimulus that was outside its receptive field, and the multisensory depression was inversely related to the effectiveness of the visual stimulus, just as in SC neurons of normal control animals. Although the magnitude of the multisensory depression was somewhat less than in control animals, and no examples were noted in which the excitatory response was eliminated, this example demonstrates that the ability of these animals to develop a substantial degree of multisensory depression is independent of the presence of AES and rLS.
Figure 10.
A good deal of multisensory depression was preserved in SC neurons following combined neonatal AES & rLS lesions. A: The visual and auditory stimuli were spatially disparate, with the visual stimulus within its receptive field and the auditory stimulus outside its receptive field. B: The visual stimulus produced reliable responses at each of the 4 stimulus intensities presented, but the auditory stimulus failed to evoke responses. When the stimuli were presented in combination, the eccentric auditory stimulus degraded the effectiveness of the visual stimulus at each level of stimulus effectiveness. These data are plotted in the graph shown in C. Note that the proportionate magnitude of the response depression was greatest when visual effectiveness was weakest (D). All conventions are the same as in previous figures.
Animals with Neonatal Ablation of AES or rLS
The data in Tables I and II and in figure 3 reveal that the sample of neurons obtained in the SC of the animals with lesions restricted to either AES or rLS was, like that in AES & rLS ablated animals, similar to the data obtained in control animals. Thus, the average receptive field center in the sample was 10.3Ε ∀ 7.4Ε contralateral and the average radius was 12.8Ε∀ 5.8Ε. In addition, the lesions did not appear to change the incidence of sensory-responsive and unresponsive neurons/electrode penetration (see Table I).
Surprisingly, however, despite the magnitude of the cortical lesions in these animals (Fig. 2), and the potent disruptive effects that they would be expected to produce on SC multisensory properties in normal adults (see Wallace and Stein, 1994; Jiang et al., 2001), few functional differences from control animals were noted here. All possible modality convergence patterns were evident, though their relative distributions were somewhat altered (see Table I and Fig. 3). Similarly, the average degree of visual-auditory receptive field overlap was just as impressive in the animals with ablation of either AES or rLS as it was in normal control animals (in all cases the averages were 77–78% and were not statistically different). Representative examples of receptive field overlap are shown in figure 4. Because there were no significant differences in any of the SC multisensory properties examined here in animals with a single cortical region ablated, their data were combined in subsequent analyses.
The absence of a significant impact of ablation of either of these cortical areas individually on the development of SC multisensory neuronal properties is also evident in figure 5. Here the distribution of neurons with different degrees of cross-modal spatial register can be seen to be similar to that found in control animals. However, most pertinent to the present discussion is the absence of a change in the most salient functional characteristic of multisensory SC neurons: the ability to synthesize their multiple sensory inputs. Multisensory neurons in AES-ablated and rLS-ablated animals were as capable of integrating spatially coincident (and spatially disparate) cross-modal stimuli to enhance (or depress) their responses as were normal adults, and similar proportions of neurons in each of these groups exhibited this ability. Furthermore, there were no apparent differences in the magnitudes of multisensory enhancement or multisensory depression among the groups (Table II). The principal difference between the multisensory data obtained from these animals and normal control animals appeared to be restricted to a decrease in the incidence of multisensory neurons and a concomitant increase in the incidence of unisensory neurons (fig. 3).
DISCUSSION
Neonatal Lesions of AES & rLS
Cross-modal receptive field register
Combined ablation of AES & rLS led to strikingly abnormal multisensory development in the SC such that the multisensory capacities of these animals appeared to be fundamentally different than those of normal controls. The most obvious anomaly was that cross-modal receptive field misregister became the rule rather than the exception. This is exceedingly rare in both normal animals (see Stein et al., 2004) and in animals reared in abnormal visual environments. In the latter cases the nonvisual representations generally accommodate to the experience-induced changes in the visual topography in ways that maintain cross-modal map and receptive field alignment (see Wallace et al., 2004; King et al., 1988; Knudsen and Brainard, 1991). These changes were also quite different than those noted during temporary cryogenic deactivation of AES & rLS, which had no effect on the overall register of a neuron’s different receptive fields (e.g., see Jiang et al., 2001).
But visual-auditory map misregister has been noted in adult ferret SC after neonatal lesions (King et al., 1998) and after the neonatal application of NMDA receptor antagonists (Schnupp et al., 1995) to the superficial (visual) layers of this structure. These observations indicated that superficial-deep layer visual signaling is critical during early life for both the overall alignment of the visual and auditory maps and the receptive field registration in the multisensory neurons that help form them. The superficial and deep layer visual maps are aligned with one another in adult cats (Meredith and Stein, 1990), so that misalignment of the superficial visual and deep auditory maps would also indicate a misalignment of visual-auditory receptive fields in deep layer multisensory neurons. Indeed, in the few such neurons examined, receptive field misregister was apparent. Thus, the normal alignment of visual-auditory receptive fields in adult animals was assumed by King and colleagues to be accomplished either via signals carried directly over superficial to deep interlaminar projections (see Moschovakis et al., 1988; Behan and Appel, 1992; Mooney et al., 1992; Lee et al., 1997; Doubell et al., 2003; Meredith and King, 2004) or via a relay through the nucleus of the brachium of the inferior colliculus (Schnupp and King, 1997). The ferret and cat brains are very much alike and there is every reason to expect that the same experimental procedures would produce similar results in cat.
One implication of the findings of King et al. (1998) and Schnupp et al. (1995) is that the interlaminar visual inputs play a unique role in aligning visual and auditory receptive fields. But the present results show that the development of visual-auditory receptive field alignment, as well as all other cross-modal receptive field alignments in the SC, depends on cortical inputs. Interlaminar SC inputs were not directly compromised here. While it is possible that disrupting the integrity of superficial laminae in previous experiments somehow compromised the maintenance and/or targeting of cortical afferents to deep layer multisensory neurons, it is also possible that inputs from a variety of afferent sources are required for SC neurons to properly align their cross-modal receptive fields. Furthermore, although it is tempting to link the present observations uniquely to disruptions in visual afferents from AES & rLS, the cortico-collicular projections from these areas contain visual, auditory and somatosensory fibers. Thus, it is not yet possible to exclude nonvisual contributions to the maturation of SC cross-modal receptive field alignment and multisensory integration.
Multisensory integration: enhancement
Most significant in the current context is that the lesions induced a failure of SC neurons to develop aligned receptive fields and this was generally accompanied by an inability to properly integrate cross-modal stimuli. The covariance of these two factors was previously noted when two rare examples of visual-auditory receptive field misalignment were encountered in the SC of normal monkeys (see Wallace et al., 1996). There is no compelling reason to suspect a causal relationship between them, as the present study has noted that alignment did not guarantee the ability to exhibit multisensory enhancement (see also Jiang et al., 2001, Wallace et al., 2004), misalignments did not preclude this ability (see also Wallace et al., 2002), and multisensory integration can be eliminated by cortical deactivation without altering cross-modal receptive field register (Jiang et al., 2001). Nevertheless, the data strongly suggest that both factors can be linked to a common cause: the failure of individual SC neurons to obtain appropriate cortical influences during early postnatal development.
The small proportion of SC neurons that did exhibit multisensory enhancement appeared to have done so as the result of influences from regions spared by the cortical lesion. As might be expected, their cross-modal receptive field register was also somewhat better than their counterparts incapable of multisensory enhancement. That the sparing of AES and/or rLS tissue is responsible for the development of multisensory integration in these neurons is suggested by the observation that reversible cryogenic blockade of the lesion site could eliminate this capability. Unfortunately, given the marked geometric reorganization of the cortex, and the difficulty of using cytoarchitectural cues to distinguish rLS and the visual and auditory regions of AES from surrounding tissue in animals with neonatal lesions and the small number of neurons tested with cryogenic deactivation, it is impossible to categorically exclude the possibility that adjacent tissue invaded the lesion site, developed projections to the SC, and became capable of supporting multisensory processes. Similarly, one cannot exclude the possibility that these properties formed independent of cortical influences. Nevertheless, these possibilities seem less likely than does the sparing and subsequent maturation of some AES and/or rLS tissue.
Multisensory integration: depression
The early loss of AES & rLS also degraded multisensory depression, but the incidence of this capacity was reduced by only 13%. The fact that cortical lesions did not degrade multisensory depression as severely as multisensory enhancement is in keeping with data from normal adults. Whereas multisensory enhancement is eliminated in nearly all cases by reversible deactivation of AES and rLS (Jiang et al., 2001), multisensory depression, albeit of reduced magnitude, can be retained in about half the normal number of SC neurons (Jiang and Stein, 2003). This underscores the difference in the circuitry underlying these two indices of multisensory integration, and suggests that the development of multisensory depression was contingent on compensation from tissue other than AES or rLS. Whether this involved changes in the functional organization of other colliculopetal systems, alterations within intrinsic SC circuitry or both is not yet known. It is also possible, albeit less likely, that spared tissue at the lesion site was more capable of supporting multisensory depression than multisensory enhancement. Thus, it is unfortunate that multisensory depression was not examined during cortical deactivation to examine this possibility.
Neonatal Lesions of AES or rLS
In contrast to the striking developmental deficits induced by combined AES & rLS removal during early life, the development of SC multisensory properties proved to be minimally affected by neonatal removal of AES or rLS. With the exception of some modest changes in modality convergence patterns, the functional properties of multisensory neurons were very much like those in control animals, a surprising finding given that both AES and rLS are critical for multisensory integration in normal SC neurons (Wallace and Stein, 1994; Jiang et al., 2001). Normally, the loss of influences from either cortex renders large percentages of adult SC neurons incapable of multisensory enhancement: AES affects 78% and rLS affects 45% of the neurons in this way (some are influenced by both areas, see Jiang et al., 2001). Similarly, the loss of influences from either cortical area alone has nearly the same effect as their combined loss: it eliminates multisensory depression from the majority of SC neurons and degrades its magnitude in the remainder (Jiang and Stein, 2003). These changes are evident as impairments in the synergistic use of cross-modal cues to guide behavior (Wilkinson et al., 1996; Jiang et al., 2002; see also Burnett et al., 2004).
Brain plasticity is maximal in early life, a period during which the functional organization of the SC is crafted to accommodate the specifics of the sensory environment (e.g., see Stein and Gordon, 1981; Stein, 1984; Rauschecker 1999; Wallace et al., 2002; King et al., 2004; Gutfreund and Knudsen, 2004). The present observations suggest that this plasticity extends to compensating for the early loss of either of the cortical areas normally essential for SC multisensory integration. Compensation of one cortex for the neonatal loss of another has been observed previously (e.g., see Payne 1999; Sun et al., 1994; Guido et al., 1990; 1992; Spear et al., 1988). Presumably, compensation in the present case depends on changes in the intact region, via either the retention and functional maturation of exuberant projections or an expansion of its projection to neurons that it does not normally target. Although an expansion of a cortico-collicular projection from suprasylvian cortex has been observed as a consequence of lesions to primary visual cortex (Sun et al., 1994), thereby lending credence to the idea of an expanded cortico-collicular projection from AES or rLS, it is not possible to exclude the possibility that some spared cortical tissue within the lesioned areas was able to dramatically expand its normal SC target territory. These, of course, are not mutually exclusive possibilities. Although there are a number of other possible explanations involving other SC-projecting regions, the fact that AES and rLS normally are endowed with the capability of underlying this function, and the consequences of their combined loss during early life (see above), make this a parsimonious explanation. Whether this sort of compensatory plasticity is retained into adulthood is not yet known, as studies evaluating the influences of cortex on the multisensory properties of adult SC neurons have all involved short-term reversible deactivation techniques.
Conclusions
The present study demonstrates that AES & rLS influences are essential for the normal maturation of SC multisensory processes. It also shows that there is considerable developmental plasticity in these cortical influences. This finding is in contrast with the absence of compensation for other unisensory functional properties of SC neurons that also depend on descending influences, albeit from other regions of sensory cortex (see Stein and Magalhães-Castro, 1975; Stein and Gallagher, 1981). The key differences may be specific to variability in the degree of plasticity in different regions of cortex. However, it may also reflect the inherent flexibility of a system that involves interrelated cortical regions in the same process, so that when one is damaged during early development, the functional target territory of the other is expanded in compensation. When both areas are compromised, the possibility for compensation is lost because the brain is unable to use alternative colliculopetal circuits to develop and maintain this particular capability. These observations emphasize both the functional plasticity and functional specificity of the descending cortical projection systems that are essential for crafting SC multisensory integration and the SC-mediated behaviors that depend on it.
Acknowledgments
We thank Nancy London for technical assistance, and Drs. Mark T. Wallace and M. Alex Meredith for helpful discussions. This research was supported by NIH grant NS 36916 & NS35008.
References
- Behan M, Appell PP. Intrinsic circuitry in the cat superior colliculus: Projections from the superficial layers. J Comp Neurol. 1992;315:230–243. doi: 10.1002/cne.903150209. [DOI] [PubMed] [Google Scholar]
- Bell AH, Corneil BD, Meredith MA, Munoz DP. The influence of stimulus properties on multisensory processing in the awake primate superior colliculus. Can J Exp Psychol. 2001;55:123–132. doi: 10.1037/h0087359. [DOI] [PubMed] [Google Scholar]
- Benedek G, Norita M, Creutzfeldt OD. Electrophysiological and anatomical demonstration of an overlapping striate and tectal projection to the lateral posterior-pulvinar complex of the cat. Exp Brain Res. 1983;52:157–169. doi: 10.1007/BF00236624. [DOI] [PubMed] [Google Scholar]
- Binns KE, Salt TE. Importance of NMDA receptors for multimodal integration in the deep layers of the cat superior colliculus. J Neurophysiol. 1996;75:920–930. doi: 10.1152/jn.1996.75.2.920. [DOI] [PubMed] [Google Scholar]
- Buonomano DV, Merzenich MM. Cortical plasticity from synapses to maps. Ann Rev Neurosci. 1998;21:149–186. doi: 10.1146/annurev.neuro.21.1.149. [DOI] [PubMed] [Google Scholar]
- Burnett LR, Stein BE, Chapins D, Wallace MT. Superior colliculus lesions preferentially disrupt multisensory orientation. Neuroscience. 2004;124:535–547. doi: 10.1016/j.neuroscience.2003.12.026. [DOI] [PubMed] [Google Scholar]
- Calvert GA, Hansen PC, Iversen SD, Brammer MJ. Detection of audio-visual integration sites in humans by application of electrophysiological criteria to the BOLD effect. NeuroImage. 2001;14:427–438. doi: 10.1006/nimg.2001.0812. [DOI] [PubMed] [Google Scholar]
- Clemo HR, Stein BE. Somatosensory cortex: a ‘new’ somatotopic representation. Brain Res. 1982;235:162–168. doi: 10.1016/0006-8993(82)90207-4. [DOI] [PubMed] [Google Scholar]
- Clemo HR, Stein BE. Organization of a fourth somatosensory area of cortex in cat. J Neurophysiol. 1983;50:910–925. doi: 10.1152/jn.1983.50.4.910. [DOI] [PubMed] [Google Scholar]
- Clemo HR, Stein BE. Topographic organization of somatosensory corticotectal influences in cat. J Neurophysiol. 1984;51:843–858. doi: 10.1152/jn.1984.51.5.843. [DOI] [PubMed] [Google Scholar]
- Clemo HR, Stein BE. Effects of cooling somatosensory cortex on response properties of tactile cells in the superior colliculus. J Neurophysiol. 1986;55:1352–1368. doi: 10.1152/jn.1986.55.6.1352. [DOI] [PubMed] [Google Scholar]
- Doubell TP, Skaliora I, Baron J, King AJ. Functional connectivity between the superficial and deeper layers of the superior colliculus: an anatomical substrate for sensorimotor integration. J Neurosci. 2003;23:6596–6607. doi: 10.1523/JNEUROSCI.23-16-06596.2003. [DOI] [PMC free article] [PubMed] [Google Scholar]
- Drager UC, Hubel DH. Topography of visual and somatosensory projections in mouse superior colliculus. J Neurophysiol. 1976;39:91–101. doi: 10.1152/jn.1976.39.1.91. [DOI] [PubMed] [Google Scholar]
- Frens MA, Van Opstal AJ. Visual-auditory interactions modulate saccade-related activity in monkey superior colliculus. Brain Res Bull. 1998;46:211–224. doi: 10.1016/s0361-9230(98)00007-0. [DOI] [PubMed] [Google Scholar]
- Guido W, Spear PD, Tong L. Functional compensation in the lateral suprasylvian visual area following bilateral visual cortex damage in kittens. Exp Brain Res. 1990;83:219–224. doi: 10.1007/BF00232212. [DOI] [PubMed] [Google Scholar]
- Guido W, Spear PD, Tong L. How complete is physiological compensation in extrastriate cortex after visual cortex damage in kittens? Exp Brain Res. 1992;91:455–466. doi: 10.1007/BF00227841. [DOI] [PubMed] [Google Scholar]
- Gutfreund Y and Knudsen EI. Visual instruction of the auditory space map in the midbrain. In: The Handbook of Multisensory Processes, edited by Calvert GA, Spence C, and Stein BE. Cambridge, MA: MIT Press, 2004, p. 613–624.
- Horel JA. Use of cold to reversibly suppress local brain function in behaving animals. Methods Neurosci. 1991;7:97–100. [Google Scholar]
- Huerta MF and Harting JK (1984) The mammalian superior colliculus. Studies of its morphology and connections. In: Comparative Neurology of the Optic Tectum, edited by Vanegas H. New York: Plenum, 1984, p. 687–773.
- Jiang H, Lepore F, Ptito M, Guillemot J-P. Sensory modality distribution in the anterior ectosylvian cortex (AEC) Exp Brain Res. 1994a;97:404–414. doi: 10.1007/BF00241534. [DOI] [PubMed] [Google Scholar]
- Jiang H, Lepore F, Ptito M, Guillemot J-P. Sensory interactions in the anterior ectosylvian cortex of cats. Exp Brain Res. 1994b;101:385–396. doi: 10.1007/BF00227332. [DOI] [PubMed] [Google Scholar]
- Jiang, W Stein BE (2002) Effect of early ablation of anterior ectosylvian (AES) and rostral lateral suprasylvian (rLS) cortex on multisensory processes in the superior colliculus (SC). 2002 Abstract Viewer/Itinerary Planner Society for Neuroscience: Program No. 560.6., 2003.
- Jiang W, Stein BE. Cortex controls multisensory depression in superior colliculus. J Neurophysiol. 2003;90:2123–2135. doi: 10.1152/jn.00369.2003. [DOI] [PubMed] [Google Scholar]
- Jiang W, Wallace MT, Jiang H, Vaughan JW, Stein BE. Two cortical areas mediate multisensory integration in superior colliculus neurons. J Neurophysiol. 2001;85:506–522. doi: 10.1152/jn.2001.85.2.506. [DOI] [PubMed] [Google Scholar]
- Jiang W, Jiang H, Stein BE. Two corticotectal areas facilitate multisensory orientation behavior. J Cogn Neurosci. 2002;14:1240–1255. doi: 10.1162/089892902760807230. [DOI] [PubMed] [Google Scholar]
- Kadunce DC, Vaughan JW, Wallace MT, Benedek G, Stein BE. Mechanisms of within- and cross-modality suppression in the superior colliculus. J Neurophysiol. 1997;78:2834–2847. doi: 10.1152/jn.1997.78.6.2834. [DOI] [PubMed] [Google Scholar]
- Kadunce DC, Vaughan JW, Wallace MT, Stein BE. The influence of visual and auditory receptive field organization on multisensory integration in the superior colliculus. Exp Brain Res. 2001;139:303–310. doi: 10.1007/s002210100772. [DOI] [PubMed] [Google Scholar]
- Kao CQ, McHaffie JG, Meredith MA, Stein BE. Functional development of a central visual map in cat. J Neurophysiol. 1994;72:266–272. doi: 10.1152/jn.1994.72.1.266. [DOI] [PubMed] [Google Scholar]
- Kadunce DC, Vaughn JW, Wallce MT, Stein BE. The influence of visual and auditory receptive field organization on multisensory integration in the superior colliculus. Exp. Brain Res. 2001;139:303–310. doi: 10.1007/s002210100772. [DOI] [PubMed] [Google Scholar]
- King AJ, Palmer AR. Integration of visual and auditory information in bimodal neurones in the guinea-pig superior colliculus. Exp Brain Res. 1985;60:492–500. doi: 10.1007/BF00236934. [DOI] [PubMed] [Google Scholar]
- King AJ, Hutchings ME, Moore DR, Blakemore C. Developmental plasticity in the visual and auditory representations in the mammalian superior colliculus. Nature. 1988;332:73–76. doi: 10.1038/332073a0. [DOI] [PubMed] [Google Scholar]
- King AJ, Schnupp JW, Thompson ID. Signals from the superficial layers of the superior colliculus enable the development of the auditory space map in the deeper layers. J Neurosci. 1998;18:9394–9408. doi: 10.1523/JNEUROSCI.18-22-09394.1998. [DOI] [PMC free article] [PubMed] [Google Scholar]
- King AJ, Doubell TP and Skaliora I. Epigenetic factors that align visual and auditory maps in the ferret midbrain. In: The Handbook of Multisensory Processes, edited by Calvert GA, Spence C, and Stein BE. Cambridge, MA: MIT Press, 2004, p.599–612.
- Knudsen EI, Brainard MS. Visual instruction of the neural map of auditory space in the developing optic tectum. Science. 1991;253:85–87. doi: 10.1126/science.2063209. [DOI] [PubMed] [Google Scholar]
- Lee PH, Helms MC, Augustine GJ, Hall WC. Role of intrinsic synaptic circuitry in collicular sensorimotor integration. Proc Natl Acad Sci. 1997;94:13299–13304. doi: 10.1073/pnas.94.24.13299. [DOI] [PMC free article] [PubMed] [Google Scholar]
- Lomber SG, Payne BR, Horel JA. The cryoloop: an adaptable reversible cooling deactivation method for behavioral or electrophysiological assessment of neural function. J Neurosci Meth. 1999;86:179–194. doi: 10.1016/s0165-0270(98)00165-4. [DOI] [PubMed] [Google Scholar]
- McHaffie JG, Stein BE. A chronic headholder minimizing facial obstructions. Brain Res Bull. 1983;10:859–860. doi: 10.1016/0361-9230(83)90220-4. [DOI] [PubMed] [Google Scholar]
- McHaffie JG, Kruger L, Clemo HR, Stein BE. Corticothalamic and corticotectal somatosensory projections from the anterior ectosylvian sulcus (SIV cortex) in neonatal cats: an anatomical demonstration with HRP and 3H-leucine. J Comp Neurol. 1988;274:115–126. doi: 10.1002/cne.902740111. [DOI] [PubMed] [Google Scholar]
- Meredith MA. Corticocortical connectivity of cross-modal circuits. In: The Handbook of Multisensory Processes, edited by Calvert GA, Spence C, and Stein BE. Cambridge, MA: MIT Press, 2004, p.343–355.
- Meredith MA, Clemo HR. Auditory cortical projection from the anterior ectosylvian sulcus (Field AES) to the superior colliculus in the cat: an anatomical and electrophysiological study. J Comp Neurol. 1989;289:687–707. doi: 10.1002/cne.902890412. [DOI] [PubMed] [Google Scholar]
- Meredith MA, King AJ. Spatial distribution of functional superficial-deep connections in the adult ferret superior colliculus. Neuroscience. 2004;128:861–870. doi: 10.1016/j.neuroscience.2004.06.060. [DOI] [PubMed] [Google Scholar]
- Meredith MA, Stein BE. Interactions among converging sensory inputs in the superior colliculus. Science. 1983;221:389–391. doi: 10.1126/science.6867718. [DOI] [PubMed] [Google Scholar]
- Meredith MA, Stein BE. Visual, auditory, and somatosensory convergence on cells in superior colliculus results in multisensory integration. J Neurophysiol. 1986a;56:640–662. doi: 10.1152/jn.1986.56.3.640. [DOI] [PubMed] [Google Scholar]
- Meredith MA, Stein BE. Spatial factors determine the activity of multisensory neurons in cat superior colliculus. Brain Res. 1986b;365:350–354. doi: 10.1016/0006-8993(86)91648-3. [DOI] [PubMed] [Google Scholar]
- Meredith MA, Stein BE. The visuotopic component of the multisensory map in the deep laminae of the cat superior colliculus. J Neurosci. 1990;10:3727–3742. doi: 10.1523/JNEUROSCI.10-11-03727.1990. [DOI] [PMC free article] [PubMed] [Google Scholar]
- Meredith MA, Stein BE. Spatial determinants of multisensory integration in cat superior colliculus. J Neurophysiol. 1996;75:1843–1857. doi: 10.1152/jn.1996.75.5.1843. [DOI] [PubMed] [Google Scholar]
- Middlebrooks JC, Knudsen EI. A neural code for auditory space in the cat’s superior colliculus. J Neurosci. 1984;4:2621–2634. doi: 10.1523/JNEUROSCI.04-10-02621.1984. [DOI] [PMC free article] [PubMed] [Google Scholar]
- Mooney RD, Huang X, Rhoades RW. Functional influence of interlaminar connections in the hamster superior colliculus. J Neurosci. 1992;12:2417–2432. doi: 10.1523/JNEUROSCI.12-06-02417.1992. [DOI] [PMC free article] [PubMed] [Google Scholar]
- Moschovakis AK, Karabelas AB, Highstein SM. Structure-function relationships in the primate superior colliculus. I. Morphological classification of efferent neurons. J Neurophysiol. 1988;60:232–262. doi: 10.1152/jn.1988.60.1.232. [DOI] [PubMed] [Google Scholar]
- Mucke L, Norita M, Benedek G, Creutzfeldt O. Physiologic and anatomic investigation of a visual cortical area situated in the ventral bank of the anterior ectosylvian sulcus of the cat. Exp Brain Res. 1982;46:1–11. doi: 10.1007/BF00238092. [DOI] [PubMed] [Google Scholar]
- Norita M, Mucke L, Benedek G, Albowitz B, Katoh Y, Creutzfeldt OD. Connections of the anterior ectosylvian visual area (AEV) Exp Brain Res. 1986;62:225–240. doi: 10.1007/BF00238842. [DOI] [PubMed] [Google Scholar]
- Olson CR, Graybiel AM. Ectosylvian visual area of the cat: location, retinotopic organization, and connections. J Comp Neurol. 1987;261:277–294. doi: 10.1002/cne.902610209. [DOI] [PubMed] [Google Scholar]
- Payne BR. System-wide repercussions and adaptive plasticity: the sequelae of immature visual cortex damage. Restor Neurol Neurosci. 1999;15:81–106. [PubMed] [Google Scholar]
- Peck CK. Visual-auditory integration in cat superior colliculus: implications for neuronal control of the orienting response. Prog Brain Res. 1996;112:167–177. doi: 10.1016/s0079-6123(08)63328-2. [DOI] [PubMed] [Google Scholar]
- Perrault TJ, Jr, Vaughan JW, Stein BE, Wallace MT. Neuron-specific response characteristics predict the magnitude of multisensory integration. J Neurophysiol. 2003;90:4022–4026. doi: 10.1152/jn.00494.2003. [DOI] [PubMed] [Google Scholar]
- Perrault TJ, Jr, Vaughan JW, Stein BE, Wallace MT. Superior colliculus neurons use distinct operational modes in the integration of multisensory stimuli. J Neurophysiol. 2005;93:2575–2586. doi: 10.1152/jn.00926.2004. [DOI] [PubMed] [Google Scholar]
- Populin LC, Yin TC. Bimodal interactions in the superior colliculus of the behaving cat. J Neurosci. 2002;22:2826–2834. doi: 10.1523/JNEUROSCI.22-07-02826.2002. [DOI] [PMC free article] [PubMed] [Google Scholar]
- Rauschecker JP. Auditory cortical plasticity: a comparison with other sensory systems. Trends Neurosci. 1999;22:74–80. doi: 10.1016/s0166-2236(98)01303-4. [DOI] [PubMed] [Google Scholar]
- Scannell JW, Blakemore C, Young MP. Analysis of connectivity in the cat cerebral cortex. J Neurosci. 1995;15:1463–1483. doi: 10.1523/JNEUROSCI.15-02-01463.1995. [DOI] [PMC free article] [PubMed] [Google Scholar]
- Schnupp JW, King AJ. Coding for auditory space in the nucleus of the brachium of the inferior colliculus in the ferret. J Neurophysiol. 1997;78:2717–2731. doi: 10.1152/jn.1997.78.5.2717. [DOI] [PubMed] [Google Scholar]
- Schnupp JW, King AJ, Smith AL, Thompson ID. NMDA-receptor antagonists disrupt the formation of the auditory space map in the mammalian superior colliculus. J Neurosci. 1995;15:1516–1531. doi: 10.1523/JNEUROSCI.15-02-01516.1995. [DOI] [PMC free article] [PubMed] [Google Scholar]
- Segal RL, Beckstead RM. The lateral suprasylvian corticotectal projection in cats. J Comp Neurol. 1984;225:259–275. doi: 10.1002/cne.902250210. [DOI] [PubMed] [Google Scholar]
- Spear PD, Tong L, McCall MA. Functional influence of areas 17, 18, and 19 on lateral suprasylvian cortex in kittens and adult cats: implications for compensation following early visual cortex damage. Brain Res. 1988;447:79–91. doi: 10.1016/0006-8993(88)90967-5. [DOI] [PubMed] [Google Scholar]
- Stanford TR, Quessy S, Stein BE. Evaluating the operations underlying multisensory integration in cat superior colliculus. J Neurosci. 2005;25:6499–6508. doi: 10.1523/JNEUROSCI.5095-04.2005. [DOI] [PMC free article] [PubMed] [Google Scholar]
- Stein BE. Development of the superior colliculus. Ann Rev Neurosci. 1984;7:95–125. doi: 10.1146/annurev.ne.07.030184.000523. [DOI] [PubMed] [Google Scholar]
- Stein BE. Neural mechanisms for synthesizing sensory information and producing adaptive behaviors. Exp Brain Res. 1998;123:124–135. doi: 10.1007/s002210050553. [DOI] [PubMed] [Google Scholar]
- Stein BE, Dixon JP. Properties of superior colliculus neurons in the golden hamster. J Comp Neurol. 1979;183:269–284. doi: 10.1002/cne.901830205. [DOI] [PubMed] [Google Scholar]
- Stein BE, Gallagher H. Maturation of cortical control over superior colliculus cells in cat. Brain Res. 1981;223:429–435. doi: 10.1016/0006-8993(81)91160-4. [DOI] [PubMed] [Google Scholar]
- Stein BE and Gordon B. Maturation of the superior colliculus. In: Development of Perception: Psychobiological Perspectives, Vo: 12 edited by Aslin RN, Alberts JR, Petersen MR. New York: Academic Press, 1981, p.157–196.
- Stein BE, Magalhães-Castro B. Effects of neonatal cortical lesions upon the cat superior colliculus. Brain Res. 1975;83:480–485. doi: 10.1016/0006-8993(75)90839-2. [DOI] [PubMed] [Google Scholar]
- Stein BE and Meredith MA. The Merging of the Senses. Cambridge, MA: MIT Press, 1993.
- Stein BE, Labos E, Kruger L. Sequence of changes in properties of neurons of superior colliculus of the kitten during maturation. J Neurophysiol. 1973;36:667–679. doi: 10.1152/jn.1973.36.4.667. [DOI] [PubMed] [Google Scholar]
- Stein BE, Magalhães-Castro B, Kruger L. Relationship between visual and tactile representation in cat superior colliculus. J Neurophysiol. 1976;39:401–419. doi: 10.1152/jn.1976.39.2.401. [DOI] [PubMed] [Google Scholar]
- Stein BE, Spencer RF, Edwards SB. Corticotectal and corticothalamic efferent projections of SIV somatosensory cortex in cat. J Neurophysiol. 1983;50:896–909. doi: 10.1152/jn.1983.50.4.896. [DOI] [PubMed] [Google Scholar]
- Stein BE, Huneycutt WS, Meredith MA. Neurons and behavior: the same rules of multisensory integration apply. Brain Res. 1988;448:355–358. doi: 10.1016/0006-8993(88)91276-0. [DOI] [PubMed] [Google Scholar]
- Stein BE, Meredith MA, Huneycutt WS, McDade L. Behavioral indices of multisensory integration: orientation to visual cues is affected by auditory stimuli. J Cogn Neurosci. 1989;1:12–24. doi: 10.1162/jocn.1989.1.1.12. [DOI] [PubMed] [Google Scholar]
- Stein BE, Jiang W and Stanford TR. Multisensory integration in single neurons of the midbrain. In: The Handbook of Multisensory Processes, edited Calvert G, Spence C, and Stein BE. Cambridge, MA: MIT Press, 2004, p. 243–264.
- Sun JS, Lomber SG, Payne BR. Expansion of suprasylvian cortex projection in the superficial layers of the superior colliculus following damage of areas 17 and 18 in developing cats. Vis Neurosci. 1994;11:13–22. doi: 10.1017/s0952523800011068. [DOI] [PubMed] [Google Scholar]
- Thompson RF, Johnson RH, Hoopes JJ. Organization of auditory, somatic sensory and visual projections to association cortex in the cat. J Neurophysiol. 1963;26:243–264. doi: 10.1152/jn.1963.26.3.343. [DOI] [PubMed] [Google Scholar]
- Toldi J, Feher O. Acoustic sensitivity and bimodal properties of cells in the anterior suprasylvian gyrus of the cat. Exp Brain Res. 1984;55:180–183. doi: 10.1007/BF00240514. [DOI] [PubMed] [Google Scholar]
- Wallace MT, Stein BE. Cross-modal synthesis depends on input from cortex. J Neurophysiol. 1994;71:429–432. doi: 10.1152/jn.1994.71.1.429. [DOI] [PubMed] [Google Scholar]
- Wallace MT, Stein BE. Development of multisensory integration in cat superior colliculus. J Neurosci. 1997;17:2429–2444. doi: 10.1523/JNEUROSCI.17-07-02429.1997. [DOI] [PMC free article] [PubMed] [Google Scholar]
- Wallace MT, Stein BE. Onset of cross-modal synthesis in the neonatal superior colliculus is gated by the development of cortical influences. J Neurophysiol. 2000;83:3578–3582. doi: 10.1152/jn.2000.83.6.3578. [DOI] [PubMed] [Google Scholar]
- Wallace MT, Meredith MA, Stein BE. Converging influences from visual, auditory, and somatosensory cortices onto output neurons of the superior colliculus. J Neurophysiol. 1993;69:1797–1809. doi: 10.1152/jn.1993.69.6.1797. [DOI] [PubMed] [Google Scholar]
- Wallace MT, Wilkinson LK, Stein BE. Representation and integration of multiple sensory inputs in primate superior colliculus. J Neurophysiol. 1996;76:1246–1266. doi: 10.1152/jn.1996.76.2.1246. [DOI] [PubMed] [Google Scholar]
- Wallace MT, McHaffie JG, Stein BE. Visual properties and visuotopic representation in the newborn monkey superior colliculus. J Neurophysiol. 1997;78:2732–2741. doi: 10.1152/jn.1997.78.5.2732. [DOI] [PubMed] [Google Scholar]
- Wallace MT, Meredith MA, Stein BE. Multisensory integration in the superior colliculus of the alert cat. J Neurophysiol. 1998;80:1006–1010. doi: 10.1152/jn.1998.80.2.1006. [DOI] [PubMed] [Google Scholar]
- Wallace MT, Hairston WD, Perrault TJ Jr and Stein BE. Spatial disparity rearing alters the multisensory organization of the superior colliculus. 2002 Abstract Viewer/Itinerary Planner Society for Neuroscience: Program No. 220.5, 2002.
- Wallace MT, Perrault TJ, Jr, Hairston DW, Stein BE. Visual experience is necessary for the development of multisensory integration. J Neurosci. 2004;24:9580–9584. doi: 10.1523/JNEUROSCI.2535-04.2004. [DOI] [PMC free article] [PubMed] [Google Scholar]
- Wickelgren BG, Sterling P. Effect on the superior colliculus of cortical removal in visually deprived cats. Nature. 1969;224:1032–1033. doi: 10.1038/2241032a0. [DOI] [PubMed] [Google Scholar]
- Wilkinson LK, Meredith MA, Stein BE. The role of anterior ectosylvian cortex in cross-modality orientation and approach behavior. Exp Brain Res. 1996;112:1–10. doi: 10.1007/BF00227172. [DOI] [PubMed] [Google Scholar]
- Zangenehpour S, Chaudhuri A. Neural activity profiles of the neocortex and superior colliculus after bimodal sensory stimulation. Cereb Cortex. 2001;11:924–935. doi: 10.1093/cercor/11.10.924. [DOI] [PubMed] [Google Scholar]