

Abstract
Postcolumn derivatization reactions can be used to improve detector sensitivity or selectivity. The advantages of capillary chromatography for trace analysis could be augmented if there were postcolumn reactors suitable for microchromatographic systems. However, postcolumn derivatization is a challenge because of the small peak volumes associated with capillary columns. We have developed a postcolumn flow reactor from microchannels formed in fluorinated ethylene propylene and 50-μm fused-silica tubing for use with capillary HPLC analyses. Theoretical and experimental evidence show that the reactor, which operates in the Taylor dispersion regime, enables contact of analyte and derivatization streams purely by diffusion. Reactor lengths as short as 2 cm allow formation of copper(II)–peptide complexes that are detected electrochemically at a carbon fiber microelectrode. The reactor has been used with 100-μm-i.d. columns with insignificant effects (i.e., <3%) on peak band spreading. Theoretical calculations indicate that even smaller i.d. columns can be used with little effect on chromatographic resolution.
Chemical reactions can be coupled with chromatography to improve detection sensitivity or selectivity. For example, a lower detection limit can be realized from the conversion of sample components to products for which the detector has a higher sensitivity. Detector selectivity can be improved to avoid interferences from substances that cannot be sufficiently resolved by the chromatographic separation.1 Chemical reactions can be carried out precolumn, postcolumn, on-line, or off-line. Precolumn formation, though easier, may change the chromatographic properties of the compounds. In addition, generation of derivatization artifacts is more likely precolumn since the reaction is carried out in the sample matrix. As a result, postcolumn derivatization is often preferred. Postcolumn chemical reactions can be performed offline, by collecting the column eluent in fractions, adding the derivatization agent, and then measuring the reaction products, or on-line, which requires a flow reactor.1
When a flow reactor is used to produce reaction products, the following criteria should be met: (1) The reagents and solvents should not interfere with the detection. (2) The reaction kinetics must be fairly fast to avoid large-volume reactors which cause significant peak broadening. (3) The reaction yield should be high so low detection limits can be achieved. (4) The reaction products should be stable on the time scale of the experiment.1
Open-tubular, packed-bed, and segmented-flow reactors have all been used for postcolumn derivatization.2 A number of papers have addressed the design and performance of these types of chemical reactors for chromatography.1,3,4 The most common is the open tube reactor, which consists of a narrow tube through which the effluent–reagent mixture flows. The biggest concern when implementing a postcolumn reactor of any kind is the additional peak broadening that occurs within the reactor itself. In a properly designed postcolumn reactor, the additional peak broadening should be minimal to reduce the inevitable loss in resolution. This becomes particularly challenging when designing a postcolumn reactor for use with microcolumn HPLC columns because of the small peak volumes associated with these analyses.
Before a reaction between the column eluent and derivatization reagent can occur, the two fluid streams must mix. Fortunately, research surrounding the mixing of fluids in microchannels has expanded in recent years because of efforts focused on microfluidic systems.5,6 As a result, a major emphasis has been placed on developing mixing designs that are compatible with the lithography-based techniques of microfabrication. In these microfluidic channels, the flows are characterized by low values of Reynolds number (Re). Since viscous coupling to the walls dominates flow at low Re, microfluidic devices that require a mixing operation typically rely on diffusive mixing once the fluid streams are brought together within a single channel.7,8 Much of the driving force for microflow devices is to accomplish rapid separations on very small volumes. The drive to faster separations on smaller volumes is inconsistent with the need to allow molecular diffusion to mix reagents with analytes in large channels (cross-sectional dimension ~100 μm) following a separation.9 Thus, clever microfabricated channel designs have been used to improve diffusive mixing.9,10
Postcolumn flow reactors for use with capillary chromatographic systems differ from microfabricated mixers typically used for rapid capillary electrophoresis in that the required mixing length can be longer because the peaks are wider. However, the volume of the reactor must still be small compared to the peak volume to minimize contributions to band spreading. To our knowledge, there are no published accounts of flow reactors for postcolumn derivatization when capillary columns are used for chromatographic separation.
We have developed a flow reactor, manufactured from fluorinated ethylene propylene (FEP) and fused-silica tubing, that achieves postcolumn reagent mixing and chemical derivatization following capillary HPLC separation. The fabricated device has been tested using a postcolumn derivatization technique based on the biuret chemistry developed in our laboratory.11,12 Specifically, peptides bind to copper(II) through the amide backbone enabling reversible electrochemical detection at modest potentials. Although precolumn formation of the copper(II)–peptide complex is possible,13,14 it does alter the retention times of the peptides. For this reason, postcolumn derivatization is most often performed. Using peak standard deviations, we show that the reactor does not substantially broaden peptide peaks, yet it enables mixing of peptide and reagent streams purely by diffusion.
EXPERIMENTAL SECTION
Reagents
Reagents and sources were as follows: trifluoro-acetic acid (TFA), 1-propanol, sodium perchlorate, and hexamineruthenium(III) chloride (Ru(NH3)6Cl3; Sigma, St. Louis, MO); disodium tartrate dihydrate, sodium borate, potassium nitrate, and sodium hydroxide, Baker (Phillipsburgh, NJ); copper sulfate pentahydrate, Fisher (Pittsburgh, PA); acetonitrile, sodium carbonate, and sodium bicarbonate, EM Science (Gibbstown, NJ); leucine enkephalin (YGGFL), methionine enkephalin (YGGFM), des-Tyr Leu-enkephalin (GGFL), American Peptide Co. (Sunnyvale, CA). The copper sulfate pentahydrate and disodium tartrate dihydrate were recrystallized once from water. The sodium perchlorate was recrystallized once from methanol; all other reagents were used without further purification. All solutions were made with Milli-Q (Millipore, Billerica, MA) house-deionized water.
Apparatus
Capillary HPLC
The filtered (Osmonics, Minnetonka, MN) aqueous mobile phase containing 0.1% TFA, 3% 1-propanol, and 23% acetonitrile was sparged with helium and pumped at 100 μL/min with a Waters 600 E quaternary pump. To achieve the low flow rates used in capillary HPLC, the aqueous mobile-phase flow was split using a simple tee. The waste line dimensions were 62 cm × 50 μm when a 100-μm-i.d. chromatographic column was employed. A 200 cm × 25 μm i.d. fused-silica capillary tube (Polymicro Technologies, Phoenix, AZ) was placed after the split but before the injection valve to increase the back pressure and improve pump performance. The commercial mixing device was a Microtee (Upchurch Scientific, Oak Harbor, WA). At the time, this was the best device commercially available to achieve a low-volume connection of two fluid streams (29-nL swept volume).
Ru(NH3)6Cl3 flow injection
For flow injection experiments, the aqueous flow contained 0.1% TFA, 3% 1-propanol, and 0.1 M NaClO4. In total, three waste line dimensions were used: 77.8 cm × 127 μm, 44 cm × 127 μm plus 45 cm × 178 μm, and 44 cm × 127 μm, which generated flows from 2 to 5 μL/min. The various flow reactors with reactor lengths ranging from 7 to 14 cm were connected directly to a 32 cm × 50 μm tube that originated in the injector.
Des-Tyr enkephalin flow injection
For flow injection experiments comparing the flow reactor with the MicroTee, the flow solution was 50:50 acetonitrile/water with 0.1% TFA and 3% 1-propanol. For flow injection experiments to determine the optimal reactor length, the flow solution was 23% acetonitrile, 0.1% TFA, and 3% 1-propanol in water. In total, three waste line dimensions were used: 77.8 cm × 127 μm, 44 cm × 127 μm plus 45 cm × 178 μm, and 44 cm × 127 μm, which generated flows from 2 to 5 μL/min. The flow reactor was connected directly to a 32 cm × 50 μm tube that originated in the injector.
In all cases, a VICI injector (Valco Instrument Co., Houston, TX) was used for sample injection. For the flow injection and chromatography experiments, the injection volumes were 1 and 5 μL, respectively. The copper(II)–peptide complexes were detected at +0.55 V versus Ag/AgCl with a 10-μm carbon fiber electrode 1 mm in length. Ru(NH3)6Cl3 was detected at −0.25 V versus Ag/AgCl with a 10-μm carbon fiber electrode 400 μm in length. Potential was controlled with a BAS (W. Lafayette, IN) Epsilon potentiostat. An Isco model DM syringe pump (Lincoln, NE) was used to pump the postcolumn derivatization reagent at flow rates of ~0.5 (capillary HPLC) and 1.0 μL/min (flow injection) into the fabricated mixer. The postcolumn reagent consisted of 1.2 M carbonate buffer, 30 mM disodium tartrate, and 5.0 mM copper sulfate (pH 9.8).
Column Construction
Capillary columns were prepared by previously described techniques15 using 20-cm lengths of 100-μm-i.d., 360-μm-o.d. fused-silica capillaries as the column blanks. The 100-μm-i.d. columns were slurry packed with 2.6-μm XTerra MS-C18 (Waters, Milford, MA) reversed-phase particles (slurries consisted of 20–30 mg/mL packing material in 2-propanol) at 3000–4000 psi using a constaMetric III metering pump (LDC Analytical, Riveria Beach, FL).
Reactor Construction
Reactors were constructed according to previously published procedures.16 Briefly, two 25- or 18-μm tungsten wires were individually threaded through two 50-μm fused-silica tubes. These two wires were then threaded into a third silica tube with an inner diameter large enough to house both wires. The junction between the three capillary tubes was inserted into a piece of dual shrink/melt tubing (Small Parts, Miami Lakes, FL). A schematic diagram of the device is shown in Figure 1. After sufficient heat is applied with a heat gun (Wagner Spray Tech Corp., Minneapolis, MN) and the device is allowed to cool, the tungsten wires are removed creating fluid conduits within the polymer tube.
Figure 1.
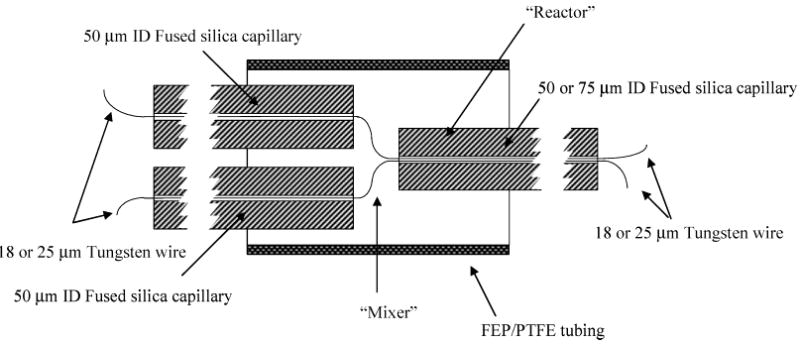
Schematic of the fabricated flow reactor showing placement of the tungsten wires and FEP/PTFE polymer tubing.
The flow reactor is composed primarily of 50-μm-i.d. fused-silica tubing with smaller channels within the fluoropolymer to enable contact between the HPLC eluent and the derivatization streams. When the 25-μm-diameter tungsten wire is used, the third fused-silica tube is 75-μm i.d.. To minimize band spreading, we used the 75-μm-i.d. tube to deliver the derivatization reagent (Figure 2A). Incorporating the smaller diameter tungsten wires (18 μm) enables connection of three 50-μm-i.d. tubes, which allows a Y configuration to be employed when the device is used on-line (Figure 2B). It will clarify discussion if we define the region in the FEP as the “mixer” and the fused-silica conduit leading from the mixer to the detector as the “reactor” (Figure 1). The 50-μm-i.d. capillary leading from the column to the mixer typically ranged from 3 to 4 cm in length. The mixing channels, though different for each device, were less than 1 cm long.
Figure 2.
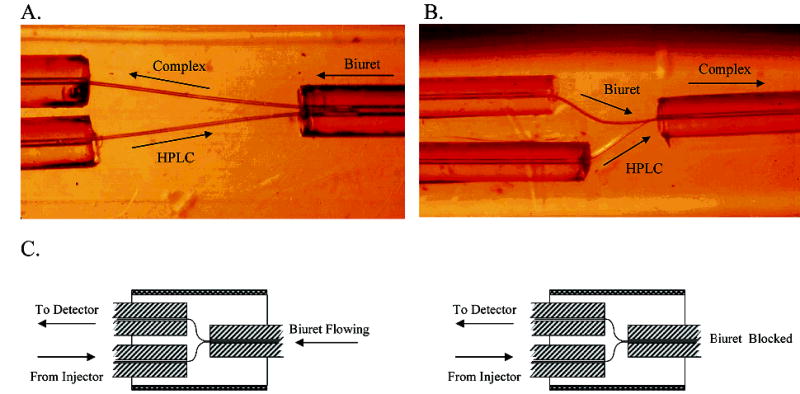
Microscopic photograph of the flow reactor with (A) 25- and (B) 18-μm channels. The arrows indicate the flow direction. (C) Schematic representation of the flow reactor configurations for the Ru(NH3)6Cl3 flow injection experiments.
Data Treatment
Data were imported into PeakFit version 4 (AISN Software, Inc.) for differentiation and determination of the first and second central statistical moments. The statistical moments were determined by fitting the five-parameter GEMG function17 (similar to an exponentially modified Gaussian) to the data based on the least-squares criterion. The GEMG function provided the best fit of all the available chromatography functions as determined by visual inspection and the residual sum of squares to the experimental data.
All the errors reported are standard errors of the mean (SEM). For each error, the SEM and number of degrees of freedom are given in parentheses.
RESULTS AND DISCUSSION
Theoretical Considerations
Since diffusion is the means by which the column eluent and the derivatization reagent mix, sufficient time must be given for diffusion to relax radial concentration gradients. When solution dispersion is in the Taylor regime, radial concentration gradients resulting from the fluid velocity variation across the tube will be relaxed. Consequently, operating in this regime is a necessary condition to accomplish postcolumn derivatization.
In the Taylor regime, the dispersion coefficient, D, is defined by eq 1 where v is the average solute velocity, a is the tube radius,
| (1) |
and D is the solute diffusion coefficient.
Equation 2 arises from the equation for plate height (Hl = 2D/v). In this expression, Hl is the plate height in length units.
| (2) |
An alternate way of interpreting Hl is in terms of time instead of length as shown in eq 3. Here t can be thought of as a residence
| (3) |
time for the solute in the system, L is the tube length, and σl2 and σt2 are the variance of the zone in units of length and time squared, respectively. The plate time, Ht, is the ratio of the peak variance to the peak elution time (second central moment/first moment) as shown in eq 4. Using parameters with units of time
| (4) |
is a convenient approach for flow injection analysis combined with flow splitting because individual velocities and tubing lengths are not required for the calculation.
Experimental conditions define whether dispersion is in the Taylor regime based on the Peclet number (Pe), a dimensionless variable relating axial convection and radial diffusion (Pe = va/D), with the dimensions of the mixing device (Figure 3). The Taylor regime is defined by log Pe > 1.8 and L/a > 2.5Pe. Pe is proportional to the ratio of the time a solute takes to travel a distance a when the driving force is diffusion (tD) to the time to travel the same distance at a velocity, v. For a cylinder, the proportionality factor is 4. The first criterion, log Pe > 1.8, ensures that axial molecular diffusion does not contribute to band spreading. The second criterion, L/a > 2.5 Pe, can be rearranged to L/v > 2.5a2/D, and since tD is a2/4D, this criterion can also be stated as L/v > 10tD. So, the second criterion ensures that the cylindrical tube is long enough so that diffusion has the time to relax radial concentration gradients. For our experiments, typical values for log Pe = 2.9 and L/a = 4.0Pe.
Figure 3.
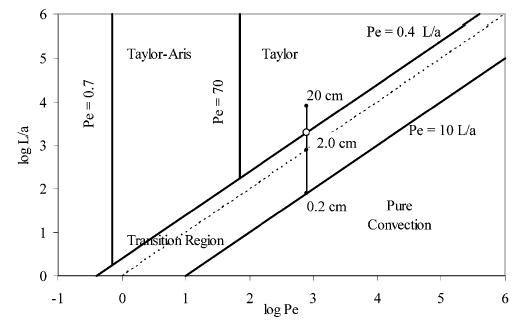
Diagrammatic representation of the different solution dispersion regimes. The line indicates the position for Cu(II) –GGFL traveling in a 50-μm-i.d. tube at a flowrate of 1.8 μL/min at tubing lengths of 0.2, 2, and 20 cm, respectively. Adapted with permission from Figure 4.6.522 (copyright 1994 of John Wiley & Sons, Inc.).
If dispersion is in the Taylor regime, a plot of second central moment versus first moment yields a straight line with a slope equal to a2/24D. As the slope is analogous to the so-called C term in chromatography, we will refer to the slope as C. Deviations from Taylor behavior signal unwanted mixing due to diameter changes and tubing connections.
Experimental Determination of Reactor and Mixer Contributions to Band Broadening
Although the reactor is 50-μm fused-silica tubing, the mixer has a number of diameter changes as the fluid moves from one silica tube through the polymer channels and back into the reactor (Figure 2B). In addition, the device incorporating the 75-μm reactor has a complicated flow profile (Figure 2A). To evaluate the contribution to dispersion from the mixer (Figure 1), we determined second central and first moments with flow injection and compared C to the theoretical value for solute passing only through the fused-silica tubing. C depends only on the radius of the tube and the diffusion coefficient of the solute; thus, individual determinations of tube length and flow velocity are not necessary. This is useful because the flow velocity changes in the mixer due to the contribution from the second fluid stream, which makes the determination of total flow velocity nontrivial. This approach using second central and first moments is simple and allows multiple lengths and fluid velocities to be plotted on the same graph. Figure 4 shows the results of flow injection experiments performed for 10 μM Ru(NH6)Cl3 dissolved in the flow solution. For these experiments, the solute was Ru(NH6)Cl3 because the diffusion coefficient is known, there are no reaction complications, and the solute is electrochemically reversible at a carbon fiber electrode. Seven different flow reactors each with 25-μm-i.d. mixer channels and reactor lengths ranging from 7 to 14 cm were used. Two different configurations were tested: with the reactor connected but with the secondary flow blocked and with the reactor connected and the secondary reagent flowing (Figure 2C). Here, the secondary reagent was the background electrolyte solution and not the biuret reagent. C values for the blocked and flowing configurations were 0.0696 (SEM = 0.0027 s, n = 68) and 0.0714 s (0.0028 s, 61), respectively. There is no statistically significant difference (Fcrit = 3.42, Fobs = 2.70) among these two values and C obtained for a simple open tube with no mixer (0.0675 s (0.0012 s, 97) data in ref 18). This indicates that in the flow reactor the only measurable contribution to band spreading is Taylor dispersion in a 50-μm open capillary. Therefore, the band-broadening contribution from the mixer is immeasurably small.
Figure 4.
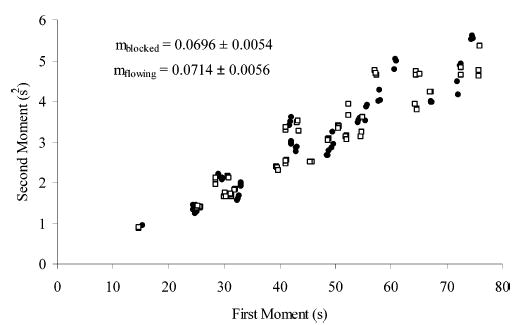
Second central versus first moment for 10 μM Ru(NH3)6Cl3. Flow injection data were imported into PeakFit for determination of the peak statistical moments. Detection was achieved at a 10-μm carbon fiber electrode at −0.25 V versus Ag/AgCl. Flow reactor dimensions varied with reactor lengths ranging from 7 to 14 cm. Blocked □; flowing •.
Comparison of the Fabricated Device with a Commercial Mixing Tee
We used the flow injection method described above to compare the performance of the fabricated mixing device with a commercially available small-bore tee connector. For these experiments, we used the nonelectroactive peptide des-Tyr enkephalin (GGFL), which will be detected only if the solute and biuret reagent streams mix.
C values of 0.0531 (0.0014 s, 7) and 0.112 s (0.0088 s, 7) were obtained for the homemade reactor and commercial mixer, respectively (data not shown). Using the value of C for the homemade mixer and eq 4, a diffusion coefficient of 4.7 × 10⁻⁶ cm2/s was calculated for the Cu(II)– GGFL complex in 25% acetonitrile. Since the Cu(II)–GGFL complex does not yield ideal, diffusion-controlled behavior in rotating disk experiments, this calculated diffusion coefficient could not be directly compared to an experimental value. For comparison, we generated a log D versus log molecular weight plot for the GGFL– and tri-, tetra-, and pentaglycine–Cu(II) complexes to compare the slope with the expected value of −0.33 (D ∝ MW−1/3) obtained from the Stokes–Einstein equation.19 The diffusion coefficients in aqueous solution of the latter three complexes were determined previously using a rotating ring disk electrode.20 The Scheibel correlation21 (eq 5) was used to estimate the diffusion coefficient of the Cu-
| (5) |
(II)–GGFL complex in aqueous solution. Here As is a constant equal to 8.2 × 10⁻⁸, T is the temperature in kelvin, VA is the molar volume (mL/mol) of the solute at its normal boiling point, VB is the molar volume of the solvent, and ηB is the solution viscosity in centipoise. It should be pointed out that the Scheibel correlation has been found to be more accurate than the Wilke–Chang correlation for acetonitrile-rich mixtures (<20% error).21 Equation 5 leads to a value of VA equal to 297 mL/mol for the Cu(II)–GGFL in 25% acetonitrile. This value of VA and eq 5 were then used to calculate 4.9 × 10⁻⁶ cm2/s as the diffusion coefficient in aqueous solution. This datum and the previously determined data for the oligoglycine complexes were regressed against log MW. The correlation yields a slope of −0.335 (R2 = 0.96). The slope is in good agreement with the anticipated value. This is further evidence for the assertion that dispersion in the flow reactor is dominated by Taylor dispersion in an open tube as the mixing device yielded an apparently accurate value for a solute diffusion coefficient when equations derived for open tubes are used. Deviation from the expected C value in the commercial mixing tee results from the excess dispersion in the tee itself.
Determination of Optimal Reactor Length
When postcolumn derivatization is performed, particular attention must be paid to reactor length. The proper length will allow reaction completion without excess band spreading. We examined the effect of reactor length on sensitivity by comparing the signal obtained for the Cu-(II)–GGFL complex at various reactor lengths. As GGFL itself has no electroactivity, signal can only be present if the Cu(II) and GGFL react.
The experiment consisted of measuring the peak area in two different flow reactors each with 18-μm-i.d. mixer channels and a 50-μm-i.d. reactor of various lengths. Physical limitations dictated that the shortest reactor was 2 cm long. Individual points in Figure 5 represent the average of four consecutive flow injection experiments. The data show that the reaction is complete at a distance shorter than 2 cm.
Figure 5.
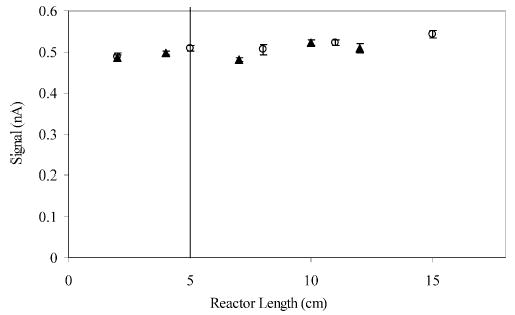
Effect of reactor length on the signal generated from the GGFL–Cu(II) complex for two different mixing devices each with a 50-μm-i.d. reactor. A 10 μM solution of GGFL in the flow solution was injected, and the Cu(II)–peptide complex was formed in the reactor portion of the flow reactor. Detection was achieved at a 10-μm carbon fiber electrode at +0.55 V versus Ag/AgCl. Error bars represent the SEM from four consecutive blank-subtracted flow injection experiments.
As reactor length increases, the system moves vertically up the dispersion graph (Figure 3) and into the Taylor regime, as indicated by the vertical line. The individual points represent reactor lengths of 0.2, 2, and 20 cm. At the flow rates employed for this experiment (1.8 μL/min), a reactor length of 5 cm is necessary to achieve Taylor behavior (Figure 3, open circle). In Figure 5, this reactor length is depicted as a vertical line. A significant increase in signal is not observed as the reactor length is varied from 2 to 15 cm. These results suggest that the mixer increases fluid mixing as the effective reactor length is shorter than predicted. The previous results indicate that the mixer does not add band broadening. This combination of properties is beneficial because smaller reactor lengths and therefore volumes can be used without a significant effect on sensitivity. As a result, a 4-cm reactor is sufficient for most applications.
Evaluation of Reactor Contributions to Band Broadening
The ultimate test for a postcolumn reactor is the determination of its contribution to band broadening. We have developed a method for determining extracolumn band broadening that eliminates concerns about contributions from the injection.18 This method, based on flow injection analysis, will be applied here, but first it is necessary to predict the extent of extracolumn band broadening resulting from passage through the fabricated mixing device. The following theoretical treatment will focus on the Cu-(II)–YGGFM complex.
The log D versus log molecular weight regression gave a value of 4.3 × 10⁻⁶ cm2/s for the diffusion coefficient of the Cu(II)–YGGFM complex. We used the aforementioned Scheibel correlation (VA = 378 mL/mol) to calculate 4.1 × 10⁻⁶ cm2/s for DYGGFM–Cu(II) in 15% acetonitrile. Approximating the mixing device as a 50-μm-i.d. tube (neglecting the 25-μm channels in the FEP polymer), Ht is 0.064 s (calculated from eq 4). The fluid flow in the reactor travels at two different velocities: in the first 50 μM silica tube leading from the column to the mixer (3.0 cm), the velocity is proportional to the HPLC mobile-phase flow rate (1.6 μL/min, 180-μm-i.d. column), in the second 50 μM silica tube (4.0 cm), from the mixer to the outlet, the flow rate (~2.4 μL/min) reflects the added contribution from the biuret reagent flow (0.8 μL/min). The residence time in the flow reactor, 4.1 s, is the sum of the time required to travel through each leg. Equation 6 shows
| (6) |
how to get the standard deviation added to a peak by passage through the mixer from σt2/t and the residence time, t. The result is 0.51 s. Since it is variances that add for independent dispersion processes, the total system variance, σtot2, is the sum of the contributions from the column (σcol2) and postcolumn flow reactor (σpostcolumn2)
| (7) |
If we assume a typical peak width of 30 s (4σ), then the peak standard deviation in time is 7.5 s. The standard deviation of a peak that has traveled through the column and reactor would have a time standard deviation of 7.52 s, a difference of only 0.27%. For column diameters of 100, 75, 50, and 25 μm (assuming the same linear velocity in all cases), we estimate that the band-broadening contribution from passage through the flow reactor would be 0.76, 1.3, 3.0, and 12%, respectively. As a result, this flow reactor could be used with columns as small as 50-μm i.d. with an insignificant effect on chromatographic resolution and probably could be used with 25-μm-i.d. columns.
The excess band broadening from the mixer/reactor can be found from comparing chromatograph peaks with and without the reactor. The tyrosine-containing peptides, YGGFM and YGGFL, are ideal for these experiments. These peptides form a typical Cu(II)–peptide complex rapidly. Further, they are detectable with and without the biuret reagent so a peak is obtained regardless of whether the flow reactor is present. A 100-μm-i.d. column packed with 2.6-μm XTerra C18 particles generated 14 000 theoretical plates for YGGFL, so this is a reasonably efficient separation and therefore sensitive to postcolumn mixing. Table 1 shows parameters of the chromatogram without the flow reactor (top two rows). Data come from two separate devices (labeled trial 1 and trial 2 in Table 1), repeated several times (total 10). Table 1 also provides an expected σt from the reactor. The resulting figures for percent broadening come from eq 7 and the two values of σt (column and reactor).
Table 1.
Experimental Values To Determine Theoretical Band Broadening Contributions from the Flow Reactor
| trial 1
|
trial 2
|
|||
|---|---|---|---|---|
| YGGFM | YGGFL | YGGFM | YGGFL | |
| fwhm (s) | 8.1 (4)a | 11.1 (4) | 8.0 (6) | 10.8 (6) |
| σt column (s) | 3.4 (4) | 4.7 (4) | 3.4 (4) | 4.6 (4) |
| D (cm2/s) | 4.1 × 10⁻⁶ | 4.1 × 10⁻⁶ | ||
| σt2/t | 0.064 | 0.064 | ||
| residence time (s) | 12.0 | 11.2 | ||
| σt reactor (s) | 0.88 | 0.85 | ||
| % broadening from reactor | 3.2 | 1.7 | 3.0 | 1.7 |
Number of chromatogram.
Figure 6 depicts the chromatograms obtained in each instance: with and without the mixing device. The difference in retention time with the mixer compared to without is expected considering the experimental flow rate and volume of the mixing device (~9 s). The fwhm was evaluated using both ChromGraph, which is the data acquisition software, and PeakFit, a peak fitting program. Two different methods were employed for peak analysis because second moment measurements are prone to error. The coefficients of variation of the measured peak width for YGGFM and YGGFL were 1.6 and 0.39%, respectively (n = 20). Thus, the measurements are precise, allowing us to discern small changes. For the YGGFM peak in trial 1, a statistical difference (2.4%) at 95% confidence was found between the peak eluting directly from the column and one passing through the mixing device. For the remainder of the peaks, no statistical difference was found at 95% confidence (The percent change, with mixer compared to without mixer, were as follows: 1.50, 0.19, 0.088, 0.00, 0.00, −0.31, and −1.8,). Thus, the flow reactor does not broaden substantially the analyte band (<2 or 3%), consistent with what theory predicts.
Figure 6.
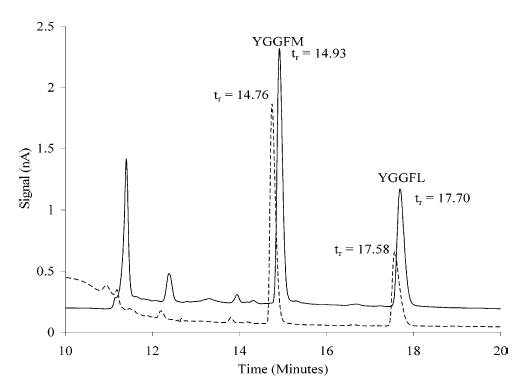
Chromatograms obtained with (solid line) and without (dashed line) the mixer attached to a 100-μm-i.d. capillary column. When the flow reactor was removed, 5 μL of a 1 μM peptide solution was injected. Detection was achieved with a 10-μm carbon fiber electrode at +1.0 V versus Ag/AgCl. When the flow reactor was attached, 5 μL of a 500 nM peptide solution was injected. Detection was achieved with a 10-μm carbon fiber electrode at +0.55 V versus Ag/AgCl.
It is appropriate to mention the accuracy of these peak width measurements. We can compare a solute diffusion coefficient obtained using this procedure with that obtained using chronoamperometry, an established method for diffusion coefficient determination. For the model solute Ru(NH6)Cl3, the diffusion coefficient was found to be 3.89 × 10⁻⁶ and 3.92 × 10⁻⁶ cm2 s−1 by chronoamperometry and this flow injection method, respectively.
It is worthwhile to ask why the device seems not to add significantly to peak width. Given the measurement accuracy and precision, we certainly should have been able to see an increase of 3% (see Table 1), but we do not. We do not know why, but we suspect that the answer lies in the flow paths. The fluid streams from the postcolumn reagent and from the HPLC effluent are in 18-μm cylindrical channels that travel in parallel for some short distance. It is conceivable that, for a short distance, the reagents are constrained to be much closer together than if they occupied a 50-μm-i.d. capillary. Consequently, the reaction would be completed in a shorter length than predicted, as seen in Figure 5. Also, where the FEP channels end at the entrance into the 50-μm-i.d. reactor, there may be some fluid mixing on the distance scale of the inside diameter, which is much shorter than the height equivalent to a theoretical plate resulting from the Taylor dispersion. This would reduce the extracolumn band broadening caused by the device.
CONCLUSION
We have fabricated a postcolumn reaction device for use with capillary chromatography. The device is composed of fused-silica capillary with fluoropolymer channels connecting the two fluid streams into a single capillary. At the flow rates typically employed for capillary HPLC analysis, diffusion is sufficient to mix the column eluent and derivatization streams. If dispersion is in the Taylor regime, radial diffusion dominates and the flow reactor contributes little to band spreading. Once fabricated, the device is robust and can be used for months without a loss in performance. In addition, the design is solvent and pH resistant. Finally, theoretical predictions indicate the flow reactor is able to be used with capillary columns at least as small as 50-μm i.d. without a significant effect on band broadening (<10%).
Acknowledgments
We are grateful to the NIH through grants GM44842 and DA14926 for financial support. We thank Dr. Ed Bouvier at Waters, Inc. for the gift of 2.6-μm XTerra packing material
References
- 1.Huber JFK, Jonker KM, Poppe H. Anal Chem. 1980;52:2–9. [Google Scholar]
- 2.Stewart JT, Bachman WJ. TrAC, Trends Anal Chem. 1988;7:106–111. [Google Scholar]
- 3.Shih YT, Carr PW. Anal Chim Acta. 1985;167:137–144. [Google Scholar]
- 4.Deelder RS, Kuijpers ATJM, Van den Berg JHM. J Chromatogr. 1983;255:545–561. [Google Scholar]
- 5.Reyes DR, Iossifidis D, Auroux PA, Manz A. Anal Chem. 2002;74:2623–2636. doi: 10.1021/ac0202435. [DOI] [PubMed] [Google Scholar]
- 6.Auroux PA, Iossifidis D, Reyes DR, Manz A. Anal Chem. 2002;74:2637–2652. doi: 10.1021/ac020239t. [DOI] [PubMed] [Google Scholar]
- 7.Chiem NH, Harrison DJ. Clin Chem. 1998;44:591–598. [PubMed] [Google Scholar]
- 8.Hadd AG, Raymond DE, Halliwell JW, Jacobson SC, Ramsey JM. Anal Chem. 1997;69:3407–3412. doi: 10.1021/ac970192p. [DOI] [PubMed] [Google Scholar]
- 9.Stroock AD, Dertinger SKW, Ajdari A, Mezit I, Stone HA, Whitesides GM. Science. 2002;295:647–651. doi: 10.1126/science.1066238. [DOI] [PubMed] [Google Scholar]
- 10.He B, Burke BJ, Zhang X, Zhang R, Regnier FE. Anal Chem. 2001;73:1942–1947. doi: 10.1021/ac000850x. [DOI] [PubMed] [Google Scholar]
- 11.Warner AM, Weber SG. Anal Chem. 1989;61:2664–2668. doi: 10.1021/ac00198a015. [DOI] [PubMed] [Google Scholar]
- 12.Chen JG, Weber SG. Anal Chem. 1995;67:3596–3604. doi: 10.1021/ac00115a033. [DOI] [PubMed] [Google Scholar]
- 13.Tsai HY, Weber SG. J Chromatogr. 1991;542:345–350. doi: 10.1016/s0021-9673(01)88773-2. [DOI] [PubMed] [Google Scholar]
- 14.Shen H, Witowski SR, Boyd BW, Kennedy RT. Anal Chem. 1999;71:987–994. doi: 10.1021/ac9809837. [DOI] [PubMed] [Google Scholar]
- 15.Kennedy RT, Jorgenson JW. Anal Chem. 1989;61:1128–1135. doi: 10.1021/ac00180a012. [DOI] [PubMed] [Google Scholar]
- 16.Sahlin E, Beisler AT, Woltman SJ, Weber SG. Anal Chem. 2002;74:4566–4569. doi: 10.1021/ac025622c. [DOI] [PMC free article] [PubMed] [Google Scholar]
- 17.Rundel, R. In PeakFit Technical Guide, 3 ed.; Jandel Scientific, 1991; Vol. 3, pp 34–36.
- 18.Beisler AT, Schaefer KE, Weber SG. J Chromatogr, A. 2003;986:247–251. doi: 10.1016/s0021-9673(02)02018-6. [DOI] [PubMed] [Google Scholar]
- 19.Giddings, J. C. In Unified Separation Science; John Wiley & Sons: New York, 1991; pp 77–80.
- 20.Woltman SJ, Alward MR, Weber SG. Anal Chem. 1995;67:541–551. doi: 10.1021/ac00099a010. [DOI] [PubMed] [Google Scholar]
- 21.Li J, Carr PW. Anal Chem. 1997;69:2530–2536. doi: 10.1021/ac961005a. [DOI] [PubMed] [Google Scholar]
- 22.Probstein, R. F. In Physicochemical Hydrodynamics; John Wiley & Sons: New York, 1994; pp 82–96.