

Abstract
Loss of cortical gray matter is accompanied by a commensurate increase in the sulcal and intraventricular cerebrospinal fluid volume. On diffusion-weighted magnetic resonance imaging, this would be reflected as a higher apparent diffusion coefficient in affected brain regions. On the basis of the above premise, we suggest that the apparent diffusion coefficient may be used as a surrogate marker for the assessment of regional brain volume deficits. We demonstrate this approach by voxelwise analysis of registered apparent diffusion coefficient images from a group of 15 patients with schizophrenia and 15 age-matched healthy controls. We found widespread regional apparent diffusion coefficient increases in patients. Affected areas included the bilateral insular cortex, hippocampus, temporal lobe, and occipital areas. These results largely concur with previous findings of cortical volume deficits in schizophrenia.
Keywords: Apparent diffusion coefficient, Brain, Diffusion-weighted magnetic resonance imaging, Magnetic resonance imaging, Morphometry, Schizophrenia
INTRODUCTION
The identification of structural brain abnormalities in neurodegenerative or developmental disorders, using magnetic resonance imaging (MRI), has become an important area of neuroimaging research in recent years [1,2]. Studies typically employ high-resolution T1-weighted MRI for volume measurements. The most direct methodology is manual or semiautomatic (e.g. segmentation-assisted) tracing of perceived structural boundaries on a slice-by-slice basis [3–5]. This approach is labor intensive and volume measurements are often limited to a small number of selected structures of interest, that are a priori hypothesized to be affected by the disease process. More recently, voxel-based morphometry (VBM) [6] has been used to compare local concentrations of gray matter between groups of study participants. In this method, high-resolution magnetic resonance images from all participants are spatially normalized into a common stereotactic space so that comparisons can be made across participants or groups. This is followed by an image segmentation step in which gray matter voxels are identified. Finally, the gray matter images are smoothed and voxelwise parametric statistical tests are performed in order to identify the regions in which gray matter density is significantly different between the groups. Similar analyses may be performed on images representing white matter or cerebrospinal fluid (CSF) concentrations. Understandably, VBM is highly sensitive to the quality of tissue classification [7], which depends on many factors such as radio frequency field inhomogeneities, magnetic resonance pulse sequence parameters, image noise, and tissue contrast. These factors can vary greatly between imaging sites and may cause inconsistencies in VBM results from different laboratories. In addition, VBM relies on spatial normalization methods that aim to remove the very structural differences that VBM aims to detect. The spatial normalization methods range from 9-parameter and 12-parameter linear transformations to nonlinear transformations with varying degrees of freedom. Thus, the results obtained from VBM analysis may strongly depend on the spatial normalization method applied. At present, the interaction between the complexity of spatial normalization transformation and the results of VBM analysis is not well understood [8].
This paper is primarily written to provide an alternative to VBM for the assessment of cortical atrophy. The novelty of the method proposed here is not in the image processing techniques that are applied (registration, distortion correction, voxelwise statistical analysis, etc). All the image analysis techniques that are utilized in this article have been previously developed and used in neuroimaging research. The innovation of this paper is the suggestion that the apparent diffusion coefficient (ADC) may be used as a surrogate marker for cortical volume deficit. ADC is a measure of the average intravoxel diffusion of water molecules in all directions and may be computed using diffusion-weighted imaging. ADC is largest in the CSF and smallest in coherent, healthy, white matter.
The assertion that ADC could be used as a surrogate marker for atrophy is based on the observation that cortical brain atrophy is accompanied by a commensurate increase in sulcal and ventricular CSF [5,9]. Thus, CSF may be considered an endogenous tracer for detecting cortical gray matter reductions using MRI. Narr et al. [9] suggest: ‘although significantly correlated, increases in sulcal and subarachnoid CSF appear a more robust neuroanatomical correlate of schizophrenia than reductions in cortical gray matter.’ Elevation of the local CSF volume results in a higher ADC. Therefore, increases in ADC level may suggest replacement of brain parenchyma by CSF, or volume loss. On the basis of the above premise, we propose a new method, ADC-based morphometry (ABM), for identification of regional structural abnormalities using voxelwise analysis of ADC maps computed from diffusion-weighted MRI.
The methodology of this paper can be applied to study any brain disorder in which regional brain volume deficits may exist. Here, we demonstrate this approach by applying it to the analysis of brain images from a group of patients with chronic schizophrenia and a group of age-matched healthy controls. We hypothesized that ABM would reveal a spatial pattern of higher ADC in brain regions in which cortical and subcortical volume reductions are believed to exist in patients with schizophrenia on the basis of the previously published literature [1].
MATERIALS AND METHODS
Study participants
Fifteen male patients with schizophrenia (mean age: 33.7 years, standard deviation: 8.4, range: 20–49 years), fulfilling DSM-IV criteria, were age-matched with 15 healthy controls (seven female and eight male, mean age: 28.3, standard deviation: 9.7, range: 19–51 years). One patient had a diagnosis of schizoaffective disorder. The mean age difference was not significant between the groups (p<0.12; t=1.966). All patients were interviewed using the Structured Clinical Interview for DSM-IV – Patient version (SCID-P) to confirm the schizophrenic diagnosis [10]. Patients with schizophrenia were recruited from ongoing clinical research studies at the Nathan Kline Institute and were receiving antipsychotic medication (11 atypical, 1 typical, 3 both) at the time of the investigation. The mean duration of illness was 13.5 years (standard deviation: 7.3, range: 2–24 years). Controls were volunteers from the community and were given the SCID – nonpatient edition (SCID-N/P). None of the controls had a history of Axis I or Axis II psychiatric disorders. The exclusion criteria for any participant were history of seizure, head trauma, loss of consciousness >30 min, major medical condition, magnetic resonance contraindications, and history of alcohol or other drug dependence. The experimental procedures were approved by the local Institutional Review Board and all participants gave written, informed consent before participation.
Image acquisition
Magnetic resonance scans were performed on a 1.5 T Siemens Vision system (Erlangen, Germany) with a quadrature birdcage head coil. Image sequences acquired included a high-resolution three-dimensional sagittal T1-weighted magnetization-prepared rapid gradient echo (MP-RAGE) image (TR/TE=11.6/4.9 ms, matrix size: 256 × 256, FOV: 256 mm, 190 slices, 1 mm slice thickness, 0 mm gap). A dual spin echo scan generated proton density and T2-weighted images (TR=5000 ms, TE=22/90 ms, matrix size: 190 × 256, FOV: 240 mm, 26 slices, 5 mm slice thickness, 0 mm gap), acquired in an oblique axial orientation parallel to the anterior commissure—posterior commissure plane. Diffusion-weighted images were acquired in the axial plane with a pulsed gradient, double spin echo, echo planar imaging sequence (TR/TE=6000/100 ms, matrix size: 128 × 128, FOV: 320 mm, 19 slices, 5 mm slice thickness, 0 mm gap, NEX=7, b=1000 s/mm2). To facilitate the coregistration process, the diffusion-weighted and double-echo (T2/PD) images were matched for slice thickness and spatial orientation. Diffusion-weighted images were acquired along eight nonparallel directions, together with a volume without diffusion weighting (b=0 s/mm2).
Image analysis
Following the procedures detailed by Basser et al. [11,12], at each voxel in the brain, we set up eight linear equations (one for each diffusion-weighted volume) and six unknowns, with the unknowns being the elements of the diffusion tensor D. This system of linear equations was solved using ordinary least squares yielding an estimate of D for each voxel in the brain. We then averaged the diagonal elements of D at each voxel to obtain an ADC map for each of the 30 participants.
The ADC volumes were then registered to a standard spatial template in the Talairach and Tournoux space [13] using a registration procedure comprising the following three separate transformations that were combined mathematically into a single transformation and applied to the ADC map of each participant [14,15]. (1) A nonlinear transformation matching the nondiffusion weighted (b=0) image to the T2-weighted image. This transformation corrects the spatial distortions present in the echo planar imaging data [16]. (2) A linear rigid-body transformation matching the T2-weighted image and the MP-RAGE image [17]. (3) A nonlinear transformation matching the MP-RAGE image of each participant to the template image in Talairach and Tournoux space [16]. Finally, all three transformations were combined mathematically into a single transformation and applied to the ADC map of each participant using a single trilinear interpolation, bringing the ADC maps to the standard space with a final 1 mm3 isotropic voxel size. No smoothing was applied to the registered ADC maps, except what would be automatically introduced as a result of the linear interpolation applied.
Following the interparticipant registration of the ADC maps, a two-tailed voxelwise independent samples Student’s t-test was applied in order to determine the voxels at which the ADC values significantly differed between the patients and healthy controls. This procedure produced a statistical parametric map of t-values with 28 degrees of freedom, which was subsequently thresholded at 2.76 (p<0.01; two-tailed) to obtain the voxels where the ADC maps were significantly different. To reduce the false-alarm rate, we only retained clusters of size 200 mm3 or greater in the thresholded image. It must be mentioned that the cluster size threshold of 200 mm3 was selected empirically and the extent to which the false-alarm rate is reduced is unknown.
RESULTS
After calculation of voxelwise t-values, thresholding at p<0.01 (two-tailed), and applying a cluster size threshold of 200 mm3, 25 clusters remained in which significant differences were observed between patients and controls. In 24 of these clusters, patients showed higher ADC than controls, with cluster size minimum, maximum, and median being 222, 13939, and 436.5 mm3, respectively. Only in one cluster was the ADC reduced in patients. The size of this cluster was just over our size threshold at 203 mm3. This was the smallest of the 25 significant clusters detected, and was located just anterior to the upper aspect of the pons (Fig. 1e). Remnants of all 25 significant clusters survived when we increased the threshold to 3.67 (p<0.001); that is, each cluster contained at least one voxel at or above the p<0.001 significance level.
Fig. 1.
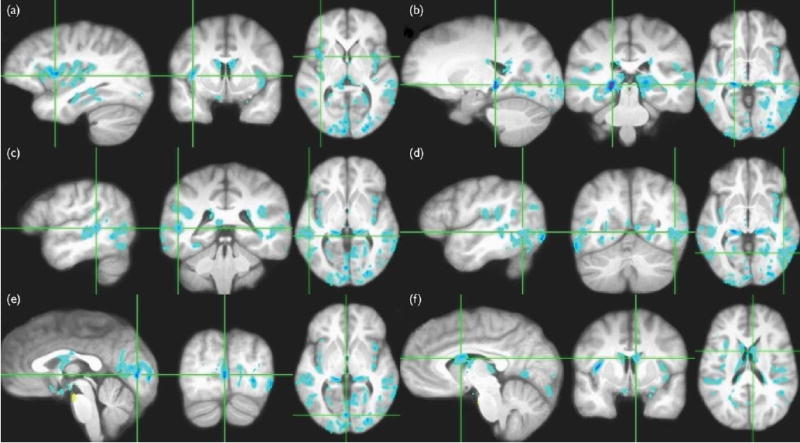
Regions where the patient group had a significantly (p<0.01, cluster size >200 mm3) higher apparent diffusion coefficient (ADC) than the control group are shown in blue superimposed on the average interparticipant registered magnetization-prepared rapid gradient echo images from all 30 participants.(a) Bilateral insular cortex. (b) Bilateral hippocampus. (c) Bilateral superior and middle temporal gyri. (d) Bilateral posterior part of the inferior temporal gyrus, with somewhat larger affected region on the left. (e) Several bilateral regions on the occipital lobe including the calcarine cortex, lingual gyrus, cuneus, and middle occipital gyrus. The region highlighted in yellow is the only significant cluster in which controls had increased ADC. (f) The lateral ventricles.
Areas in which ABM analysis suggests volume deficits in patients are shown in Fig. 1 in radiological convention. In this figure, the detected clusters are superimposed on the average of the 30 registered MP-RAGE images in Talairach space. The affected regions included the bilateral insular cortex (a), bilateral hippocampus (b), bilateral superior and middle temporal gyri (c), bilateral posterior part of the inferior temporal gyrus, with somewhat larger affected region on the left (d), several bilateral regions on the occipital lobe including the calcarine cortex, lingual gyrus, cuneus, and middle occipital gyrus (e), and the lateral ventricles (f).
DISCUSSION
Smaller brain volume and higher CSF volume are well replicated findings in MRI studies of schizophrenia. Increased volume of the lateral ventricles [18] and/or enlargement of sulci [7], and cortical gray matter volume deficits in areas including the hippocampus [3], frontal lobes [19], temporal lobes, and the insular cortex [20] are frequently reported. In the present study, analysis of group differences in ADC revealed widespread brain areas in which patients had significantly higher ADC than controls, including bilateral insula, hippocampus, temporal and occipital regions, and the lateral ventricles. Higher ADC in controls was confined to one small cluster just anterior to the upper aspect of the pons.
The human insular cortex is part of the paralimbic cortex entirely concealed within the Sylvian fissure beneath the frontoparietal and temporal opercula. The paralimbic regions are thought to be involved with integration of extrapersonal stimuli with the internal milieu [21]. Because schizophrenia patients have difficulty distinguishing internal representations from environmental stimuli, insular abnormalities may be relevant to the pathophysiology of schizophrenia. We found bilateral increases in ADC in the insular cortex in patients with schizophrenia (Fig. 1a). This increase is consistent with volume loss in the insular cortex in this population, which has been reported in studies using manual region of interest-based and automatic voxel-based structural MRI studies [4]. One recent magnetic resonance structural study, however, found no statistically significant difference in volume between patients and controls in this area [22]. Their negative results are likely to be due to methodological factors, highlighting the need for a standardized automatic and sensitive method for morphometric analysis.
The hippocampus is believed to be of central importance in the cognitive pathology of schizophrenia [23]. We found spatially extensive bilateral hippocampal ADC increases, consistent with the volume deficits in patients that have been reported [3]. Bilateral volume reductions in temporal regions also have been a frequent finding in schizophrenia, which may be reflected in the ADC increases seen in the present study (Fig. 1c and d). We also found increases in ADC in the gray matter of the occipital lobe (Fig. 1e), an infrequently studied region in schizophrenia. However, these results may be related to the deficits in early-stage visual processing reported in patients with schizophrenia [24]. In a previous study, we also showed fractional anisotropy abnormalities in occipital white matter [14], adding potential significance to the present findings. The clusters located in the ventricular systems (Fig. 1f) may reflect the well documented finding of enlarged ventricles in patients [18].
We did not find any significant increases of ADC in prefrontal areas. However, lowering the threshold from p<0.01 to p<0.05 did unmask some clusters in the medial frontal areas and on the right dorsolateral prefrontal cortex. This suggests either less pronounced volume changes in the frontal lobe or a lack of statistical power for detecting differences in this region, which may be resolved by increasing the size of our cohort. Preliminary results from a larger cohort under evaluation indicate the presence of significant ADC changes in the frontal regions.
The ADC, which is used as a marker for parenchymal volume reduction in this study, may also indicate other abnormalities such as vasogenic edema (usually a subacute process) and foci of ischemic injury. However, we did not see grossly increased signal or focal hyperintensities on T2-weighted images, suggesting that these are unlikely reasons for the present findings.
It must be mentioned that this report was meant to illustrate the application of ABM to a population known to have extensive regional brain volume deficits. We are currently in the process of validating the measures in relationship to specific regional volumes. It is also of interest to determine whether ADC correlates with illness duration, and whether these abnormalities are involved with disease expression and present in a first episode schizophrenia or a prodromal cohort. The extent to which the spatial patterns of ADC changes are disease specific is also an important issue to address in future studies.
Finally, a number of studies have shown reduced gray matter density in schizophrenia using VBM, but the results are inconsistent. It would be interesting to directly compare the results obtained from ABM with other voxelwise methods such as VBM. While this is beyond the scope of the present paper, we can point out an advantage of ABM over VBM, in that it does not require gray matter segmentation, and hence may prove to yield more reproducible results. The disadvantage of ABM is that it requires a few extra minutes of scanning for the acquisition of diffusion-weighted images. Also, a drawback of diffusion-weighted MRI is that the data are usually collected using spin-echo echo planar imaging sequences, which are particularly susceptible to b0 field inhomogeneities and eddy currents that cause imaging gradient nonlinearity. Both manifest themselves as spatial and intensity distortions in the reconstructed images. Thus, analysis of ABM data requires correction for these artifacts, either by postprocessing techniques, such as those applied in the paper, or by collecting additional reference scans (e.g. field maps) that may be used to correct the distortions retrospectively. Another possibility is to acquire the diffusion-weighted imaging data using magnetic resonance pulse sequences that are relatively immune to susceptibility distortions such as STEAM diffusion-weighted imaging [25].
CONCLUSION
This paper proposes a new indirect method for highlighting brain regions with potential volume deficits in groups of study participants using diffusion-weighted MRI. The method dubbed ADC-based morphometry, or ABM, was tested on images from a group of patients with chronic schizophrenia and a group of age-matched controls. ABM found widespread ADC increases in patients relative to controls. The neuroanatomical pattern of ADC changes parallels results from numerous volumetric studies in schizophrenia. The method introduced in this paper is potentially valuable for understanding brain abnormalities in schizophrenia and other psychiatric disorders.
Acknowledgments
This research was supported by a Biomedical Engineering Research Grant RG-00-0350 from the Whitaker Foundation (B.A.A.), and by NIMH grants RO1MH64783 (M.J.H.), and RO1MH66374 (P.D.B.).
References
- 1.Shenton ME, Dickey CC, Frumin M, McCarley RW. A review of MRI findings in schizophrenia. Schizophr Res. 2001;49:1–52. doi: 10.1016/s0920-9964(01)00163-3. [DOI] [PMC free article] [PubMed] [Google Scholar]
- 2.Palmen SJ, van Engeland H. Review on structural neuroimaging findings in autism. J Neural Transm. 2004;111:903–929. doi: 10.1007/s00702-003-0068-9. [DOI] [PubMed] [Google Scholar]
- 3.Bogerts B, Lieberman JA, Ashtari M, Bilder RM, Degreef G, Lerner G, et al. Hippocampus–amygdala volumes and psychopathology in chronic schizophrenia. Biol Psychiatry. 1993;33:236–246. doi: 10.1016/0006-3223(93)90289-p. [DOI] [PubMed] [Google Scholar]
- 4.Takahashi T, Suzuki M, Hagino H, Zhou SY, Kawasaki Y, Nohara S, et al. Bilateral volume reduction of the insular cortex in patients with schizophrenia: a volumetric MRI study. Psychiatry Res. 2004;132:187–196. doi: 10.1016/j.pscychresns.2004.11.002. [DOI] [PubMed] [Google Scholar]
- 5.Davis KA, Kwon A, Cardenas VA, Deicken RF. Decreased cortical gray and cerebral white matter in male patients with familial bipolar I disorder. J Affect Disord. 2004;82:475–485. doi: 10.1016/j.jad.2004.03.010. [DOI] [PubMed] [Google Scholar]
- 6.Ashburner J, Friston KJ. Voxel based morphometry – the methods. Neuroimage. 2000;11:805–821. doi: 10.1006/nimg.2000.0582. [DOI] [PubMed] [Google Scholar]
- 7.Good CD, Johnsrude IS, Ashburner J, Henson RN, Friston KJ, Frackowiak RS. A voxel-based morphometric study of ageing in 465 normal adult human brains. Neuroimage. 2001;14:21–36. doi: 10.1006/nimg.2001.0786. [DOI] [PubMed] [Google Scholar]
- 8.Bookstein FL. ‘Voxel-based morphometry’ should not be used with imperfectly registered images. Neuroimage. 2001;14:1454–1462. doi: 10.1006/nimg.2001.0770. [DOI] [PubMed] [Google Scholar]
- 9.Narr KL, Sharma T, Woods RP, Thompson PM, Sowell ER, Rex D, et al. Increases in regional subarachnoid CSF without apparent cortical gray matter deficits in schizophrenia: modulating effects of sex and age. Am J Psychiatry. 2003;160:2169–2180. doi: 10.1176/appi.ajp.160.12.2169. [DOI] [PubMed] [Google Scholar]
- 10.First MB, Spitzer RL, Gibbon M, Williams JBW. Structured clinical interview for DSM-IV Axis-I disorders, SCID clinician version. New York: Biometrics Research Department; p. 1995. [Google Scholar]
- 11.Basser PJ, Mattiello J, LeBihan D. Estimation of the effective self-diffusion tensor from the NMR spin echo. J Magn Res B. 1994;103:247–254. doi: 10.1006/jmrb.1994.1037. [DOI] [PubMed] [Google Scholar]
- 12.Basser PJ. Inferring microstructural features and the physiological state of tissues from diffusion-weighted images. NMR Biomed. 1995;8:333–344. doi: 10.1002/nbm.1940080707. [DOI] [PubMed] [Google Scholar]
- 13.Talairach J, Tournoux P. Co-planar stereotaxic atlas of the human brain. New York: Thieme; 1988. [Google Scholar]
- 14.Ardekani BA, Nierenberg J, Hoptman MJ, Javitt DC, Lim KO. MRI study of white matter diffusion anisotropy in schizophrenia. Neuroreport. 2003;14:2025–2029. doi: 10.1097/00001756-200311140-00004. [DOI] [PubMed] [Google Scholar]
- 15.Hoptman MJ, Ardekani BA, Butler PD, Nierenberg J, Javitt DC, Lim KO. DTI and impulsivity in schizophrenia. A first voxelwise correlational study. Biol Psychiatry. 2004;15:2467–2470. doi: 10.1097/00001756-200411150-00007. [DOI] [PMC free article] [PubMed] [Google Scholar]
- 16.Ardekani BA, Guckemus S, Bachman A, Hoptman MJ, Wojtaszek M, Nierenberg J. Quantitative comparison of algorithms for inter-subject registration of 3D volumetric brain MRI scans. J Neurosci Methods. 2005;142:67–76. doi: 10.1016/j.jneumeth.2004.07.014. [DOI] [PubMed] [Google Scholar]
- 17.Ardekani BA, Braun M, Hutton BF, Kanno I, Iida H. A fully automatic multimodality image registration algorithm. J Comput Assist Tomogr. 1995;19:615–623. doi: 10.1097/00004728-199507000-00022. [DOI] [PubMed] [Google Scholar]
- 18.DeLisi LE, Hoff AL, Schwartz JE, Shields GW, Halthore SN, Gupta S, et al. Brain morphology in first-episode schizophrenia-like psychotic patients: a quantitative magnetic resonance imaging study. Biol Psychiatry. 1991;29:159–175. doi: 10.1016/0006-3223(91)90044-m. [DOI] [PubMed] [Google Scholar]
- 19.Andreasen NC, Flashman L, Flaum M, Arndt S, Swayze V, O’Leary DS, et al. Regional brain abnormalities in schizophrenia measured with magnetic resonance imaging. J Am Med Assoc. 1994;272:1763–1769. [PubMed] [Google Scholar]
- 20.Crespo-Facorro B, Kim JJ, Andreasen NC, O’Leary DS, Bockholt HJ, Magnotta V. Insular cortex abnormalities in schizophrenia: a structural magnetic resonance imaging study of first-episode patients. Schizophr Res. 2000;46:35–43. doi: 10.1016/s0920-9964(00)00028-1. [DOI] [PubMed] [Google Scholar]
- 21.Mesulam MM, Mufson EJ. Insula of the old world monkey. I. Architectonics in the insulo-orbito-temporal component of the paralimbic brain. J Comp Neurol. 1982;212:1–22. doi: 10.1002/cne.902120102. [DOI] [PubMed] [Google Scholar]
- 22.Pressler M, Nopoulos P, Ho BC, Andreasen NC. Insular cortex abnormalities in schizophrenia: relationship to symptoms and typical neuroleptic exposure. Biol Psychiatry. 2005;57:394–398. doi: 10.1016/j.biopsych.2004.11.010. [DOI] [PubMed] [Google Scholar]
- 23.Harrison PJ. The hippocampus in schizophrenia: a review of the neuropathological evidence and its pathophysiological implications. Psychopharmacology. 2004;174:151–162. doi: 10.1007/s00213-003-1761-y. [DOI] [PubMed] [Google Scholar]
- 24.Butler PD, Zemon V, Schechter I, Saperstein AM, Hoptman MJ, Lim KO, et al. Early-stage visual processing and cortical amplification deficits in schizophrenia. Arch Gen Psychiatry. 2005;62:495–504. doi: 10.1001/archpsyc.62.5.495. [DOI] [PMC free article] [PubMed] [Google Scholar]
- 25.Sommer M, Koch MA, Paulus W, Weiller C, Buchel C. Disconnection of speech-relevant brain areas in persistent developmental stuttering. Lancet. 2002;360:380–383. doi: 10.1016/S0140-6736(02)09610-1. [DOI] [PubMed] [Google Scholar]