Abstract
Tricarballylate is the causative agent of grass tetany, a ruminant disease characterized by acute magnesium deficiency. Tricarballylate toxicity has been attributed to its ability to chelate magnesium and to inhibit aconitase, a Krebs cycle enzyme. Neither the ruminant nor the normal rumen flora can catabolize tricarballylate to ameliorate its toxic effects. However, the gram-negative enterobacterium Salmonella enterica can use tricarballylate as a carbon and energy source, providing an opportunity to study the genes and enzymes required for tricarballylate catabolism. The tricarballylate utilization (tcu) genes are organized into two transcriptional units, i.e., tcuR and tcuABC. Here, we report the initial biochemical analysis of TcuA. TcuA catalyzed the oxidation of tricarballylate to cis-aconitate. The apparent Km of TcuA for tricarballylate was 3.8 ± 0.4 mM, with a Vmax of 7.9 ± 0.3 mM min−1, turnover number (kcat) of 6.7 × 10⁻² s−1, and a catalytic efficiency (kcat/Km) of 17.8 M−1 s−1. Optimal activity was measured at pH 7.5 and 30°C. The enzyme was inactivated at 45°C. One mole of FAD was present per mole of TcuA. We propose a role for TcuB as an electron shuttle protein responsible for oxidizing FADH2 back to FAD in TcuA.
Tricarballylate, a citrate analog, is considered to be the causative agent of grass tetany, a ruminant disease characterized by acute magnesium deficiency (14). Previous reports have found a strong correlation between the accumulation of trans-aconitate in the rumen and incidence of the disease (5). In the rumen, trans-aconitate present in grass is rapidly reduced to tricarballylate (14), leading to Mg(II) ion chelation and excretion and inhibition of aconitase (15, 17, 18).
Neither the ruminant nor the normal rumen flora can catabolize tricarballylate. However, it was previously reported that Salmonella enterica serovar Typhimurium strain LT2 (hereafter referred to as S. enterica) utilizes tricarballylate as a carbon and energy source (6). More recently, we identified in this bacterium four genes dedicated to tricarballylate catabolism (11). Three of the tricarbalylate utilization (tcu) genes, namely tcuABC (formerly STM0691, citB, and citA), comprise a single transcriptional unit, while the fourth gene (tcuR [formerly STM0692]) is independently transcribed from tcuABC.
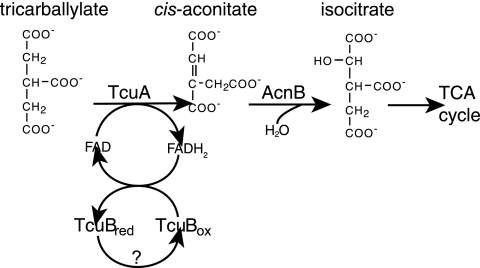
Results from in vivo genetic experiments suggested that tricarballylate catabolism occurred via the Krebs cycle, as mutants lacking isocitrate dehydrogenase function (icd) failed to utilize tricarballylate. On the basis of these results, we proposed that tricarballylate catabolism proceeds via cis-aconitate (Fig. 1) (11).
FIG. 1.
Model for tricarballylate catabolism in S. enterica. TcuA oxidizes tricarballylate to cis-aconitate, which can then be catabolized via the Krebs cycle. We propose TcuB is needed to reoxidize FADH2 bound to TcuA to allow further rounds of catalysis. TCA, tricarboxylic acid.
Here we report the initial biochemical analysis of TcuA, the first gene product encoded by the tcu operon. TcuA is homologous to flavoproteins such as succinate dehydrogenase, and hence was a prime candidate for playing a catabolic role in tricarballylate utilization. We show that TcuA is an FAD-dependent tricarballylate dehydrogenase that converts tricarballylate into cis-aconitate. We also report the kinetic constants for the TcuA-catalyzed reaction, along with other physical properties of the enzyme. We propose a role for TcuB as an electron shuttle protein.
MATERIALS AND METHODS
Bacterial strains, culture media, and growth conditions.
A list of strains and plasmids used and their genotypes is provided in Table 1. All chemicals were purchased from Sigma unless otherwise stated. Escherichia coli cultures were grown in lysogeny broth (also known as Luria-Bertani broth [Difco]) (2, 3). When added to the medium, ampicillin was present at 100 μg/ml.
TABLE 1.
Characteristics of the E. coli strains used in this study
| E. coli strain | Genotype | Source |
|---|---|---|
| DH5α/F′ | F′ endA1 hsdR17 (rK− mK+) supE44 thi-1 recA1 gyrA (Nalr) relA1 Δ(lacZYA-argF)U169 deoR [φ80dlacΔ(lacZ)M15] | New England Biolabs |
| ER2566 | F− λ−fhuA2 [lon] ompT lacZ::T7 gene I gal sulA11 Δ(mcrC-mrr)114::IS10 R(mcr-73::mini-Tn10)2 R(zgb-210::Tn10)1 (Tets) endA1 [dcm] | New England Biolabs |
| JE6289 | DH5α/pTCU12 (tcuA+ bla+) | This work |
Recombinant DNA techniques for plasmid construction.
Plasmids were propagated in E. coli strain DH5α except where noted. Genomic DNA for PCR was prepared from Salmonella enterica strain TR6583 (metE205 ara-9) using the MasterPure genomic DNA purification kit (Epicenter Technologies). All primers used for PCR amplifications were purchased from Integrated DNA Technologies.
(i) Plasmid pTCU11.
The tcuA gene was PCR amplified from strain TR6583 as previously described (8). Primers containing a 5′-NdeI site and a 3′-SapI site were used in the PCR. The 1.4-kb PCR product was purified and cloned with the pGEM-T Easy vector system according to manufacturer's instructions. The resulting plasmid was 4.4 kb, encoded ampicillin resistance, and was named pTCU11.
(ii) Plasmid pTCU12.
Plasmid pTCU11 was cut with restriction enzymes NdeI and SapI to remove a 1.4-kb fragment containing the tcuA gene, which was cloned into plasmid pTYB1 (New England Biolabs) cut with the same enzymes. The resulting plasmid was 9.1 kb, encoded ampicillin resistance, and was called pTCU12. Plasmid pTCU12 was used to overproduce the TcuA protein with a chitin-binding domain (CBD) fused to its C terminus (TcuA-CBD).
Biochemical techniques. (i) Overproduction and purification of TcuA protein.
S. enterica TcuA-CBD protein was overproduced using plasmid pTCU12 in E. coli strain ER2566 (Stratagene). Twenty millliliters of a 30°C overnight culture of E. coli ER2566/pTCU12 grown in super optimal broth (SOB) (7) containing ampicillin (100 μg/ml) was used to inoculate 1 liter of SOB plus glucose (SOC) medium. SOC cultures were grown at 18°C with shaking to a cell density (optical density at 600 nm) of 0.30, at which point isopropyl-β-d-thiogalactopyranoside (IPTG) was added to a final concentration of 500 μM. After the addition of IPTG, cultures were incubated under the same conditions for an additional 18 h. Cells were harvested by centrifugation at 7,741 × g at 4°C for 10 min using an Avanti J-20 XPI centrifuge (Beckman-Coulter) equipped with a JLA 8.1000 rotor. Cells were resuspended in 20 ml of 20 mM N-cyclohexyl-2-aminoethanesulfonic acid (HEPES) buffer, pH 7.5, containing KCl (500 mM), ethylenediaminotetraacetic acid (EDTA; 1 mM), and non-ionic surfactant Triton X-100 (0.1% [vol/vol]). Cells were broken open by passing them twice through a French press (Aminco) at ≈1.6 × 10⁵ kPa using a 40-ml chilled pressure cell. Cell lysate was clarified by centrifugation at 43,667 × g at 4°C for 30 min, and TcuA-CBD protein was purified on chitin beads (New England Biolabs) according to the manufacturer's instructions. The CBD tag was removed from the TcuA-CBD protein by soaking the chitin beads in buffer containing 50 mM dithiothreitol (DTT) for 20 h at 4°C. After purification, TcuA protein was concentrated using a Centriprep YM-10 centrifugal filter (Amicon) according to the manufacturer's instructions. After concentration, the protein was incubated for 12 h at 4°C with FAD (1 mM). After FAD incubation, the protein was dialyzed using a 10,000-Da-molecular-mass-cutoff Slide-A-Lyzer cassette (Pierce) at 4°C against 1 liter of 50 mM HEPES buffer, pH 7.5, containing KCl (100 mM), tris(2-carboxyethyl)phosphine (TCEP) hydrochloride (250 μM), and glycerol (20% [vol/vol]). The purity of the protein was assessed by sodium dodecyl sulfate polyacrylamide-gel electrophoresis (10) after staining with Coomassie brilliant blue R-250 (16). The protein concentration was determined by the methods of Bradford (4). TcuA protein was flash-frozen with liquid N2 and stored at −80°C until used.
(ii) Gel filtration analysis.
Gel filtration was performed using a Superdex 200 HR 10/30 column (Amersham Pharmacia) equilibrated with 50 mM sodium phosphate, pH 7.4, containing 1 M NaCl by fast protein liquid chromatography. One hundred microliters of TcuA (0.8 mg/ml) was eluted at a flow rate of 0.5 ml/min. Molecular mass standards used were creatine phosphokinase (81 kDa), formate dehydrogenase (74 kDa), bovine serum albumin (66 kDa), ovalbumin (44 kDa), DNase I (31 kDa), lysozyme (14 kDa), and vitamin B12 (1.35 kDa).
(iii) Identification of the flavin cofactor bound to TcuA.
For flavin analysis, a preparation of TcuA that was not reconstituted with FAD was used. The absorption spectrum of TcuA was obtained by adding 10 μl TcuA (4.3 mg/ml) to 990 μl double-distilled H2O (ddH2O) in a cuvette and using a Lambda 40 UV/Vis spectrometer (Perkin-Elmer). TcuA protein was diluted to 20 μM and denatured at 100°C for 10 min to free the flavin cofactor. Denatured protein was removed by centrifugation, and flavin-containing supernatant was filtered using a Corning Spin-X centrifuge filter. Flavins were separated using a System Gold 126 high-performance liquid chromatography (HPLC) solvent system (Beckman Coulter) equipped with a Luna 5-mm C18 column (Phenomenex) developed with gradients generated with 5 mM ammonium acetate buffer, pH 6.5 (solvent A), and 100% methanol (solvent B), as reported elsewhere (1); flow rate was maintained at 1 ml/min. The column was equilibrated with a buffer system containing 85% solvent A-15% solvent B. Five minutes postinjection, the column was developed for 20 min with a linear gradient until the final composition of the buffer system was 25% solvent A-75% solvent B. A second 5-min linear gradient was used to develop the column to a final buffer composition of 0% solvent A-100% solvent B. Flavins were detected by absorption at 264 nm using a System Gold 168 (Beckman Coulter) photodiode array detector; authentic FAD and flavin mononucleotide (FMN) were used as controls. HPLC-purified flavin was dried under vacuum using a Savant concentrator, resuspended in ddH2O (1 ml), and loaded onto a 1-ml Sep-Pak C18 cartridge (Waters) equilibrated with ddH2O. The column was washed with ddH2O (5 ml), and flavin was eluted with 100% methanol (1.5 ml). The sample containing the eluted cofactor was dried under vacuum and submitted for analysis to the mass spectrometry (MS) facility at the University of Wisconsin—Madison Biotechnology Center. The electrospray ionization mass spectrum (ESIMS) was obtained by using the MDS Sciex API 365 mass spectrometer (Applied Biosystems).
(iv) Determination of the FAD-TcuA stoichiometry.
Two samples of TcuA were diluted in ddH2O to a concentration of 10 μM. TcuA protein was denatured by heating the samples to 100°C for 10 min to release FAD. Denatured protein was removed by centrifugation, the supernatant was transferred to a cuvette, and the absorbance at 450 nm was measured using a Lambda 40 UV/Vis spectrometer (Perkin-Elmer). The extinction coefficient of FAD at 450 nm (11,300 M−1 cm−1) (12) was used to determine the concentration of the cofactor in solution.
(v) Identification of cis-aconitate as the product of the TcuA reaction.
A reaction mixture containing TcuA and tricarballylate was incubated under the conditions described below. After incubation, the sample was filtered using a Corning Spin-X centrifuge filter, and 1 μl of 5.0 M H2SO4 was added. In a control experiment, authentic cis-aconitate was added (50 μM final concentration) to a second identical sample. Organic acids present in the sample were resolved isocratically (5 mM H2SO4) using a System Gold 126 HPLC solvent system (Beckman Coulter) equipped with an HPX-87H ion exclusion column (Aminex) at a flow rate of 0.6 ml/min; the temperature of the column was maintained at 45°C. Organic acids were detected by their absorbance at 210 nm using a photodiode array detector. Authentic tricarballylate and cis-aconitate were used as standards. To determine whether the reaction product was the cis- or trans-isomer, the reaction mixture was heated at 95°C for 60 min and then resolved by the HPLC method described above. Authentic tricarballylate and cis-aconitate were subjected to heat treatment as controls. Additionally, authentic trans-aconitate was used as a standard for HPLC retention time.
(vi) MS of the TcuA reaction product.
The HPLC-purified product of the TcuA reaction was extracted with diethyl ether (10 ml). Diethyl ether was added to the reaction mixture and mixed by inversion; the ether phase was transferred to a fresh tube and dried under vacuum using a Savant concentrator. Organic acids in the pellet were resuspended in ddH2O (1 ml), transferred to a fresh tube, and dried again under vacuum. The sample was submitted for ESIMS analysis at the University of Wisconsin—Madison Biotechnology Center. Diethyl ether-extracted authentic tricarballylate and cis-aconitate were used as standards.
(vii) Optimal parameters for assaying TcuA activity.
Optimal tricarballylate dehydrogenase activity was measured in reaction mixtures (200-μl final volume) containing TcuA protein (20 μg), dithiothreitol (1 mM), and Tris-Cl buffer (100 mM, pH 7.5). Reaction mixtures were preincubated for 5 min at 30°C prior to the addition of tricarballylate (10 mM). A 120-min incubation period at 30°C consumed <10% of the substrate. Reaction mixtures were heated at 65°C for 20 min to terminate the reaction.
(viii) Optimal pH.
2-Morpholinoethanesulfonic acid (MES) or Tris chloride (Tris-Cl) buffer (100 mM) was used to determine the optimal pH for assaying TcuA enzymatic activity. MES was used as buffer in reaction mixtures where the pH was between 5.5 and 6.5. Tris-Cl was used in reaction mixtures where the pH was in the range 7.0 to 9.0. After the addition of tricarballylate, 20-μl samples were removed after 60, 90, and 120 min of incubation at the stated temperature and added to 80 μl of 125 mM sulfuric acid. The amount of cis-aconitate in the 100-μl mixture was analyzed using HPLC protocols described above. Integration of peak areas of known quantities of authentic cis-aconitate was used to generate a standard curve.
(ix) Optimal temperature.
After finding an apparent pH optimum for the enzyme, the optimal temperature for the enzyme was established. Assays were performed at 25, 30, 37, and 45°C using Tris-Cl buffer, pH 7.5. All reactions were performed at least in duplicate.
(x) Kinetic parameters.
We used optimal conditions to assay TcuA activity as a function of substrate concentration. The range of tricarballylate concentrations analyzed was between 0.05 and 10 mM. Samples were removed after 60 min; 50 μl was removed when the initial substrate concentration was below 5 mM, and 20 μl was removed when the initial tricarballylate concentration was ≥5 mM. Samples were added to either 50 μl of 200 mM sulfuric acid or 80 μl of 125 mM sulfuric acid. In all cases, the total volume of the sample-acid mix was 100 μl, and the final concentration of sulfuric acid was 100 mM. Samples were injected and developed by the HPLC method described above. All reactions were performed at least in duplicate. Data were analyzed using GraphPad Prism v3.0; nonlinear regression was performed on the resulting curve to determine the kinetic constants for TcuA.
(xi) Anoxic TcuA assays.
For anoxic assays, all reagents were sparged with O2-free N2 for 20 min and then moved inside an anaerobic chamber. Optimal conditions to assay TcuA activity were used, and the reaction was initiated by the addition of tricarballylate to 10 mM. Sulfuric acid (5 M) was added to the 200-μl reaction mixtures to a final concentration of 100 mM. Samples were injected and developed by the HPLC method described above. Reactions were performed in triplicate.
RESULTS
TcuA contains FAD.
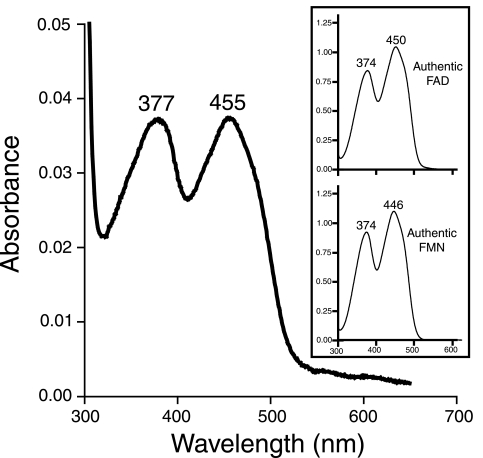
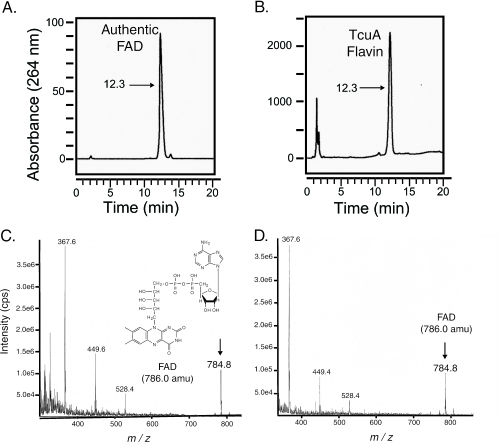
The TcuA protein was purified to homogeneity by using a C-terminal chitin-binding domain tag, which was subsequently cleaved as described above, yielding native TcuA protein (see Fig. S1 in the supplemental material). Purified TcuA (95% homogeneous) had a distinct yellow color, which suggested that the protein contained a cofactor. The absorption spectrum of TcuA had absorption maxima at 377 and 455 nm, which were diagnostic of a flavin (Fig. 2). To determine whether FAD or FMN was the cofactor for TcuA, the protein was denatured by heating and separated from its cofactor by filtration. The supernatant was yellow, suggesting that the flavin cofactor was not covalently bound to the enzyme. Flavin extracted from TcuA was isolated by reverse-phase HPLC. The flavin from TcuA eluted off the column 12.3 min after injection, a retention time that was consistent with that of authentic FAD (Fig. 3, compare panels A and B). Under the conditions used, control experiments with authentic FMN showed the latter eluting 15.9 min after injection (data not shown), which further suggested that FAD, not FMN, was the cofactor for TcuA. To provide further evidence that TcuA contained FAD, HPLC-purified flavin from TcuA was analyzed by ESIMS. A signal with an m/z of 784.8 was consistent with the expected molecular mass of FAD (Fig. 3D). The mass spectrum of the flavin isolated from TcuA was identical to that of authentic FAD (Fig. 3C).
FIG. 2.
Absorption spectrum for TcuA. The absorbance peaks at 377 and 455 nm are diagnostic of a flavoprotein. The inset shows the absorption spectra for authentic FAD (top) and FMN (bottom).
FIG. 3.
HPLC and ESIMS analyses of the flavin from TcuA. Chromatograms of either authentic FAD monitored at 264 nm (A) or the flavin isolated from heat-denatured TcuA (B) are shown. Numbers represent time (in minutes) of elution after injection. The fractions containing either authentic FAD (C) or the flavin isolated from TcuA (D) had identical mass spectra. The signal with an m/z of 784.8 was consistent with the negative ion of FAD (786 Da).
The FAD-TcuA stoichiometry was determined by heat denaturing the protein to liberate FAD and then using the molar extinction coefficient for FAD at 450 nm (11,300 M−1 cm−1) to determine the concentration of the cofactor. Under the conditions used to overexpress the tcuA gene, approximately 30% of the TcuA protein produced contained FAD (data not shown). Addition of a 20-fold excess of FAD over the amount of protein in solution enhanced the activity of substoichiometric preparations of TcuA, but did not affect the activity of TcuA in preparations where the protein was fully occupied with cofactor (data not shown). The FAD-TcuA stoichiometry was determined to be 1.3:1, suggesting that TcuA contained 1 molecule of FAD per TcuA monomer.
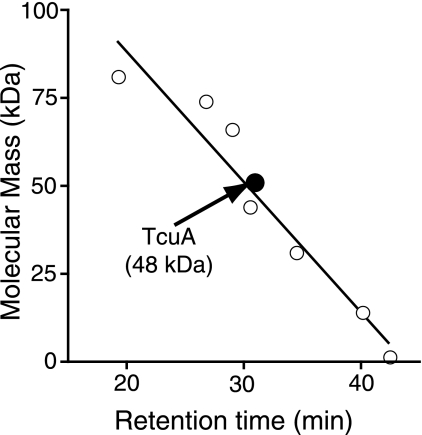
To determine the oligomeric state of TcuA, gel filtration analysis was performed. TcuA eluted with an apparent molecular mass of 48 kDa, compared to a predicted molecular mass of 51 kDa (Fig. 4). The absence of any peaks in the 100-kDa (or above) range was interpreted to mean that TcuA behaves as a monomer.
FIG. 4.
Oligomeric state of TcuA. Known protein standards (open circles) were used to calculate a standard curve. TcuA (solid circle) eluted with an apparent molecular mass of 48 kDa. The r2 value for the linear regression of the standard curve was 0.93.
TcuA-dependent oxidation of tricarballylate into cis-aconitate.
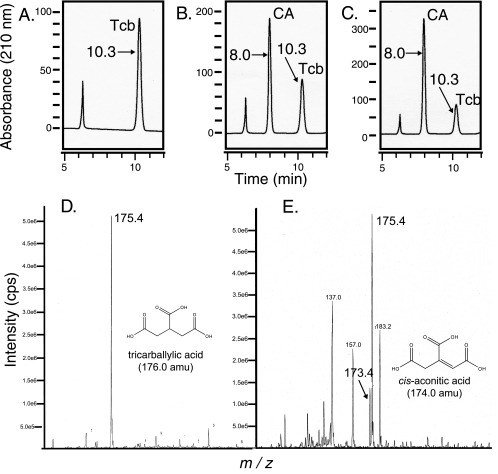
TcuA was tested for tricarballylate dehydrogenase activity by monitoring product formation using HPLC protocols. A signal for cis-aconitate was clearly detectable in the reaction mixture (retention time, 8.0 min), but was absent when TcuA protein was inactivated before incubation with the substrate (Fig. 5A). Additionally, when authentic cis-aconitate was added to the reaction mixture as an internal standard, the intensity for the signal eluting 8.0 min postinjection substantially increased (compare Fig. 5B and C). To confirm that the TcuA reaction product was cis-aconitate, organic acids from the reaction mixture were extracted and analyzed by MS. A signal with an m/z of 173.4 was consistent with the expected molecular mass of cis-aconitate (Fig. 5E). Additionally, the mass spectrum of authentic cis-aconitate had a signal with an m/z of 173.4 (data not shown). The mass spectrum of authentic tricarballylate did not have a signal with an m/z of 173.4 (Fig. 5D), which suggested that the signal that appeared in the reaction mixture was enzyme dependent. To further demonstrate that the reaction product of TcuA was the cis isomer and not the trans form, we took advantage of the interconvertibility of cis-aconitate to trans-aconitate at high temperatures. Heating cis-aconitate for 1 h at 95°C led to the accumulation of trans-aconitate (see Fig. S2A in the supplemental material). Heating the TcuA reaction mix led to the appearance of a peak identical in retention time to that when cis-aconitate was heat treated (see Fig. S2B in the supplemental material). The retention time of this peak was identical to that of authentic trans-aconitate (data not shown). Heat treatment of tricarballylate did not yield any additional compounds (data not shown). Collectively, these results indicated that TcuA was a FAD-dependent tricarballylate dehydrogenase that yields cis-aconitate.
FIG. 5.
HPLC and ESIMS analyses of the TcuA reaction product. Chromatograms of components of the reaction mixture monitored at 210 nm either with heat-inactivated TcuA (A) or with active TcuA (B) are shown. Panel C represents a sample of the TcuA reaction spiked with 50 μM authentic cis-aconitate. Numbers represent time (in minutes) of elution after injection. Tcb denotes tricarballylate, and CA denotes cis-aconitate. Panel D represents the ESIMS analysis of authentic tricarballylate. The signal with an m/z of 175.4 represents the negative ion of tricarballylic acid (176 Da). Panel E represents the ESIMS analysis of the TcuA reaction product. The signal with an m/z of 173.4 was consistent with the negative ion of cis-aconitate. The signal with an an m/z of 175.4 is presumed to be unconsumed tricarballylate.
Kinetic parameters for TcuA.
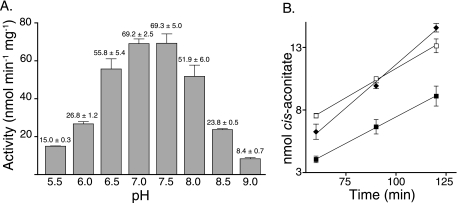
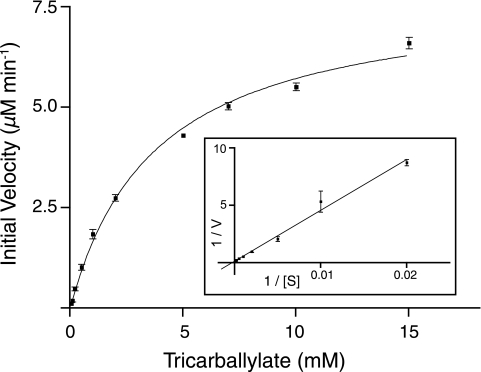
To determine optimal conditions for TcuA activity, pH and temperature profiles were obtained. The pH optimum was found to be near 7.0, and the temperature optimum was 30°C (Fig. 6); TcuA had no detectable activity at 45°C, which suggested that the enzyme was relatively heat labile. Additionally, TcuA activity was reduced under anoxic conditions (specific activity of 4.5 ± 0.3 nmol mg−1 min−1 versus 55.1 ± 1.0 nmol mg−1 min−1 for aerobic conditions), which suggested that, under the conditions used, oxygen was required for reoxidation of the FAD cofactor. Subsequent kinetic experiments were performed at 30°C and at pH 7.5. Under optimal assay conditions of pH and temperature, the apparent Km for tricarballylate was 3.8 ± 0.4 mM, with a Vmax at 7.9 ± 0.3 μM min−1, turnover number (kcat) of 6.7 × 10⁻² s−1, and a catalytic efficiency (kcat/Km) of 17.8 M−1 s−1 (Fig. 7).
FIG. 6.
pH and temperature profile for TcuA. Panel A shows the specific activity of TcuA over various pH ranges. Error measurements are presented as standard deviation. Panel B shows product accumulation over time at various temperatures: 25°C; closed squares; 30°C; closed diamonds; 37°C; open squares; 45°C, no detectable activity. Error bars denote standard deviation.
FIG. 7.
Kinetic parameters of TcuA. Initial velocities were calculated by measuring product formation after a 60-min reaction. The error bars denote standard deviation. The inset shows a Lineweaver-Burk plot of the data.
DISCUSSION
We report here evidence that tricarballylate catabolism starts by its conversion to the central metabolite cis-aconitate and that the TcuA protein has FAD-dependent tricarballylate dehydrogenase activity responsible for this conversion. The identification of cis-aconitate as a catabolite of tricarballylate is consistent with previously reported genetic evidence, which showed that the utilization of tricarballylate as a source of carbon and energy proceeds via the tricarboxylic acid cycle (11).
While tcuA provides the sole catabolic function required to convert tricarballylate into an utilizable intermediate, tcuA is not the only gene required for S. enterica to grow on tricarballyate. We previously showed that tcuA is the first gene in a three-gene operon and that all three genes are required for growth on tricarballylate (11). The third gene in the operon, tcuC, encodes a well-studied citrate transporter, and we propose that TcuC transports tricarballylate into the cell (19, 20). However, another gene, tcuB, is also required for S. enterica to grow on tricarballylate. TcuB contains two distinct cysteine-rich motifs, which presumably serve as ligands for two putative 4Fe-4S centers. In addition, based on hydropathy plots (9), TcuB is predicted to have trans-membrane domains. While in vitro it is apparent that oxygen can reoxidize the FAD cofactor of TcuA, we propose that, in vivo, TcuB is required to reoxidize the FAD cofactor.
The kinetic parameters for TcuA reported here probably underestimate the catalytic activity of TcuA. Once the system used by the cell to reoxidize FADH2 bound to TcuA is identified, these parameters will have to be reevaluated.
Recently, Warren and coworkers reported studies of a B12 biosynthetic enzyme from Rhodobacter capsulatus (CobZ) that has significant similarity to both TcuA and TcuB (13). The N-terminal portion of CobZ is homologous to TcuA, while the C terminus is homologous to TcuB. The authors showed that CobZ contains FAD, 4Fe-4S centers, and, surprisingly, heme. In addition, these authors showed that CobZ needed to be extracted with detergent in order to be solubilized, lending support to the claim that the CobZ protein, and by extension TcuB, is an integral membrane protein. The authors explored a model for CobZ in which it serves as a monooxygenase that uses reducing power from an unidentified source to catalyze the reaction. In their model, Warren et al. propose a flow of electrons opposite to the one we propose for TcuA and TcuB. Additional studies of TcuA and TcuB may lead to a greater understanding of the divergent evolution of enzymes that function in unrelated pathways.
Supplementary Material
Acknowledgments
This work was supported in part by USDA Hatch grant WIS04659 and NIH R01 grants GM62203 and GM40313 to J.C.E.-S. J.A.L. was supported in part by NIH Predoctoral Training grant T32 GM07215 in Molecular Biosciences, University of Wisconsin—Madison.
We thank M. Warren for helpful discussions.
Footnotes
Supplemental material for this article may be found at http://jb.asm.org/.
REFERENCES
- 1.Aliverti, A., B. Curti, and M. A. Vanoni. 1999. Identifying and quantitating FAD and FMN in simple and in iron-sulfur-containing flavoproteins, p. 9-23. In S. K. Chapman and G. A. Reid (ed.), Flavoprotein protocols, vol. 131. Humana Press, Totowa, N.J. [DOI] [PubMed] [Google Scholar]
- 2.Bertani, G. 2004. Lysogeny at mid-twentieth century: P1, P2, and other experimental systems. J. Bacteriol. 186:595-600. [DOI] [PMC free article] [PubMed] [Google Scholar]
- 3.Bertani, G. 1951. Studies on lysogenesis. I. The mode of phage liberation by lysogenic Escherichia coli. J. Bacteriol. 62:293-300. [DOI] [PMC free article] [PubMed] [Google Scholar]
- 4.Bradford, M. M. 1976. A rapid and sensitive method for the quantitation of microgram quantities of protein utilizing the principle of protein-dye binding. Anal. Biochem. 72:248-255. [DOI] [PubMed] [Google Scholar]
- 5.Burau, R., and P. R. Stout. 1965. trans-Aconitic acid in range grasses in early spring. Science 150:766-767. [DOI] [PubMed] [Google Scholar]
- 6.Gutnick, D., J. M. Calvo, T. Klopotowski, and B. N. Ames. 1969. Compounds which serve as the sole source of carbon or nitrogen for Salmonella typhimurium LT-2. J. Bacteriol. 100:215-219. [DOI] [PMC free article] [PubMed] [Google Scholar]
- 7.Hanahan, D. 1983. Studies on transformation of. Escherichia coli with plasmids. J. Mol. Biol. 166:557-580. [DOI] [PubMed] [Google Scholar]
- 8.Horswill, A. R., A. R. Dudding, and J. C. Escalante-Semerena. 2001. Studies of propionate toxicity in Salmonella enterica identify 2-methylcitrate as a potent inhibitor of cell growth. J. Biol. Chem. 276:19094-19101. [DOI] [PubMed] [Google Scholar]
- 9.Kyte, J., and R. F. Doolittle. 1982. A simple method for displaying the hydropathic character of a protein. J. Mol. Biol. 157:105-132. [DOI] [PubMed] [Google Scholar]
- 10.Laemmli, U. K. 1970. Cleavage and structural proteins during the assembly of the head of bacteriophage T4. Nature 227:680-685. [DOI] [PubMed] [Google Scholar]
- 11.Lewis, J. A., A. R. Horswill, B. E. Schwem, and J. C. Escalante-Semerena. 2004. The tricarballylate utilization (tcuRABC) genes of. Salmonella enterica serovar Typhimurium LT2. J. Bacteriol. 186:1629-1637. [DOI] [PMC free article] [PubMed] [Google Scholar]
- 12.Macheroux, P. 1999. UV-visible spectroscopy as a tool to study flavoproteins, p. 1-7. In S. K. Chapman and G. A. Reid (ed.), Flavoprotein protocols, vol. 131. Humana Press, Totowa, N.J. [DOI] [PubMed] [Google Scholar]
- 13.McGoldrick, H. M., C. A. Roessner, E. Raux, A. D. Lawrence, K. J. McLean, A. W. Munro, S. Santabarbara, S. E. Rigby, P. Heathcote, A. I. Scott, and M. J. Warren. 2005. Identification and characterization of a novel vitamin B12 (cobalamin) biosynthetic enzyme (CobZ) from Rhodobacter capsulatus, containing flavin, heme, and Fe-S cofactors. J. Biol. Chem. 280:1086-1094. [DOI] [PubMed] [Google Scholar]
- 14.Russell, J. B. 1985. Enrichment and isolation of rumen bacteria that reduce trans-aconitate to tricarballylic acid. Appl. Environ. Microbiol. 49:120-126. [DOI] [PMC free article] [PubMed] [Google Scholar]
- 15.Russell, J. B., and N. Forsberg. 1986. Production of tricarballylic acid by rumen microorganisms and its potential toxicity in ruminant tissue metabolism. Br. J. Nutr. 56:153-162. [DOI] [PubMed] [Google Scholar]
- 16.Sasse, J. 1991. Detection of proteins, p. 10.6.1-10.6. 8. In F. A. Ausubel, R. Brent, R. E. Kingston, D. D. Moore, J. G. Seidman, J. A. Smith, and K. Struhl (ed.), Current protocols in molecular biology, vol. 1. Wiley Interscience, New York, N.Y. [Google Scholar]
- 17.Schloss, J. V., M. H. Emptage, and W. W. Cleland. 1984. pH profiles and isotope effects for aconitase from Saccharomycopsis lipolytica, beef heart, and beef liver. a-Methyl-cis-aconitate and threo-Ds-a-methylisocitrate as substrates. Biochemistry 23:4572-4580. [DOI] [PubMed] [Google Scholar]
- 18.Schwartz, R., M. Topley, and J. B. Russell. 1988. Effect of tricarballylic acid, a nonmetabolizable rumen fermentation product of trans-aconitic acid, on Mg, Ca and Zn utilization of rats. J. Nutr. 118:183-188. [DOI] [PubMed] [Google Scholar]
- 19.Shimamoto, T., H. Izawa, H. Daimon, N. Ishiguro, M. Shinagawa, Y. Sakano, M. Tsuda, and T. Tsuchiya. 1991. Cloning and nucleotide sequence of the gene (citA) encoding a citrate carrier from Salmonella typhimurium. J. Biochem. (Tokyo) 110:22-28. [DOI] [PubMed] [Google Scholar]
- 20.Shimamoto, T., K. Negishi, M. Tsuda, and T. Tsuchiya. 1996. Mutational analysis of the CitA citrate transporter from Salmonella typhimurium: altered substrate specificity. Biochem. Biophys. Res. Commun. 226:481-487. [DOI] [PubMed] [Google Scholar]
Associated Data
This section collects any data citations, data availability statements, or supplementary materials included in this article.


