

Abstract
Objective
To compare changes in weight in obese patients who received long-acting octreotide (octreotide LAR) at one of three dose levels (20, 40, or 60 mg) or placebo over 6 months and to identify the lowest dose of octreotide LAR that safely achieved optimal weight loss.
Design
Randomized, double-blind, placebo-controlled trial of octreotide LAR at three dose levels.
Patients
A total of 172 adults (28 men and 144 women) with at least moderate obesity (body mass index (BMI) range 30–65 kg/m2) and evidence of insulin hypersecretion were enrolled. Patients were predominantly either Caucasian (50.0%) or African American (45.3%). The mean age (38±11 year), weight (110.7±23 kg), and BMI (39.8±6.5 kg/m2) were similar across the four treatment groups.
Measurements
Efficacy measures included weight, BMI, fasting serum glucose; triglycerides; percentage of total body fat and abdominal fat as measured by dual-energy X-ray absorptiometry; skin fold thickness; waist-to-hip circumference; leptin; percentage of carbohydrates, fat, and protein ingested; nutritional evaluation (including dietary analysis – 3-day food record); quality of life (QoL; using the Impact of Weight on Quality of Life-Lite™); Beck Depression Inventory; and Carbohydrate Craving Questionnaire. Safety measures included medical history, vital signs, physical examinations, hematology, blood chemistries, thyroid function tests, hemoglobin A1c, gallbladder ultrasound, electrocardiograms, and adverse events.
Results
After 6 months of treatment, patients receiving 40 or 60 mg of octreotide LAR experienced statistically significant weight loss compared to baseline, with mean differences from placebo in percent weight change of −1.98 and −1.87%, respectively. This finding was accompanied by statistically significant mean decreases in BMI compared to baseline, that is, a mean decrease of 0.73 and 0.79 kg/m2 for the 40 and 60 mg treatment arms, respectively. The observed weight loss was progressive during the 6-month treatment in the two higher dose groups. The lowest dose to reach statistical significance in weight loss after 6 months' treatment was 40 mg. Post hoc analysis revealed a 3.5–3.8% weight loss at month 6 in the two higher dose groups among Caucasian patients having insulin secretion greater than the median of the cohort, defined as CIRgp (corrected insulin response at the glucose peak) ≥1.43. There were no statistically significant changes in QoL scores, body fat, leptin concentration, Beck Depression Inventory, or macronutrient intake. Mean changes of blood glucose AUC0–180 min during an oral glucose tolerance test in patients taking octreotide LAR were 39–40 mg/dl h higher than those on placebo. A total of 7–21% of the patients taking octreotide LAR reached a 5% or greater decrease in body weight from Baseline, compared to 11% for the placebo group. This was not statistically significant. The most common adverse events included diarrhea, headache, cholelithiasis, nausea, and abdominal pain.
Conclusion
Octreotide LAR given at 40 or 60 mg resulted in statistically significant weight loss. A post hoc analysis stratifying patients by race and CIRgp indicated that Caucasian patients with the greater degree of insulin hypersecretion appeared to derive the most benefit from treatment. The observed safety profile was consistent with the known effects of octreotide from previous studies.
Keywords: octreotide, somatostatin, insulin, vagus
Introduction
Obesity is one of the most common public health problems in the United States, affecting approximately 33% of adults.1 It is defined as the pathologically excessive accumulation of body fat, which occurs when energy intake exceeds energy expenditure. Obesity is associated with a number of medical risks including insulin resistance and the development of type 2 diabetes mellitus, hypertension, hyperlipidemia, gallbladder disease, coronary artery disease, some forms of cancer, degenerative joint disease, and obstructive sleep apnea.2-4 Obese patients may also develop a poor self-image, which can lead to low self-esteem and clinical depression.5 Treatments for obesity include dietary modification, exercise, pharmacotherapy, and bariatric surgery.6-8
Obesity is a dysregulation of the negative feedback energy balance pathway.9 Insulin is a component of the efferent pathway, promoting storage of energy substrate in adipose tissue.10-12 Although obesity is routinely associated with insulin resistance, it has previously been shown that a subset of children who develop intractable obesity after treatment for brain tumors, termed ‘hypothalamic obesity’, exhibit insulin hypersecretion in response to oral glucose tolerance test (OGTT) due to excessive vagal stimulation of the β-cell.13 The vagus nerve increases insulin secretion by three mechanisms: opening of a sodium channel, which increases β-cell depolarization and widens the voltage-gated calcium channel resulting in greater calcium influx; stimulation of phospholipase C, which increases insulin exocytosis; and stimulation of intestinal glucagon-like peptide-1 (GLP-1), which binds to the β-cell membrane, stimulates adenyl cyclase, and increases insulin secretion.14 Insulin secretion can be assessed from an OGTT using the index variable corrected insulin response at the glucose peak (CIRgp).15
Octreotide is a synthetic, eight-amino-acid analogue of the natural hormone somatostatin. Like somatostatin, octreotide limits β-cell insulin secretion by inhibiting the G0 protein associated with the widening of the voltage-gated calcium channel.16 Octreotide also inhibits secretion of gastric acid, pancreatic enzymes, and bile, prolongs intestinal transit time, and decreases gallbladder contractility. Both somatostatin and octreotide inhibit the release of pituitary and gastroenteropancreatic hormones such as growth hormone (GH), thyroid stimulating hormone (TSH), glucagon, cholecystokinin (CCK), vasoactive intestinal peptide (VIP), gastrin, and ghrelin.17,18 Octreotide acetate (Sandostatinρ; Novartis, East Hanover, NJ, USA) is normally administered subcutaneously, three times per day. The long-acting formulation of octreotide (octreotide LAR; Sandostatin LARρ Depot; Novartis) is administered intramuscularly once a month.
Octreotide has previously been shown in both pilot19 and placebo-controlled20 trials to be effective in reducing insulin secretion, weight, and body mass index (BMI) in children with hypothalamic obesity. Suppression of insulin secretion in these children correlated with the observed reductions in weight, and with improved quality of life (QoL). A subpopulation of obese adults without cranial pathology also exhibit insulin hypersecretion, as characterized by a rapid rise in serum insulin during the first 30 min of an OGTT. In a pilot study,21 suppression of insulin secretion was achieved after 24 weeks of treatment with 40 mg of octreotide LAR and was associated with loss of body weight and fat mass in a subgroup of obese adults.
The design of this study is based on the hypothesis that some obese adults with insulin hypersecretion diagnosed via their CIRgp value during an OGTT would respond to insulin suppression using octreotide LAR by losing weight without behavioral intervention. We herein report the results of a randomized, double-blind, placebo-controlled, dose-finding clinical trial of octreotide LAR as a weight-reduction agent in obese adults with insulin hypersecretion.
Patients and methods
Patient population
This study was conducted in accordance with the Declaration of Helsinki22 and the International Conference on Harmonization (ICH) Guideline for Good Clinical Practice. 23 A total of 18 clinical research centers in the US contributed 1–18 patients each. At each center, the protocol was reviewed and approved by the local Ethics Committee and patients signed an informed consent document prior to participation.
To be included in this study, patients had to be 18–70 years of age, have at least moderate obesity (defined as BMI>30 kg/m2), and demonstrate insulin hypersecretion (defined as CIRgp≥) on a screening OGTT. Patients were excluded if they had diabetes mellitus; a history of cancer; hepatic disease; any neurological, orthopedic, or cardiac conditions that would have precluded normal physical activities; a history of gallstones without prior cholecystectomy; had undergone or were contemplating bariatric surgery; had lost or gained >5% of their current weight within the past 3 months or had lost >10% of their lifetime maximum weight in response to a caloric restriction and/or exercise regimen; were pregnant or lactating; had a known hypersensitivity to octreotide or related compounds, or had previously received octreotide. The following medications were not allowed during the study: chemotherapy or glucocorticoid therapy; insulin sensitizers (e.g. metformin, pioglitazone, or rosiglitazone); GH; antipsychotic medications; weight-loss pharmacotherapy; antidepressants; and antihypertensive or antiarrhythmic medications with autonomic activity (e.g. beta blockers).
Study design
Patients attended eight study visits. An initial screening OGTT and laboratory tests documented CIRgp>1.0, and excluded patients with asymptomatic diabetes mellitus, pregnancy, and renal or hepatic disease. Thereafter, patients attended a baseline visit at month 0 at which demographic information was collected and patients underwent a gallbladder ultrasound, dual-energy X-ray absorptiometry (DEXA) scan, and electrocardiogram. Patients received octreotide 100 μg s.c. to exclude drug hypersensitivity prior to randomization. Patients were randomized to one of four treatment arms. Under the double-blinded study design, patients received octreotide LAR (20, 40, or 60 mg) or placebo i.m. q. 28 days for 6 months. No dose adjustment was allowed during the study. Patients with intact gallbladders were instructed to take 300 mg ursodiol (Actigallρ; Watson) p.o. b.i.d. throughout the treatment period to prevent cholelithiasis once they started their first dose of study medication. Unused ursodiol tablets were collected and counted each month to ensure compliance. Patients returned for five monthly visits for weight checks and to receive study medication, and attended a final follow-up visit 30 days after the sixth dose of study medication (month 6) for repeat OGTT, gallbladder ultrasound, and measurement of safety parameters.
Adverse events and concomitant medications were monitored throughout the study. QoL was assessed using the Impact of Weight on Quality of Life-Lite™ (IWQoL-Lite) questionnaire.24 Patient-reported outcomes were assessed using the Beck Depression Inventory and the Carbohydrate Craving Questionnaire. DEXA scan was performed on patients less than 137 kg to document percentage body fat. Dietary analysis consisting of a 3-day retrospective food record was also performed at months 3 and 6.
Laboratory evaluations
Laboratory tests were performed by a central laboratory (CRL, Kansas City, MO, USA) at months 0, 3, and 6, and included a complete blood count, blood chemistries (including alkaline phosphatase, total bilirubin, aspartate aminotransferase (AST), alanine aminotransferase (ALT), electrolytes, BUN, creatinine, cholesterol, triglycerides, and glucose), urinalysis, plasma leptin, thyroid function tests (TSH and FT4), hemoglobin A1c (HbA1c), and a 3-h OGTT with simultaneous insulin levels.
Statistics
The data set for the analysis of safety data consisted of all patients who received at least one dose of study medication (safety population). The data set for the efficacy analysis consisted of all patients who received at least one dose of study medication and attended at least one post medication visit (efficacy-evaluable (EE) population). Discrete variables were summarized by frequencies and percentages. For analysis involving discrete variables, treatment groups were compared using Pearson's chi-square test. Continuous variables were summarized by mean, standard deviation, median, and range. For analysis of continuous variables, treatment groups were compared using one-way analysis of variance (ANOVA) with treatment group as the factor. All statistical tests were two-sided. P-values less than 0.05 were considered significant.
For the percent change from baseline in weight, missing data were imputed using the method of last-observation-carried-forward (LOCF). A repeated measures analysis with treatment group at each visit and center as fixed effect and patient as random effect was used to describe the data. A generalized estimating equation method was used for data analysis. Treatment groups were compared using contrasts in the model. The percent change from baseline was tested against zero by t-test. To identify the lowest effective dose, a step-down dose-finding procedure based on linear contrast was employed.25,26 For BMI, leptin, Beck Depression Inventory, carbohydrate craving, QoL, and waist-to-hip circumference, we used analysis of covariance (ANCOVA) with baseline measurement as a covariate and treatment group and center as factors and a baseline measurement by treatment group interaction term included in the model. For these variables, missing data were not imputed. QoL data were transformed prior to analysis according to the following formula:
The transformation inverts the score so that a declining transformed score reflects an improving QoL and an increasing transformed score reflects a worsening QoL.
Responders were defined as patients who demonstrated a weight loss ≥5% of their baseline weight. The proportion of responding patients in each treatment group was compared using logistic regression. Between-group comparisons for the percent change from baseline in the total body fat and abdominal fat at month 6, and the change from baseline in the percentage of carbohydrates, fat, and protein ingested were made using an ANOVA model with treatment group and center as factors and a treatment group by center interaction term. For these variables, missing data were not imputed.
In order to determine which racial and insulin secretion subgroup benefited most from octreotide LAR therapy, we performed post hoc analyses based on race (Caucasian, non-Caucasian) and CIR (high, low). High CIRgp was defined as CIRgp≥1.43, and the median and low CIRgp was defined as CIRgp<1.43. Analyses were performed for Caucasians with high CIRgp and Caucasians with low CIRgp. The same repeated measures model and the generalized estimation equation approach as described above were used for the analyses. Similar analyses were performed for non-Caucasians with high or low CIRgp.
Results
Patient disposition
Initial screening of 756 obese patients yielded 216 (28%) who exhibited a CIRgp≥1.0. Of these, 172 passed the other inclusion criteria. These 172 patients were randomized to one of the four treatment arms. There were 28 (16.3%) male and 144 (83.7%) female patients. All 172 enrolled patients were included in the safety analysis and 169 of them were included in the efficacy analysis. Three patients were excluded from efficacy analysis because they did not complete any postbaseline evaluations. Demographics and study disposition are presented in Tables 1 and 2. Patients were predominantly Caucasian (50%) or African American (45%). No statistically significant differences in age (mean 36–40 years) or number of patients (n = 42–44) were observed across the four treatment arms. The number of patients completing the study in each arm was 66% (placebo), 69% (octreotide LAR 20 mg), 81% (octreotide LAR 40 mg), and 77% (octreotide LAR 60 mg). The most common reasons for patients discontinuing the study included withdrawal of consent (11%), adverse event (6%), and loss to follow-up (6%). More patients in the placebo and 20 mg groups withdrew their consent (18 and 17%, respectively) than did patients in the 40 and 60 mg groups (5% each).
Table 1.
Demographic characteristics (safety population)
| Characteristic | Treatment group |
P-valuea | |||
|---|---|---|---|---|---|
| Placebo | Octreotide LAR 20 mg | Octreotide LAR 40 mg | Octreotide LAR 60 mg | ||
| N | 44 | 42 | 42 | 44 | |
| Mean age±s.d. (years) | 38.7±11.8 | 36.3±11.4 | 40.0±10.9 | 39.6±11.3 | |
| Mean CIRgp±s.d. | 1.83±0.99 | 1.90±1.01 | 1.51±0.60 | 1.60±0.61 | |
| Gender (n (%)) | |||||
| Male | 9 (20.5) | 5 (11.9) | 9 (21.4) | 5 (11.4) | |
| Female | 35 (79.5) | 37 (88.1) | 33 (78.6) | 39 (88.6) | |
| Race (n (%)) | |||||
| Caucasian | 28 (63.6) | 23 (54.8) | 15 (35.7) | 20 (45.5) | |
| African American | 15 (34.1) | 17 (40.5) | 26 (61.9) | 20 (45.5) | |
| Asian | 0 (0.0) | 0 (0.0) | 1 (2.4) | 0 (0.0) | |
| Other | 1 (2.3) | 2 (4.8) | 0 (0.0) | 4 (9.1) | |
| Mean weightb±s.d. (kg) | 107.22±24.00 | 113.73±26.26 | 114.72±23.83 | 107.27±18.90 | 0.2894 |
| Mean BMIb±s.d. (kg/m2) | 38.56±5.55 | 40.51±7.41 | 40.64±7.07 | 39.48±6.02 | 0.4710 |
s.d. = standard deviation.
P-value for baseline comparison based on ANOVA.
Based on efficacy-evaluable population.
Table 2.
Patient disposition (n (%))
| Category | Treatment group |
||||
|---|---|---|---|---|---|
| Placebo | Octreotide LAR 20 mg | Octreotide LAR 40 mg | Octreotide LAR 60 mg | Total | |
| Randomized | 44 (100.0) | 42 (100.0) | 42 (100.0) | 44 (100.0) | 172 (100.0) |
| Safety population | 44 (100.0) | 42 (100.0) | 42 (100.0) | 44 (100.0) | 172 (100.0) |
| EE population | 44 (100.0) | 41 (97.6) | 40 (95.2) | 44 (100.0) | 169 (98.2) |
| Completed study | 29 (65.9) | 29 (69.0) | 34 (81.0) | 34 (77.3) | 126 (73.3) |
| Discontinued study | 15 (34.1) | 13 (31.0) | 8 (19.0) | 10 (22.7) | 46 (26.7) |
| Reason for discontinuation | |||||
| Adverse event | 3 (6.8) | 2 (4.8) | 4 (9.5) | 2 (4.5) | 11 (6.4) |
| Withdrew consent | 8 (18.2) | 7 (16.7) | 2 (4.8) | 2 (4.5) | 19 (11.0) |
| Lost to follow-up | 1 (2.3) | 4 (9.5) | 1 (2.4) | 4 (9.1) | 10 (5.8) |
| Protocol violation | 2 (4.5) | 0 (0.0) | 1 (2.4) | 1 (2.3) | 4 (2.3) |
| Abnormal laboratory value | 1 (2.3) | 0 (0.0) | 0 (0.0) | 0 (0.0) | 1 (0.6) |
| Unsatisfactory therapeutic effect | 0 (0.0) | 0 (0.0) | 0 (0.0) | 1 (2.3) | 1 (0.6) |
EE = efficacy-evaluable.
Extent of exposure
The distribution of patients by number of doses of study drug received is presented in Table 3. The mean number of doses of study medication was similar across the treatment groups (mean 5.0–5.4). No patients missed their scheduled dose of study medication.
Table 3.
Distribution of patients (n (%)) by number of doses of study drug (safety population)
| Exposure | Treatment group |
|||
|---|---|---|---|---|
| Placebo | Octreotide LAR 20 mg | Octreotide LAR 40 mg | Octreotide LAR 60 mg | |
| Number of doses | ||||
| 1 | 44 (100.0) | 42 (100.0) | 42 (100.0) | 44 (100.0) |
| 2 | 43 (97.7) | 41 (97.6) | 40 (95.2) | 43 (97.7) |
| 3 | 41 (93.2) | 36 (85.7) | 38 (90.5) | 39 (88.6) |
| 4 | 34 (77.3) | 31 (73.8) | 37 (88.1) | 37 (84.1) |
| 5 | 31 (70.5) | 30 (71.4) | 35 (83.3) | 36 (81.8) |
| 6 | 30 (68.2) | 29 (69.0) | 35 (83.3) | 35 (79.5) |
| Mean±s.d. | 5.1±1.5 | 5.0±1.6 | 5.4±1.4 | 5.3±1.5 |
s.d. = standard deviation.
Drug efficacy
Changes in weight and BMI
The results for weight and BMI are presented in Tables 4a and b. There were no statistically significant differences in weight or BMI between the treatment groups at baseline. Patients receiving octreotide LAR 40 or 60 mg experienced statistically significant within-group mean percent decreases in weight at month 6 compared to month 0 (Table 4a). The between-group differences in mean percent weight change at month 6 were also statistically significant (P = 0.042, ANOVA). The difference in mean percent change in body weight between the 40 mg treatment arm and the placebo group was −1.98% and the difference between the 60 mg treatment arm and the placebo group was −1.87%. According to the linear contrast model, 40 mg of octreotide LAR was the lowest dose at which a statistically significant difference from placebo was observed.
Table 4.
Mean percent change from baseline in body weight at month 6 (efficacy-evaluable population) and mean change from baseline in BMI (kg/m2) at month 6 (efficacy-evaluable population)
| (a) Mean percent change from baseline in body weight at month 6 (efficacy-evaluable population) | |||||
|---|---|---|---|---|---|
| Statistic | Treatment group |
Treatment group comparison P-valuea | |||
| Placebo | Octreotide LAR 20 mg | Octreotide LAR 40 mg | Octreotide LAR 60 mg | ||
| Nb | 44 | 41 | 40 | 44 | |
| Mean percent change from baseline±s.d. | 0.09±3.21 | −0.96±3.32 | −1.89±3.31 | −1.79±3.92 | 0.0418 |
| P-valuec | 0.8496 | 0.0721 | 0.0009 | 0.0042 | |
| Difference from placebod | −1.03 | −1.98 | −1.87 | ||
| P-valuee | ND | 0.0097 | 0.0057 | ||
| (b) mean change from baseline in BMI (kg/m2) at month 6 (efficacy-evaluable population) | |||||
| Statistic | Treatment group |
Treatment group comparison P-valuef | |||
| Placebo | Octreotide LAR 20 mg | Octreotide LAR 40 mg | Octreotide LAR 60 mg | ||
| Ng | 29 | 29 | 34 | 34 | |
| Mean change from baseline±s.d. | 0.33±0.96 | −0.50±1.43 | −0.73±1.42 | −0.79±1.55 | 0.0517 |
| P-valueh | 0.0730 | 0.0690 | 0.0052 | 0.0054 | |
| Difference from placeboi | −0.50 | −0.83 | −0.89 | ||
ND = not done, s.d. = standard deviation.
P-value for between-group percent change from baseline based on ANOVA.
Missing data imputed using LOCF method.
P-value for within-group percent change from baseline based on t-test.
Octreotide LAR mean–placebo mean (adjusted mean percent change from baseline based on ANOVA).
P-value for difference from placebo based on linear contrasts model.
P-value for between-group change from baseline based on ANOVA.
Observed values.
P-value for within-group change from baseline based on t-test.
Octreotide LAR mean–placebo mean (adjusted mean change from baseline based on ANOVA).
Patients receiving 40 or 60 mg of octreotide LAR experienced a statistically significant mean decrease in BMI from baseline at month 6 (Table 4b). The mean change from baseline was negative in all three of the octreotide-treated groups. Comparison of the four treatment groups showed a trend indicating weight loss in the octreotide LAR groups (P = 0.052).
Frequency of responders
Responders were defined as patients who lost ≥5% of their baseline body weight during the study. By this definition, five (11.4%) patients in the placebo group, three (7.3%) patients in the octreotide LAR 20 mg group, five (12.5%) patients in the 40 mg group, and nine (20.5%) patients in the 60 mg group responded to the study medication. According to the logistic regression analysis, the between-group differences in the frequency of responders were not statistically significant.
Post hoc analysis of the role of race and CIRgp in predicting response
A pilot study21 indicated that most responders were Caucasian and that the degree of insulin secretion correlated with the weight-loss response. More recently, Preeyasombat et al.27 performed 3-h OGTTs in 113 non-diabetic obese children and found that Caucasian children exhibited lower CIRgp than African-Americans. We therefore performed a post hoc analysis of response based on race and CIRgp in this study. As shown in Table 5, Caucasians experienced statistically significant weight loss at month 6 (P = 0.0284, ANOVA), whereas non-Caucasians did not. Table 6 presents the results for the subgroups of patients within each racial group who had CIRgp greater than or equal to the median of the cohort (1.43) or less than the median. Both CIRgp subgroups of Caucasians had significant changes in weight at month 6, while similar subgroups of non-Caucasians did not. A dose–response relationship was explored by using the step-down procedures. This statistical model showed that the dose–response relationship was significant for the 60 mg octreotide LAR group (P = 0.046) for Caucasians with CIRgp≥1.43 and also for all three octreotide LAR dose groups for Caucasians with CIRgp<1.43 (P≤0.0278).
Table 5.
Post hoc analysis – mean percent change from baseline in body weight at month 6 by race (efficacy-evaluable population)
| Race/statistic | Treatment group |
Treatment group comparison P-valuea | |||
|---|---|---|---|---|---|
| Placebo | Octreotide LAR 20 mg | Octreotide LAR 40 mg | Octreotide LAR 60 mg | ||
| Caucasians | |||||
| N | 28 | 23 | 14 | 20 | |
| Mean percent change from baseline±s.d. | 0.27±2.61 | −1.53±3.86 | −1.92±2.94 | −2.60±3.45 | 0.0284 |
| P-valueb | 0.5895 | 0.0700 | 0.0291 | 0.0033 | |
| 95% CIc | −0.7, 1.3 | −3.2, 0.1 | −3.6, −0.2 | −4.2, −1.0 | |
| Mean difference from placebod | −1.83 | −2.54 | −2.96 | ||
| 95% CIe | −3.7, 0.0 | −4.7, −0.4 | −4.9, −1.0 | ||
| P-valuef | 0.0550 | 0.0226 | 0.0030 | ||
| Non-Caucasians | |||||
| N | 16 | 18 | 26 | 24 | |
| Mean percent change from baseline±s.d. | −0.22±4.14 | −0.23±2.39 | −1.87±3.55 | −1.11±4.22 | 0.2749 |
| P-valueb | 0.8364 | 0.6934 | 0.0125 | 0.2100 | |
| 95% CIc | −2.4, 2.0 | −1.4, 1.0 | −3.3, −0.4 | −2.9, 0.7 | |
| Mean difference from placebof | 0.06 | −1.74 | −0.89 | ||
| 95% CIe | −2.4, 2.6 | −4.1, 0.6 | −3.2, 1.5 | ||
| P-valuef | 0.9622 | 0.1394 | 0.2321 | ||
s.d. = standard deviation.
P-value for between-group differences in mean percent change from baseline based on ANOVA.
P-value for within-group difference in mean percent change from baseline based on t-test.
Confidence interval for differences in within-group mean percent change from baseline.
Octreotide LAR mean–placebo mean (adjusted mean percent change from baseline based on ANOVA).
Confidence interval for difference between octreotide LAR treatment group and placebo for percentage change from baseline based on the adjusted means from the ANOVA.
P-value for difference from placebo based on linear contrasts model.
Table 6.
Adjusted mean percent change from baseline in body weight at month 6 by race and CIRgp (efficacy-evaluable population)
| Subgroup | Treatment group |
Overall treatment P-valuea | Placebo, 20, 40, and 60 mg, dose-response P-valueb | Placebo, 20 and 40 mg dose-response P-valueb | Placebo and 20 mg dose-response P-value | |||
|---|---|---|---|---|---|---|---|---|
| Placebo | Octreotide LAR 20 mg | Octreotide LAR 40 mg | Octreotide LAR 60 mg | |||||
| Caucasians, CIRgp≥1.43 | ||||||||
| N | 11 | 9 | 4 | 9 | ||||
| Mean percent changec | −0.27 | −1.11 | −3.54 | −3.79 | 0.1419 | 0.0461 | 0.2117 | 0.6490 |
| Range (min, max) | (−6.5, 2.6) | (−14.8, 4.6) | (−2.4, −0.1) | (−12.5, 0.0) | ||||
| Caucasians, CIRgp<1.43 | ||||||||
| N | 17 | 14 | 10 | 11 | ||||
| Mean percent changec | 0.85 | −1.72 | −2.33 | −1.52 | 0.0207 | 0.0278 | 0.0065 | 0.0142 |
| Range (min, max) | (−5.7, 3.5) | (−4.9, 1.6) | (−11.1, 1.9) | (−8.1, 1.2) | ||||
| Non-Caucasians, CIRgp≥1.43 | ||||||||
| N | 10 | 15 | 16 | 12 | ||||
| Mean percent changec | −0.74 | 0.12 | −2.48 | −0.62 | 0.2915 | 0.6261 | 0.2185 | 0.5444 |
| Range (min, max) | (−9.1, 4.2) | (−5.1, 4.2) | (−14.6, 1.7) | (−8.0, 3.3) | ||||
| Non-Caucasians, CIRgp<1.43 | ||||||||
| N | 6 | 3 | 10 | 12 | ||||
| Mean percent changec | 0.96 | −0.42 | −1.38 | −2.03 | 0.3996 | 0.1862 | 0.3180 | 0.6668 |
| Range (min, max) | (−5.0, 5.0) | (−2.3, 1.1) | (−5.4, 3.9) | (−13.0, 7.3) | ||||
P-value from ANOVA.
P-value from step-down procedure.
Adjusted mean based on the least squares mean from the ANOVA.
Impact of weight change on quality of life (IWQoL)
Results for the IWQoL (total score) at month 6 are presented in Table 7. There was a statistically significant mean change from baseline in QoL total score in the octreotide LAR 40 mg group at month 6 but the differences were not statistically significant among the treatment groups. The difference in mean change from baseline between the 40 mg group and placebo was −8.06.
Table 7.
Mean change from baseline in QoL total scorea at month 6 (efficacy-evaluable population)
| Statistic | Treatment group |
P-valueb | |||
|---|---|---|---|---|---|
| Placebo | Octreotide LAR 20 mg | Octreotide LAR 40 mg | Octreotide LAR 60 mg | ||
| Nc | 29 | 27 | 34 | 33 | |
| Mean change from baseline±s.d. | −3.45±10.92 | −4.74±13.89 | −11.12±10.49 | −4.94±19.02 | 0.0874 |
| P-valued | 0.1000 | 0.0878 | <0.0001 | 0.1456 | |
| 95% CIe | −7.6, 0.7 | −10.2, 0.8 | −14.8, -7.5 | −11.7, 1.8 | |
| Difference from placebof | −0.80 | −8.06 | −2.15 | ||
| 95% CIg | −8.2, 6.6 | −15.0, −1.1 | −9.1, 4.8 | ||
QoL = quality of life, s.d. = standard deviation.
Transformed IWQoL score.
P-value for between-group differences in the change from baseline based on ANCOVA.
Observed values.
P-value for within-treatment group change from baseline based on t-test.
Confidence interval for within-treatment group change from baseline.
Octreotide LAR mean–placebo mean (adjusted mean change from baseline based on ANOVA).
Confidence interval for difference in the change from baseline between octreotide LAR treatment group and placebo.
Results for the QoL subscores at month 6 are summarized in Table 8. Statistically significant changes from baseline in the mean score were observed for the QoL subscore categories of physical function (octreotide LAR 40 mg), Self-Esteem (octreotide LAR 20 and 40 mg), and for sexual life, public distress, and work (each for octreotide LAR 40 mg) but the only category to display a statistically significant difference among the treatment groups at month 6 was sexual life. There were not enough responders to analyze the QoL subscores by responder status.
Table 8.
Effect of weight loss on QoL subscoresa at month 6 (efficacy-evaluable population)
| Parameter/statistic | Treatment group |
P-valueb | |||
|---|---|---|---|---|---|
| Placebo | Octreotide LAR 20 mg | Octreotide LAR 40 mg | Octreotide LAR 60 mg | ||
| Nc | 29 | 27 | 34 | 33 | |
| Physical function | |||||
| Mean change from baseline±s.d. | −4.14±14.91 | −4.89±15.94 | −10.91±12.05 | −3.73±19.72 | 0.3125 |
| P-valued | 0.1462 | 0.1230 | <0.0001 | 0.2857 | |
| Self-esteem | |||||
| Mean change from baseline±s.d. | −6.38±−19.14 | −10.74±−19.50 | −12.53±−15.41 | −8.42±−28.44 | 0.4994 |
| P-valued | 0.0834 | 0.0082 | <0.0001 | 0.0985 | |
| Sexual life | |||||
| Mean change from baseline±s.d. | 5.45±18.81 | −0.46±24.75 | −12.38±24.68 | −8.79±25.18 | 0.0180 |
| P-valued | 0.1300 | 0.9250 | 0.0062 | 0.0535 | |
| Public distress | |||||
| Mean change from baseline±s.d. | −3.79±10.91 | 0.00±18.55 | −7.94±12.56 | −2.73±18.20 | 0.1543 |
| P-valued | 0.0716 | 1.0000 | 0.0008 | 0.3958 | |
| Work | |||||
| Mean change from baseline±s.d. | −3.86±15.88 | −4.48±29.11 | −12.38±16.43 | −1.12±26.21 | 0.2072 |
| P-valued | 0.2010 | 0.4310 | 0.0001 | 0.8075 | |
QoL = quality of life, s.d. = standard deviation.
Transformed IWQoL subscore.
P-value for between-group differences in the change from baseline based on ANCOVA.
Observed data.
P-value for within-treatment group change from baseline based on t-test.
Effects on appetite, nutrition, body composition, and depression
Carbohydrate craving was reduced in all three octreotide LAR-treated groups compared to baseline and the between-group mean changes were statistically significant compared to placebo at month 6 (data not shown). Despite this, there were no consistent statistically significant within-group or between-group differences in the percent of calories from protein, fat, or carbohydrate in any treatment group (data not shown).
There were no significant changes in the amount of total body or abdominal fat, leptin concentration, or Beck Depression Total Inventory score (data not shown).
Safety
Effect on glycemia during OGTT
Patients underwent a 3-h OGTT at the screening visit and at months 3 and 6. The results for month 6 are presented in Table 9. Compared to the values obtained at screening, the mean peak blood glucose concentrations after oral glucose challenge were significantly elevated in patients receiving octreotide LAR. The mean change from baseline in glucose AUC0–180 min at month 6 in the three octreotide LAR-treated groups was 39–40 mg/dl h higher than placebo and the difference between the groups was statistically significant (P = 0.0028).
Table 9.
Mean actual (mg/dl h) and change from baseline in OGTT (glucose AUC0-180 min) at month 6 (efficacy-evaluable population)
| Parameter | Treatment group |
Treatment group comparison P-valuea | |||
|---|---|---|---|---|---|
| Placebo | Octreotide LAR 20 mg | Octreotide LAR 40 mg | Octreotide LAR 60 mg | ||
| Nb | 27 | 27 | 33 | 31 | |
| Mean actual AUC0-180 min±s.d. | 66.09±65.78 | 103.57±54.50 | 103.65±67.86 | 89.90±56.02 | |
| Mean change from baseline±s.d. | 6.07±46.02 | 39.87±41.44 | 42.05±57.51 | 39.00±42.13 | 0.0028 |
| P-valuec | 0.4994 | <0.0001 | 0.0002 | <0.0001 | |
| Difference from placebod | 40.15 | 39.06 | 38.64 | ||
OGTT = oral glucose tolerance test, s.d. = standard deviation.
P-value for between-group change from baseline based on ANCOVA.
Observed values.
P-value for within-group change from baseline based on t-test.
Octreotide LAR mean–placebo mean (adjusted mean change from baseline based on ANCOVA).
At month 6, small statistically significant mean changes from baseline were seen in HbA1c levels for all octreotide LAR-treated groups (mean change 0.17–0.23%). Five octreotide LAR-treated patients had elevated (i.e., >7%) HbA1c levels during treatment; all values were <10% and none were associated with adverse events.
Adverse events and complications
There were no deaths during the study. The most common adverse events (i.e., affecting ≥10% of any treatment group) are presented in Table 10.
Table 10.
Number (%) of patients reporting the most commona adverse events (safety population)
| Event | Treatment group |
|||
|---|---|---|---|---|
| Placebo (N = 44) | Octreotide LAR 20 mg (N = 42) | Octreotide LAR 40 mg (N = 42) | Octreotide LAR 60 mg (N = 44) | |
| Diarrhea | 8 (18.2) | 15 (35.7) | 12 (28.6) | 13 (29.5) |
| Headache | 7 (15.9) | 4 (9.5) | 9 (21.4) | 4 (9.1) |
| Cholelithiasis | 3 (6.8) | 5 (11.9) | 4 (9.5) | 8 (18.2) |
| Nausea | 8 (18.2) | 6 (14.3) | 2 (4.8) | 4 (9.1) |
| Abdominal pain | 5 (11.4) | 2 (4.8) | 6 (14.3) | 6 (13.6) |
| Flatulence | 4 (9.1) | 3 (7.1) | 4 (9.5) | 5 (11.4) |
| Injection site pain | 5 (11.4) | 4 (9.5) | 3 (7.1) | 4 (9.1) |
| Loose stools | 5 (11.4) | 1 (2.4) | 5 (11.9) | 5 (11.4) |
| Fatigue | 6 (13.6) | 4 (9.5) | 2 (4.8) | 2 (4.5) |
| Nasopharyngitis | 4 (9.1) | 4 (9.5) | 1 (2.4) | 5 (11.4) |
| Pharyngitis | 2 (4.5) | 5 (11.9) | 3 (7.1) | 1 (2.3) |
| Cough | 1 (2.3) | 2 (4.8) | 5 (11.9) | 2 (4.5) |
Affecting ≥10% of patients in any treatment group, listed by decreasing frequency across all treatment groups combined.
Most adverse events were gastrointestinal in nature. Only two adverse events, diarrhea and cholelithiasis, appeared to be more common in octreotide LAR-treated groups than the placebo group, while nausea and fatigue appeared to be more common in the placebo group (Table 10). There were 15 cases (35.7%) of diarrhea in the octreotide LAR 20 mg group, 12 cases (28.6%) in the octreotide LAR 40 mg group, and 13 cases (29.5%) in the octreotide LAR 60 mg group, compared to eight cases (18.2%) in the placebo group. Cholelithiasis appeared to be somewhat dose dependent, being observed in three (6.8%) patients in the placebo group, five (11.9%) patients in the octreotide LAR 20 mg group, four (9.5%) patients in the octreotide LAR 40 mg group, and eight (18.2%) patients in the octreotide LAR 60 mg group. All other adverse events occurred with similar frequency across all treatment groups.
A total of 11 patients experienced adverse events resulting in discontinuation of treatment including three (6.8%) patients in the placebo group (one patient with cholelithiasis, one patient with disturbance in attention, and one patient with injection site pain and hypertrophy), two (4.8%) patients in the 20 mg group (one patient with diarrhea and one patient with depression), four (9.5%) patients in the 40 mg group (two patients with diarrhea, one patient with pregnancy, and one patient with cholangiectasis), and two (4.5%) patients in the 60 mg group (one patient with abdominal pain and one patient with diarrhea, fatigue, nausea, and vomiting).
Of the 20 patients who experienced adverse events of cholelithiasis, in only two cases were the events reported as serious, one of which resulted in a cholecystectomy (octreotide LAR 60 mg group).
Local injection site reactions to octreotide LAR, such as local pain, swelling, or rash, were rare and were usually mild and of short duration. The only local adverse event to occur in more than 10% of patients in any treatment group was injection site pain, which was observed in five patients in the placebo group, four patients in the octreotide LAR 20 mg group, three patients in the octreotide LAR 40 mg group, and four patients in the octreotide LAR 60 mg group. Only two of these events were considered severe (placebo and octreotide LAR 20 mg groups).
Discussion
Obese patients receiving octreotide LAR i.m. on a monthly basis for 6 months lost weight compared to placebo. The mean weight loss across the entire cohort ranged from −1.03 to −1.98% of the baseline weight (i.e., 1–2 kg) depending on the dose. The lowest dose of octreotide LAR associated with statistically significant weight loss was 40 mg. The weight loss observed in this study was less than that seen in a pilot, open-label study,21 in which subjects with insulin hypersecretion (high CIRgp) lost up to 10% of their initial body weight in 6 months. Unfortuntately, the sample sizes in this current study are too small to draw meaningful conclusions with respect to race by CIRgp subgroup analyses. Since the current study focused on patients with a baseline CIRgp of >1.0, future studies might target patients with a higher range of baseline CIRgp. Also, since the weight loss observed in this study was progressive out to 6 months of treatment, future studies might also continue for longer than 6 months (Figure 1).
Figure 1.
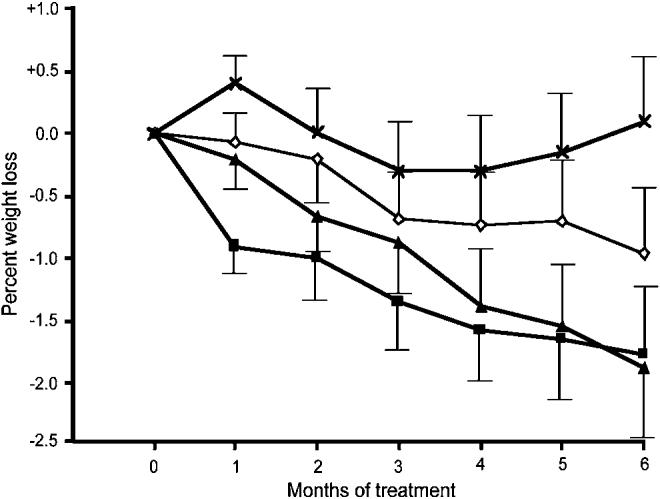
Monthly change from baseline (±s.e.m.) in percent weight as a function of dose of octreotide LAR over 6 months (X's denote placebo, diamonds denote 20 mg i.m. q. month, triangles denote 40 mg i.m. q. month, and squares denote 60 mg i.m. q. month).
Caucasian patients with higher CIRgp responded better to insulin suppression than Caucasians with lower CIRgp, or non-Caucasians. This finding is similar to the pilot study21 in which octreotide appeared to act by suppressing insulin secretion; those with insulin hypersecretion exhibited a greater weight reduction in response to therapy. Although the reason for the racial dichotomy is not known, we propose several hypotheses. African Americans exhibit markedly increased levels of GLP-1 compared to Caucasians.28 GLP-1 is a potent insulinotropic peptide. It binds to GLP-1 receptors on the β-cell membrane to activate adenyl cyclase; the resultant intracellular cAMP activates protein kinase A, which liberates calcium from the endoplasmic reticulum (in which it was sequestered), which promotes insulin exocytosis.29 This pathway is unresponsive to suppression of the voltage-gated calcium channel by octreotide, and could account for the relative lack of effect of octreotide in African Americans.30 Alternatively, African Americans exhibit reduced hepatic insulin clearance;31,32 thus, insulin levels drop only marginally in response to insulin suppression,21 which could abrogate octreotide's effect on hyperinsulinemia. Lastly, obese African Americans have been shown to possess greater subcutaneous and less visceral fat than their Caucasian counterparts matched for BMI.33 Perhaps insulin suppression has a dichotomous effect on these two fat compartments.
Previous studies in pediatric hypothalamic obesity demonstrated improved QoL and a correlation between improvement in QoL and the degree of insulin suppression.20 In the present study, we also observed statistically significant improvement in QoL as measured by the IWQoL-Lite in the octreotide LAR 40 mg group. The 60 mg group also exhibited some improvement but this was not statistically significant.
Mean HbA1c levels in patients receiving octreotide LAR rose by 0.2% and were independent of dose while they were essentially unchanged in the placebo group.
The incidences of common adverse events (i.e., diarrhea, headache, cholelithiasis, nausea, and abdominal pain) were similar to those previously reported in patients taking octreotide LAR.34 A total of 11 patients discontinued the study due to adverse events but the numbers of such events in each of the treated groups were similar to placebo. In previous studies, gallstones have been reported in 15–30% of long-term recipients of octreotide LAR.35 The incidence of gallstones in patients taking octreotide LAR was 10–18%, compared to an incidence of 7% in the placebo group, and appeared to be dose dependent. The incidence of cholelithiasis in the present study was lower than in the previous studies, possibly because patients were screened for gallstones prior to study entry and took prophylactic Actigall® during the study.
Obesity is a syndrome with multiple causes. This study was designed to specifically evaluate the effect of insulin suppression in a subset of obese patients with insulin hypersecretion. The results show that patients who were treated with octreotide LAR experienced a slow and progressive weight loss and improved QoL. A cost–benefit analysis of the rationale for such therapy is premature; however, the results of this study argue that suppression of the β-cell is a potential target of obesity pharmacotherapy. Longer-term studies in this target population will be required to determine whether insulin-suppressing therapy with octreotide LAR will provide an effective treatment for pediatric and adult obesity due to insulin hypersecretion.
References
- 1.Mokdad AH, Ford ES, Bowman BA, Dietz WH, Vinicor F, Bales VS, et al. Prevalence of obesity, diabetes, and obesity-related health risk factors, 2001. JAMA. 2003;289:76–79. doi: 10.1001/jama.289.1.76. [DOI] [PubMed] [Google Scholar]
- 2.Bray GA. Health hazards of obesity. Endocrinol Metab Clin NA. 1996;25:907–919. doi: 10.1016/s0889-8529(05)70361-3. [DOI] [PubMed] [Google Scholar]
- 3.Calle EE, Thun MJ, Petrelli JM, Rodriguez C, Heath CW., Jr Body-mass index and mortality in a prospective cohort of US adults. N Engl J Med. 1999;341:1097–1105. doi: 10.1056/NEJM199910073411501. [DOI] [PubMed] [Google Scholar]
- 4.Kopelman PG. Obesity as a medical problem. Nature. 2000;404:635–643. doi: 10.1038/35007508. [DOI] [PubMed] [Google Scholar]
- 5.Myers A, Rosen JC. Obesity stigmatization and coping: relation to mental health symptoms, body image, and self-esteem. Int J Obes Relat Metab Disord. 1999;23:221–230. doi: 10.1038/sj.ijo.0800765. [DOI] [PubMed] [Google Scholar]
- 6.Bray GA, Gray DS. Treatment of obesity: an overview. Diab Metab Rev. 1998;4:653–679. doi: 10.1002/dmr.5610040704. [DOI] [PubMed] [Google Scholar]
- 7.Bray GA, Greenway FL. Current and potential drugs for treatment of obesity. Endocr Rev. 1999;20:805–875. doi: 10.1210/edrv.20.6.0383. [DOI] [PubMed] [Google Scholar]
- 8.Consensus development conference panel, NIH Conference. Gastrointestinal surgery for severe obesity. Ann Int Med. 1991;115:956–961. [PubMed] [Google Scholar]
- 9.Lustig RH. The neuroendocrinology of obesity. Endocrinol Metab Clin NA. 2001;30:765–785. doi: 10.1016/s0889-8529(05)70211-5. [DOI] [PubMed] [Google Scholar]
- 10.Sigal RJ, El-Hashimy M, Martin BC. Acute post-challenge hyperinsulinemia predicts weight gain. Diabetes. 1997;46:1025–1029. doi: 10.2337/diab.46.6.1025. [DOI] [PubMed] [Google Scholar]
- 11.Meistas MT, Margolis S, Kowarski AA. Hyperinsulinemia of obesity is due to decreased clearance of insulin. Am J Physiol. 1983;245:E155–E159. doi: 10.1152/ajpendo.1983.245.2.E155. [DOI] [PubMed] [Google Scholar]
- 12.Ferrannini E, Natali A, Bell P, Cavallo-Perin P, Lalic N, Mingrone G. Insulin resistance and hypersecretion in obesity. European group for the study of insulin resistance (EGIR) J Clin Invest. 1997;100:1166–1173. doi: 10.1172/JCI119628. [DOI] [PMC free article] [PubMed] [Google Scholar]
- 13.Lustig RH. Hypothalamic obesity: the sixth cranial endocrinopathy. Endocrinologist. 2002;12:210–217. [Google Scholar]
- 14.Gilon P, Henquin JC. Mechanisms and physiological significance of the cholinergic control of pancreatic β-cell function. Endocrine Rev. 2001;22:565–604. doi: 10.1210/edrv.22.5.0440. [DOI] [PubMed] [Google Scholar]
- 15.Sluiter WJ, Erkelens DW, Terpstra P, Reitsma WD, Doorenbos H. Glucose intolerance and insulin release, a mathematical approach. 1. Assay of the beta cell response after glucose loading. Diabetes. 1976;25:241–244. doi: 10.2337/diab.25.4.241. [DOI] [PubMed] [Google Scholar]
- 16.Lamberts SW, van der Lely AJ, de Herder WW, Hofland LJ. Drug therapy: octreotide. N Engl J Med. 1996;334:246–254. doi: 10.1056/NEJM199601253340408. [DOI] [PubMed] [Google Scholar]
- 17.Krentz AJ, MacDonald LM, Schade DS. Octreotide: a long-acting inhibitor of endogenous hormone secretion for human metabolic investigations. Metabolism. 1994;43:24–31. doi: 10.1016/0026-0495(94)90153-8. [DOI] [PubMed] [Google Scholar]
- 18.Haqq AM, Stadler DD, Rosenfeld RG, Pratt KL, Weigle DS, Frayo FS, et al. Circulating ghrelin levels are suppressed by meals and octreotide therapy in children in Prader–Willi syndrome. J Clin Endocrinol Metab. 2003;88:3573–3576. doi: 10.1210/jc.2003-030205. [DOI] [PubMed] [Google Scholar]
- 19.Lustig RH, Rose SR, Burghen GA, Velasquez-Mieyer P, Broome DC, Smith K, et al. Hypothalamic obesity in children caused by cranial insult: altered glucose and insulin dynamics, and reversal by a somatostatin agonist. J Pediatr. 1999;135:162–168. doi: 10.1016/s0022-3476(99)70017-x. [DOI] [PubMed] [Google Scholar]
- 20.Lustig RH, Hinds PS, Ringwald-Smith K, Christensen RK, Kaste SC, Schreiber RE, et al. Octreotide therapy of pediatric hypothalamic obesity: a double-blind, placebo-controlled trial. J Clin Endocrinol Metab. 2003;88:2586–2592. doi: 10.1210/jc.2002-030003. [DOI] [PubMed] [Google Scholar]
- 21.Velasquez-Mieyer PA, Cowan PA, Arheart KL, Buffington CK, Spencer KA, Connelly BE, et al. Suppression of insulin secretion promotes weight loss and alters macronutrient preference in a subset of obese adults. Int J Obes Relat Metab Disord. 2003;27:219–226. doi: 10.1038/sj.ijo.802227. [DOI] [PMC free article] [PubMed] [Google Scholar]
- 22.Declaration of Helsinki. Recommendation guiding medical physicians in biomedical research involving human subjects. 1996 October; Republic of South Africa Revision. [Google Scholar]
- 23.International Conference on Harmonization (ICH); 1996. Guideline for good clinical practice. As part of the ICH Harmonized Tripartite Guideline (European Union, Japan, and USA). ICH Harmonized Tripartite Guideline. [Google Scholar]
- 24.Kolotkin RL, Crosby RD, Kosloski KD, Williams GR. Development of a brief measure to assess quality of life in obesity. Obes Res. 2001;9:102–111. doi: 10.1038/oby.2001.13. [DOI] [PubMed] [Google Scholar]
- 25.Rom DM, Costello RJ, Connell LT. On closed test procedures for dose–response analysis. Stat Med. 1994;13:1583–1596. doi: 10.1002/sim.4780131509. [DOI] [PubMed] [Google Scholar]
- 26.Tukey JW, Ciminera JL, Heyse JP. Testing the statistical certainty of a response with increasing doses of a compound. Biometrics. 1985;41:295–301. [PubMed] [Google Scholar]
- 27.Preeyasombat C, Bacchetti P, Lazar AA, Lustig RH. Racial and etiopathologic dichotomies in insulin hypersecretion and resistance in obese children. J Pediatr. 2005;146:474–481. doi: 10.1016/j.jpeds.2004.12.014. [DOI] [PubMed] [Google Scholar]
- 28.Velasquez-Mieyer PA, Cowan PA, Umpierrez GE, Lustig RH, Cashion AK, Burghen GA. Racial differences in glucagon-like peptide-1 (GLP-1) concentrations and insulin dynamics during oral glucose tolerance testing in obese subjects. Int J Obes Relat Metab Disord. 2003;27:1359–1364. doi: 10.1038/sj.ijo.0802415. [DOI] [PMC free article] [PubMed] [Google Scholar]
- 29.Lustig RH. Autonomic dysfunction of the β-cell and the pathogenesis of obesity. Rev Endocrinol Metab Dis. 2003;4:23–32. doi: 10.1023/a:1021819318484. [DOI] [PubMed] [Google Scholar]
- 30.Velasquez-Mieyer PA, Umpierrez GE, Lustig RH, Cashion AK, Cowan PA, Christensen M, et al. Race affects insulin and GLP-1 secretion and response to a long-acting somatostatin analogue in obese adults. Int J Obes Relat Metab Disord. 2004;28:1–4. doi: 10.1038/sj.ijo.0802561. [DOI] [PMC free article] [PubMed] [Google Scholar]
- 31.Gower BA, Granger WM, Franklin F, Shewchuk RM, Goran MI. Contribution of insulin secretion and clearance to glucose-induced insulin concentration in African-American and Caucasian children. J Clin Endocrinol Metab. 2002;87:2218–2224. doi: 10.1210/jcem.87.5.8498. [DOI] [PubMed] [Google Scholar]
- 32.Jiang Z, Srinivasan SR, Radkakrishnamurthy B, Dalferes ER, Berenson GS. Racial (black–white) differences in insulin secretion and clearance in adolescents: the Bogalusa Heart Study. Pediatrics. 1996;97:357–360. [PubMed] [Google Scholar]
- 33.Yanovski JA, Yanovski SZ, Filmer KM, Hubbard VS, Avila N, Lewis B, et al. Differences in body composition of black and white girls. Am J Clin Nutr. 1996;64:833–839. doi: 10.1093/ajcn/64.6.833. [DOI] [PubMed] [Google Scholar]
- 34.Ezzat S, Snyder PJ, Young WF, Boyajy LD, Newman C, Klibanski A, et al. Octreotide treatment of acromegaly. A randomized, multicenter study. Ann Int Med. 1992;117:711–718. doi: 10.7326/0003-4819-117-9-711. [DOI] [PubMed] [Google Scholar]
- 35.Moschetta A, Stolk MF, Rehfeld JF, Portincasa P, Slee PH, Koppeschaar HP, et al. Severe impairment of postprandial cholecystokinin release and gallbladder emptying and high risk of gallstone formation in acromegalic patients during Sandostatin LAR. Aliment Pharmacol Ther. 2001;15:181–185. doi: 10.1046/j.1365-2036.2001.00924.x. [DOI] [PubMed] [Google Scholar]