

Abstract
In microvessels, acute inflammation is typified by an increase in leukocyte-endothelial cell interactions culminating in leukocyte transmigration into the tissue, and increased permeability to water and solutes, resulting in tissue edema. The goal of this study was to establish a method to quantify solute permeability (Ps) changes in microvessels in intact predominantly blood perfused networks in which leukocyte transmigratory behavior could be precisely described using established paradigms. We used intravital confocal microscopy to measure solute (BSA) flux across microvessel walls, hence Ps. The quantitative fluorescence approach of Huxley et al (Am. J. Physiol. 252:H188–H197,1987) was adapted to the imaged confocal tissue slice in which the fluorescent source volume and source surface area of the microvessel were restricted to the region of vessel that was contained within the imaged confocal tissue section. Ps measurements were made in intact cremaster muscle microvasculature of anesthetized mice and compared to measurements of Ps made in isolated rat skeletal muscle microvessels. Mouse arteriolar Ps was 9.9±1.1 × 10⁻⁷cm.sec−1 (n=16), which was not different from 8.4±1.3 × 10⁻⁷cm.sec−1 (n=6) in rat arterioles. Values in venules were significantly (p<.05) higher: 44.4±7.9 × 10⁻⁷cm.sec−1 (n=14) in mice and 25.0±3.7 × 10⁻⁷cm.sec−1 in rats. Convective coupling was estimated to contibute <10% to the measured Ps in both microvessel types and both animal models. We conclude that this approach provides an appropriate quantification of Ps in the intact microvasculature, and that arteriolar Ps, while lower than in venules, is nevertheless consistent with arterioles being a significant source of interstitial protein.
Keywords: skeletal muscle microvascular function, male, rat, mouse, confocal microscopy, albumin
INTRODUCTION
Acute inflammation is typified by two principal responses in microvessels. These are an increase in leukocyte-endothelial cell interactions culminating in leukocyte emigration from the vascular lumen, and increased permeability of the microvascular wall to solutes and water, resulting in tissue edema. Neutrophil interactions with the vessel wall are central to the cascade of events that occurs in inflammation (34), and it is established that signaling events in both neutrophils and endothelial cells that are initiated upon neutrophil adhesion to the endothelial surface are necessary for responses that ultimately result in alteration of microvascular barrier function, thus enabling leukocyte transmigration across the vascular wall and into the tissue (33, 36). Interestingly, leukocyte interactions with endothelium have also been implicated in increases in microvessel permeability (9, 10, 12, 13, 24, 40) suggesting that at least under some conditions, neutrophil interactions and permeability changes might have processes in common.
Increased permeability to water and solutes is a well documented feature of the inflamed venular microcirculation, and while there is a substantial body of information addressing biophysical aspects of microvascular permeability, considerably less is known about the mechanisms underlying permeability regulation (29). Thus, for example, while it is known that permeability to water can be regulated separately from selectivity to macromolecules (17), the mechanisms underlying this dichotomy are not understood. Further, it is established that formation of large interendothelial cell gaps during inflammation is not necessarily associated with increased vascular permeability (1, 2, 38), again illustrating that there is much that is not understood about the relationship between regulation of endothelial cell junctional integrity and mechanisms underlying passage of water and/or solutes across the microvascular wall. As is the case for leukocytes migration across the barrier(8, 9, 27, 29), it is also established that pathways for passage of water and macromolecules can be either para- or transcellular (7, 29); there is a great deal still to be learned about the regulatory mechanisms underlying these separate pathways, and about their relative contributions to movement of material across the vascular wall. Importantly, it is now recognized that inflammatory responses are also manifest in the arterial side of the vasculature; both in large vessels, where pathological inflammatory changes are the subject of considerable recent scrutiny (11) and in microvessels, where it is now established that arterioles can respond to a variety of vascular regulatory peptides with changes in permeability (18, 19). It is also established that arterioles support increased leukocyte adhesive interactions under inflammatory conditions (13, 25), suggesting that here too, neutrophil-endothelial cell interactions may be relevant for regulation of the microvascular barrier.
As a first step in exploring how mechanisms regulating leukocyte transmigration relate to those regulating permeability to water and solutes, we report here a modified approach to measurement of solute permeability in intact cremaster muscle microvasculature of anesthetized mice. Our goal was to establish the ability to quantify solute permeability changes in intact microvessels in a network that remains predominantly blood perfused, and in which leukocyte adhesive behavior in the same microvessels can be precisely described using established paradigms (21–23). We compare measurements made using this new approach to those made in isolated rodent skeletal muscle microvessels, using methods for measurement of permeability that have been established previously for isolated coronary microvessels (18, 19).
METHODS
Animals and tissue preparation
All procedures were approved by the institutional review boards of the University of Rochester and the University of Missouri-Columbia.
Mice
Mice (C57Bl/J, Jackson Laboratories, male, 20–30g) were prepared for intravital microscopy as described elsewhere (6, 23, 26). Briefly, they were anesthetized with pentobarbital sodium (70–75mg/kg, i.p.) and were surgically prepared for intravital microscopy. This included tracheotomy, catheterization of a jugular vein and surgical exteriorization of the right cremaster muscle with the aid of a dissecting microscope. The prepared tissue was continuously superfused with bicarbonate-buffered physiological salt solution (PSS) that was warmed to 36° C and equilibrated with 5% CO2/95% N2 to maintain pH at 7.4±0.5 and superfusate PO2 below 15torr.
Tissue temperature (35.5±0.5° C) and anesthetic level were monitored throughout the experiment: supplemental i.v. anesthetic was given as needed. At the conclusion of experimental protocols, the animal was euthanized by i.v. anesthetic overdose.
Microvessel images were viewed with an Olympus BX50WI microscope using an Olympus 10× objective (n.a. 0.25). Fluorescent images were acquired at 30 frames per second using a Nipkow disk scanning confocal head (Yokogawa) and an intensified CCD camera (XR-Mega 10, Stanford Photonics), using an argon laser (20mW, National Laser) to provide excitation at 488nm: laser power and camera gain settings were held constant for all image acquisitions and the camera response was verified to be linear over the range used for these acquisitions. When needed (e.g. for diameter measurement), transilluminated brightfield images were acquired through the same light path. Images were viewed on a monitor (projecting a field of view of 0.5 × 0.7 mm) and were acquired to videotape (Sony VO9500) for offline analysis.
Rats
Sexually mature male Sprague-Dawley Rats (100–150g Hilltop) were anesthetized with 130mg/kg i.p. thiobutabarbital (Inactin™, Research Biochemicals). Following removal of fur and skin from the anterior abdomen, the abdominal wall muscle was excised and placed in cold (4 °C) mammalian Krebs solution. Animals were euthanized by an overdose of thiobutabarbital and spinal cord transection.
Dissection of microvessels from rat abdominal skeletal muscle was modified from that for porcine coronary microvessels (18, 19). In brief, with the aid of a dissecting microscope, arterioles and venules were isolated from approximately 4.5 by 3.5cm pieces of excised abdominal wall muscle pinned into 20 mm deep culture dishes (Radnoti) containing cold (4 °C) mammalian Krebs solution and 10 mg/ml bovine serum albumin (BSA). An arteriolar plexus, dissected from the internal surface of the abdominal muscle (transversus abdominal muscle), contained arterioles that appeared less than 100μm in internal diameter and branched from larger feed arterioles arising from the cranial or caudal epigastric artery. Because the branching patterns of arterioles and venules are parallel, isolation of an arteriolar plexus results in isolation of a venular plexus as well. Venules were distinguished from arterioles by the absence of a muscular wall and larger resting diameter. The isolated plexus was mounted on a Sylgard pad at approximately resting length for the measurement of apparent solute permeability, Ps. The perfused plexus was transilluminated and viewed with a 10× objective (n.a. 0.22) using a fixed stage inverted microscope (Leica Diavert or Olympus IX70) equipped with an adjustable magnifier for placement of the perfusion micropipette. The light path of the microscope was split 50/50 and projected simultaneously to a video system and to an analog microscope photometer (PTI or Solamere TG). Vessels were imaged using a black and white CCD camera (Dage-MTI 72) coupled to an intensifier (Dage-MTI Gen-II-Sys) or a low light camera (PTI) and displayed on 2 video monitors (projecting fields of view of 0.65 × 0.78 or 1.30 × 1.56 mm). Output from the photometer was displayed on a strip chart recorder (Hewlett Packard or Cole Parmer) and used in the determination of solute flux (see below).
Protocols for measurement of Ps
The principle underlying the measurement of Ps has been described elsewhere (3, 4) and is based on the expectation that fluorescent tagged macromolecule will move from the microvessel into the tissue space in a manner that reflects the behavior of native albumin (see below). Briefly, fluorescence intensity (If) from the selected microvessel and surrounding tissue (identified for mice and rats, respectively, as described below) was measured and used to calculate solute flux (Js) per unit surface area (S) and constant concentration gradient (ΔC) (Js/SΔC, cm.s−1) from the relationship:
| (Equation 1) |
where ΔI0 is the fluorescence intensity of the test solute filling the vessel lumen, (dIf/dt)i is the initial change in fluorescence intensity as solute moves across the vessel wall, and D is diameter of the microvessel, which is assumed to have circular cross-section.
To assess the contribution of convective coupling to the flux of BSA, the flux measurement was repeated in isolated rat arterioles and venules at a series of hydrostatic pressures. As described extensively in previous studies (14, 16) and assuming for the simplest case a homoporous barrier and a small constant oncotic pressure:
where ΔP (cmH2O) is the transvascular hydrostatic pressure gradient, Δπ (cmH2O) is the transvascular oncotic pressure gradient (3.78 cmH2O in these experiments (28)), Psd is the true diffusive permeability in the absence of convective coupling, Lp is the hydraulic conductivity of the pathway conducting solute and water, σ is the osmotic reflection coefficient for albumin, and Pe′ is the Pe′clet number relating volume flux to solute flux according to the relationship:
The plot of Js/SΔC against hydrostatic pressure is nonlinear with an intercept of Psd when the effective filtration pressure is zero; the limiting slope, at Pe′>3, is equal to Lp(1-σ). When Pe′>3, the movement of solute is determined exclusively by volume flux (convection).
(i) Mice
To measure Ps in mouse microvessels in situ, a feed vessel to the microvascular network was cannulated and perfused with fluorescent-labeled BSA prepared as described below. To do this, cannulating micropipettes were pulled and triple-bevelled to produce a needle-like tip suitable for piercing the wall of small arterioles (6, 23). Micropipettes were filled with 10mg/ml BSA in PSS in which 10% (1mg/ml) was BSA conjugated with Alexa 488 (BSA-488; see below for solution preparation) and connected to a pressure reservoir. The micropipette was positioned using a hydraulic micromanipulator (MMO203, Narishige) so as to cannulate an arteriole (diameter range 30–100μm) that fed a region of the microvasculature: perfusion of selected downstream portions of the intact network (both arterioles and venules) was achieved by raising the pressure in the pressure reservoir, and by using a second hydraulic manipulator to position a blunted glass micro-occluding rod as needed to prevent blood entering the perfused region from elsewhere in the network and hence to ensure that the selected vessels downstream in the network were completely filled with perfusate from the micropipette during the measurement of Ps.
In each preparation, Ps was measured in either an arteriole or a venule, occasionally in both. Following cannulation of the upstream feed vessel, the target vessel was visualized using confocal fluorescence imaging and was videotaped continuously for 10–30 sec (baseline) prior to perfusion of the BSA-488, during the 1 min perfusion, and for 10–20 sec after perfusion was stopped and blood flow reestablished. Upon completion of the measurement sequence, but before BSA-488 perfusion was stopped, a brightfeld image of the target vessel was acquired for measurement of microvessel diameter. The micropipette balance pressure (i.e. intravascular hydrostatic pressure) measured in typical target microvessels by direct cannulation was 19.8±3.4 (n=8) cmH2O in arterioles and 7.9±1.4cmH2O (n=7) in venules, thus although the convective coupling component of BSA-488 transfer to the tissue space could not be determined directly in this system, its contribution will be similar to that measured in the isolated rat vessels (see below) where the balance (hydrostatic) pressures were in the same range.
(ii) Rats
To measure Ps in the isolated rat skeletal muscle microvessels, selected vessels (either arterioles or venules) were cannulated with a sharply beveled double barreled (theta) glass micropipette (WPI) that contained an unlabeled washout solution (10mg/ml BSA in Krebs) in one half of the theta pipette and BSA-488 in Krebs (10mg/ml total BSA, see below) in the other half of the pipette. All measurements were performed at 15°C. An adjustable rectangular window inserted into the light path was used to restrict the area for measurement of If to a rectangle of approximately 3 times the vessel diameter in width and 2 times the vessel diameter in length. For each measurement of Ps, the selected vessel was first perfused with unlabeled BSA for up to 30 seconds (baseline) and the perfusate was then rapidly switched to BSA-488. After at least 2 min perfusion, the perfusate was returned to unlabeled BSA and recording was continued for a total of at least 5 minutes. Vessels were perfused at a fixed pressure of 15 cmH2O for arterioles and 12 cmH2O for venules. At these pressures, the convective coupling measurements demonstrated that Pe′ was on the order of 0.2 for arterioles and 0.1 for venules. Thus solvent drag contributes <10% to the net flux (hence Ps) in either microvessel type i.e. values of diffusive permeability (Psd) are on the order of 10% lower than the reported values of Ps values and are not distinguishable from measurement error.
Image analysis and calculation of Ps using confocal imaging of in situ mouse microvessels
Videotaped sequences were digitized at 2 Hz using a CG-7 frame grabber (Scion, Inc) on a Macintosh G4 computer and analyzed with NIH Image software (version 6.1). A “region of interest” (ROI) was identified for each microvessel by positioning on the video field a rectangle that encompassed both vessel and tissue and was approximately 3 times the vessel diameter in width and 6–8 vessel diameters in length (Figure 1). The total fluorescence intensity (grayscale range: 0–255; 0=black, 255=white) was measured for the ROI in each of the sequence of acquired fields, starting with baseline images of the ROI acquired with blood perfusing the vessel before initiation of BSA-488 perfusion and continuing for at least 1 minute during perfusion of the micropipette contents. Background intensity, measured from the ROI prior to perfusion of the fluorescent probe, was 23.3±0.08 grayscale units. During perfusion of the targeted microvascular region with BSA-488 from the micropipette, the rest of the microvasculature remains blood perfused, thus it is possible that small variations in pressure drop across regions of the intact network might occur and therefore result in blood contamination of the target vessel during the permeability measurement. To control for this, we quantified the intensity in the vessel itself, and if the vessel intensity decreased with time, or oscillated during the measurement period, the measurement was discarded. Thus, in addition to changes in average intensity of the ROI with time, we plotted the average intensity versus time for the vessel itself and for the tissue alone with the vessel masked out of the analyzed ROI (Fig.1). For calculation of Ps in in situ microvessels in mouse cremaster, the imaged confocal slice of tissue was calculated to be 15 μm in depth for the 10× objective that we used in these studies, using a relationship based on the Rayleigh criterion applied in the axial (z-axis) direction (20). This estimates the distance from the point of maximum intensity to the first point of minimum intensity of the central region of brightness along the z axis in the confocal slice. In living tissues, this approximates to:
Figure 1.
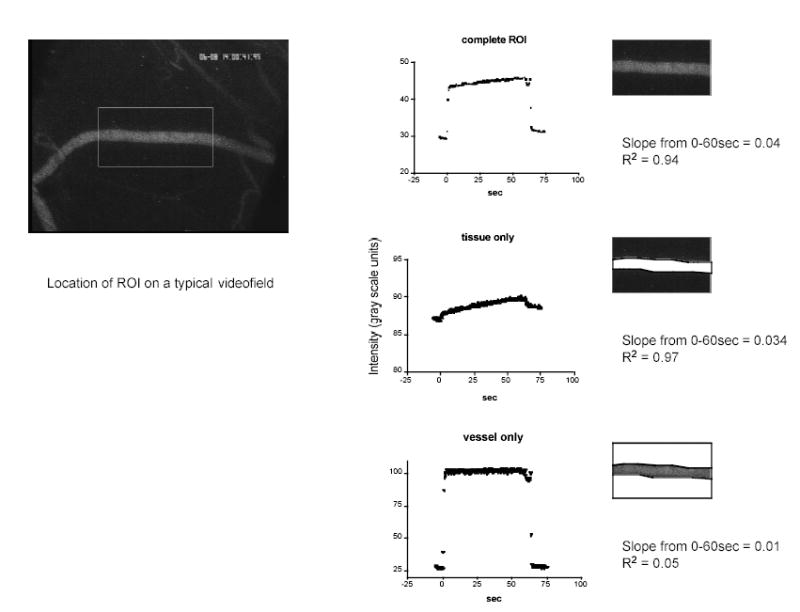
Left panel shows a representative video field from a typical experiment with the location of the analyzed region of interest (ROI) for that vessel. Right panels show the intensity trace obtained from the entire ROI (top), the tissue only (middle) and the vessel only (bottom). Data were used for calculation of Ps only when the slope of the vessel trace was not different from zero.
where λ is wavelength of emitted light and n.a. is the numerical aperture of the objective.
As shown in Figure 2A, the vessel volume that acts as the source of BSA-488 in the confocally imaged tissue “slice” was thus not that expected for a cylindrical blood vessel imaged using conventional fluorescence microscopy (as in the isolated rat vessels, see below), and was obtained from the equation:
Figure 2.
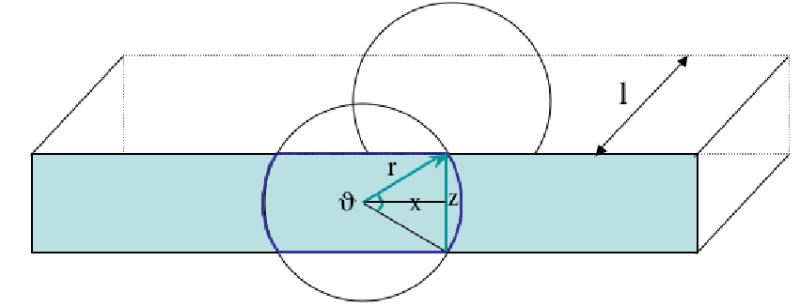
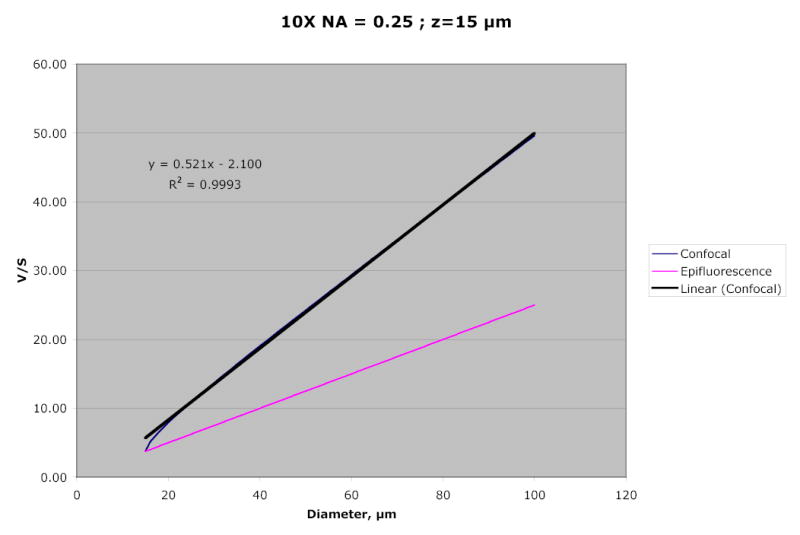
A:Schematic representation of the tissue “slice” sampled with confocal imaging. The shaded rectangle indicates one face of the rectangular tissue region of length l, and depth z. The vessel, which is assumed circular and is bisected by the tissue slice, has radius r. The angle, ϑ, and chord x, are used as described in the text. Figure 2B: Calculated ratio of volume to surface area (V/S) of the confocal tissue slice, using a 10×, 0.25 numerical aperture objective, and for a z-axis depth of 15μm. For this optical condition, the slope of V/S is linear for vessel diameters above approximately 25μm, and is significantly greater than the slope of V/S calculated for a conventionally imaged vessel that has a circular source volume for the measured fluorescence.
where V is the source volume and S is the surface area of the relevant confocally imaged tissue slice shown in Fig. 2A; l is the vessel length; z is the calculated depth of the slice (15μm); ϑ is 2 × the angle subtended by radius, r and chord, x as shown in Fig.2A, and is given by:
We used this relationship to calculate the ratio of V/S for microvessels of different diameter: Fig. 2B illustrates how V/S varies with vessel diameter for a confocal image obtained with a 10×, 0.25 n.a. objective. The figure shows that for vessels greater than approximately 25μm diameter, the relationship is linear, and has significantly greater slope that would be seen if the vessel was imaged using conventional fluorescence microscopy, in which the source volume for the fluorescence is cylindrical (hence V/S = r/2). The value for V/S at the appropriate vessel diameter was substituted into equation 1.
Statistical analyses
An average of 1 – 6 measurements of Js/SΔC at the measurement pressure was used to represent Ps in individual microvessels. Means ±SE are reported in the text. In mouse vessels it was not always possible to obtain repeated measures of Ps in individual microvessels at the same apparent network steady state, hence the first measurement in each vessel is reported; in rats, the reported values are the mean of at least 3 replicates of Ps. Groups were compared using one way anova or t-tests as appropriate: differences were considered significant when P<0.05.
Solutions
All chemicals were obtained from Sigma unless indicated otherwise.
Composition of physiological salt solution (PSS) in mM: 131.9 NaCl,4.7 KCl, 2.0 CaCl2, 1.2 MgSO4, and 30 NaHCO3, equilibrated with 5% CO2-95% N2 to maintain pH 7.4±0.05 at 37°C. Osmolarity of the solution was 290±2mOsm.
Composition of mammalian Krebs solution (Krebs) in mM: 141.4 NaCl, 4.7 KCl, 2.0 CaCl2·H2O, 1.2 MgSO4, 1.2 NaH2PO4·H2O, 5 glucose, 3 NaHCO3, and 1.5 Na-N-2-hydroxyethylpoperaxine-N′-2-ethanesulfonic acid (HEPES). The pH and osmolarity of the solution were 7.40 ±0.05 and 294 (292–298) mOsm respectively at room temperature.
Krebs or PSS serum albumin solution
For the stock solution of BSA, the protein was dissolved in ddH2O at a concentration of 100mg/ml. Diafiltration was performed in an Amicon® Stirred Cell (Millipore) through a 30,000 Nominal Molecular Weight Limit (NMWL; Millipore) filter with a volume of glucose-free Krebs equal to 3 times the volume of BSA solution. The concentration of the dialyzed protein was determined by absorbance spectroscopy at 280nm wavelength, then adjusted to 100mg/ml stock solution with Krebs and stored at −20 ºC. All working solutions containing albumin at 10mg/ml final concentration were prepared and used daily.
Fluorescently labeled albumin
BSA was labeled with the fluorescent dye, Alexa Fluor® 488 (Molecular Probes). Alexa Fluor® 488 and BSA in 0.05M borate, pH 8.3 (3.3:1; molar/molar; starting concentration 0.125 M albumin) were mixed and reacted for 30 min at room temperature. Free dye was removed by centrifugation (4000g; Vivaspin 20, 30,000NMWL, Sartorius) followed by removal of free fluorescent dye with D-Salt™ Polyacrylamide Desalting Columns (Pierce). The column eluate was reconcentrated at 4000g, assayed for protein concentration (Biorad protein assay) and diluted to 10mg/ml with Krebs. The final perfusate (BSA-488) used for Ps measurement at 10mg/ml final concentration consisted of conjugated BSA and unlabeled dialyzed BSA (mixed 1:9; weight/weight) in Krebs or PSS solution. Physicochemical characteristics (charge, mobility, molecular size, tendency to polymerise) are unchanged by 1:1 labeling of albumin with Alexa Fluor® 488 fluorescent dye (data not shown).
RESULTS
A total of 27 mice and 11 rats were used in these experiments. Mean diameter of the observed vessels in mice was 44.1 ± 2.6μm (arterioles) and 46.1 ± 2.6μm (venules) and in rats was 45.6 ± 2.6μm (arterioles) and 47.5 ± 7.7 μm (venules).
Figure 3 summarizes mean Ps values for mouse and rat microvessels. Mouse arteriolar Ps (9.9±1.1 × 10⁻⁷cm.sec−1, n=16) was significantly lower than Ps in mouse venules (44.4±7.9 × 10⁻⁷cm.sec−1, n=14, P = 0.0004). A similar difference was found between Ps in rat microvessels (arterioles: 8.4±1.3 × 10⁻⁷cm.sec−1, n=6; venules: 25.0±3.7 × 10⁻⁷cm.sec−1, n=6, P = 0.002). Importantly, Ps measured in each type of vessel in the intact mouse microvasculature was not significantly different from the value that we measured in similar isolated rat microvessels (P = 0.69 for arterioles and 0.18 for venules), confirming that the tissue itself (in this case skeletal muscle fibers) is not a major contributor to the ease with which macromolecules move across the vascular barrier into the tissue space.
Figure 3.
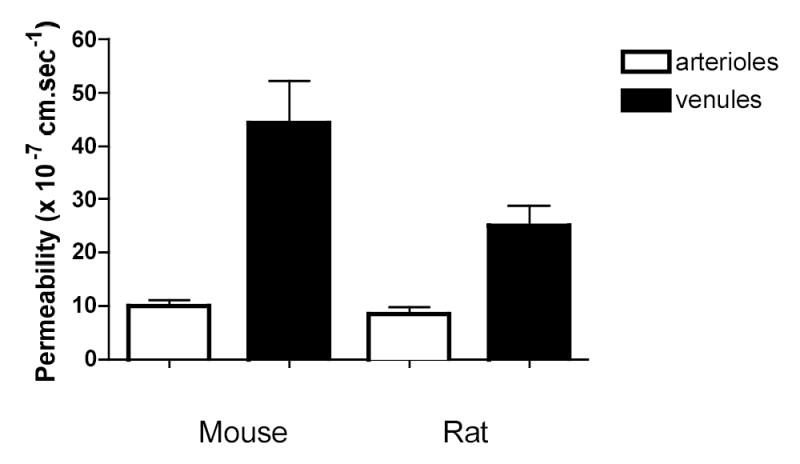
Permeability (mean ±se) measured in mouse and rat microvessels. n = 16 and 14 in mouse arterioles and venules respectively and n = 6 in both groups of rat vessels. In both species, Ps in arterioles is significantly lower than in venules: between species are not different.
DISCUSSION
In this study we report that permeability to macromolecules (Ps) can be measured in intact, blood perfused skeletal muscle microvascular networks, using a modification of the fluorescence-tracer technique originally reported by Huxley and colleagues (15) and adapted for use in isolated coronary muscle microvessels by Huxley and Williams (18, 19). We find that both arteriolar and venular permeability in the mouse microvessels are closely comparable to that measured in the isolated rat vessels, suggesting that movement of macromolecules into the tissue is governed primarily by the characteristics of the vascular wall and is not substantially influenced by the characteristics of the tissue (skeletal muscle) space. The permeability values reported here in mouse and rat skeletal muscle venules are comparable to those reported in isolated pig coronary (18, 37) and rat mesenteric (32, 41) venules. Similarly, the arteriolar permeabilities that we report are comparable to earlier reports in isolated coronary arterioles (19). Thus overall, we conclude that the confocal imaging approach that we describe here provides an appropriate quantification of the permeability characteristics of the vascular wall in these microvessels. We found that while Ps in arterioles is lower than in venules, arterioles nevertheless characteristically exhibit permeabilites that are consistent with their being a significant source of interstitial protein.
Earlier reported measurements of Ps that we describe above have in common that the vessels under observation were isolated either by dissection free of the tissue or because they remained in situ but once cannulated and perfused were effectively isolated from the rest of the network. Our goal in the mouse preparations was to measure Ps in microvessels that were minimally isolated from the microvascular network and which retained the capability of being autoperfused. Our approach therefore, as described above, was to choose a microvessel cannulation site that was well proximal to the target vessel so as to not damage the wall of the target vessel itself, and hence to retain intact its response capabilities, for example the ability of arterioles to dilate, or the ability of venules to sustain appropriate leukocyte interactions with the endothelial surface. The vessels that we chose as targets are of the same size and vessel class as mouse vessels whose responses to vasoactive or inflammatory stimuli have been documented in other studies (5, 6, 22, 23, 26). A potential limitation of this network approach is that, because the network retains its response capacity, arteriolar tone and hence flow in individual microvessels as well as the distribution of flow in the network, can vary in response to a variety of physiological stimuli. In turn, this necessitated our introducing into the measurement a routine confirmation that perfusion conditions in the vessel during the measurement were invariant - we did this by confirming that the fluorescent signal from the vessel itself remained constant during the measurement (Fig. 1) and by discarding any measurement sequence for which this criterion was not fulfilled (overall, approximately 15% were discarded for this and other technical reasons). Also because of our network cannulation strategy, we were not able to obtain a precise estimate of the pressure in the vessel at the time of the Ps measurement. However, we were able to estimate the hydrostatic pressure in a representative group of microvessels in situ by directly cannulating them and determining the balance pressure: this showed that the expected pressures in these vessels were in the same range as those that we used in the isolated vessels, where we determined that convective coupling makes only a small contribution to the measured Ps. An additional consideration for measurement of Ps in the intact network is that, in contrast to observations made in isolated microvessels, perfusion with the test solute is not confined to a single target microvessel, hence the increase in fluorescence measured in the ROI could include tracer that originated from other vessels in the vicinity of the vessel of interest. To minimize this, we placed the ROI on vessel regions that were straight, well removed from branch points, and as far as practicable from other vessels of similar size. We chose the dimensions of the ROI following preliminary explorations in which we monitored the intensity with time at selected distances from target vessels, and identified a radial dimension such that typically, fluorescence at this distance did not increase measurably above background during the run, indicating that the source of fluorescence increase within the whole ROI was the test vessel. The typical length of the ROI (6–8 vessel diameters) was chosen to be as long as feasible while supporting the above criterion.
For the Ps measurements in rat skeletal muscle microvessels, the vessels were isolated and therefore, as described here and previously for similarly isolated coronary microvessels (18, 19), quantification of fluorescence intensity is made using regular fluorescence imaging, in which the entire vessel lumen (assumed circular) acts as the source of fluorescent tracer. If in fact these vesssels have an elliptical cross-section where the major axis is what we measure as the vessel radius, then Ps will be predictably underestimated (35) such that the “flatter” the vessel, the more we will underestimate Ps. For isolated rat venules with a mean radius of 47.5 μm, 20% “flattening” will result in a 13% underestimate of Ps; 35% will underestimate Ps by 30% and the vessels would have to be flattened to 50% to raise Ps to the value that we measured in the mouse venules. For the mouse vessels studied with confocal imaging, our preliminary observations suggest that they can be modeled as circular: to explore how being elliptical would affect the measured Ps, we used the geometry of the confocal slice described in figure 2 to recalcuate Ps with a 20% change in the z-axis length (and consequent changes in calculated V/S for the slice geometry) and found that for a 45μm vessel the calculated Ps would change by less than 3%.
Our use of confocal imaging in the intact mouse system enabled us to obtain analyzable images in a complex three-dimensional tissue: the catchment volume for fluorescence measurement in this system at the magnification that we used was a confocal “slice” of depth 15μm and with geometric characteristics as described in the Methods section and Fig. 2. The characteristics of our imaging system were such that we were able to make measurements in a wide range of target vessels at a variety of depths in the tissue: vessels lying below several striated muscle cells were found to be suitable for permeability measurements, given the excitation and imaging capabilites of the confocal system and ICCD camera that we used.
In summary, we have developed an approach to measurement of Ps in intact, predominantly blood perfused skeletal muscle microvessels. These measurements were quantitatively comparable to measurements made in isolated rodent microvessels: we conclude that Ps of the order of 8 – 9 × 10⁻⁷ cm.sec−1 is typical of unstimulated rodent skeletal muscle arterioles, and that venular permeabilty is 2 – 4 times higher, at 20 – 40 × 10−7 cm.sec−1 under similar “non-inflammatory” conditions. How each of these vessel types respond to inflammatory stimuli, and the relationship between permeability and leukocyte transmigration in these vessels, remains to be determined.
Acknowledgments
We thank Ms Sue Bingaman for characterizing and labeling the BSA-488. This work was supported by NIH Grants HL75186, HL18208 and HL42528, and by Grant NASA NAG 5-12300 to the National Center for Gender Physiology.
References
- 1.Baluk P, Fine NW, Thomas HA, Wei ET, McDonald DM. Anti-inflammatory mystixin peptides inhibit plasma leakage without blocking endothelial gap formation. J Pharmacol Exp Ther. 1998;284:693–699. [PubMed] [Google Scholar]
- 2.Clough G. Relationship between microvascular permeability and ultrastructure. Prog Biophys Mol Biol. 1991;55:47–69. doi: 10.1016/0079-6107(91)90011-g. [DOI] [PubMed] [Google Scholar]
- 3.Curry FE, Huxley VH, Adamson RH. Permeability of single capillaries to intermediate-sized colored solutes. Am J Physiol. 1983;245:H495–505. doi: 10.1152/ajpheart.1983.245.3.H495. [DOI] [PubMed] [Google Scholar]
- 4.Curry FE, Huxley VH, and Sarelius IH. Techniques in the microcirculation: Measurement of permeability, pressure and flow. In: Techniques in the Life Sciences, edited by Linden RJ. New York: Elsevier, 1983, p. 1–34.
- 5.Duza T, Sarelius IH. Increase in endothelial cell Ca(2+) in response to mouse cremaster muscle contraction. J Physiol. 2004;555:459–469. doi: 10.1113/jphysiol.2003.051029. [DOI] [PMC free article] [PubMed] [Google Scholar]
- 6.Duza T, Sarelius IH. Localized transient increases in endothelial cell Ca2+ in arterioles in situ: implications for coordination of vascular function. Am J Physiol Heart Circ Physiol. 2004;286:H2322–2331. doi: 10.1152/ajpheart.00006.2004. [DOI] [PubMed] [Google Scholar]
- 7.Feng D, Nagy JA, Dvorak HF, Dvorak AM. Ultrastructural studies define soluble macromolecular, particulate, and cellular transendothelial cell pathways in venules, lymphatic vessels, and tumor-associated microvessels in man and animals. Microsc Res Tech. 2002;57:289–326. doi: 10.1002/jemt.10087. [DOI] [PubMed] [Google Scholar]
- 8.Feng D, Nagy JA, Pyne K, Dvorak HF, Dvorak AM. Neutrophils emigrate from venules by a transendothelial cell pathway in response to FMLP. J Exp Med. 1998;187:903–915. doi: 10.1084/jem.187.6.903. [DOI] [PMC free article] [PubMed] [Google Scholar]
- 9.Gautam N, Olofsson AM, Herwald H, Iversen LF, Lundgren-Akerlund E, Hedqvist P, Arfors KE, Flodgaard H, Lindbom L. Heparin-binding protein (HBP/CAP37): a missing link in neutrophil-evoked alteration of vascular permeability. Nat Med. 2001;7:1123–1127. doi: 10.1038/nm1001-1123. [DOI] [PubMed] [Google Scholar]
- 10.Guo M, Wu MH, Granger HJ, Yuan SY. Focal adhesion kinase in neutrophil-induced microvascular hyperpermeability. Microcirculation. 2005;12:223–232. doi: 10.1080/10739680590905251. [DOI] [PubMed] [Google Scholar]
- 11.Hansson GK. Inflammation, atherosclerosis, and coronary artery disease. N Engl J Med. 2005;352:1685–1695. doi: 10.1056/NEJMra043430. [DOI] [PubMed] [Google Scholar]
- 12.He P, Wang J, Zeng M. Leukocyte adhesion and microvessel permeability. Am J Physiol Heart Circ Physiol. 2000;278:H1686–1694. doi: 10.1152/ajpheart.2000.278.5.H1686. [DOI] [PubMed] [Google Scholar]
- 13.Huang Q, Wu M, Meininger C, Kelly K, Yuan Y. Neutrophil-dependent augmentation of PAF-induced vasoconstriction and albumin flux in coronary arterioles. Am J Physiol. 1998;275:H1138–1147. doi: 10.1152/ajpheart.1998.275.4.H1138. [DOI] [PubMed] [Google Scholar]
- 14.Huxley VH, Curry FE. Differential actions of albumin and plasma on capillary solute permeability. Am J Physiol. 1991;260:H1645–1654. doi: 10.1152/ajpheart.1991.260.5.H1645. [DOI] [PubMed] [Google Scholar]
- 15.Huxley VH, Curry FE, Adamson RH. Quantitative fluorescence microscopy on single capillaries: alpha-lactalbumin transport. Am J Physiol. 1987;252:H188–197. doi: 10.1152/ajpheart.1987.252.1.H188. [DOI] [PubMed] [Google Scholar]
- 16.Huxley VH, Curry FE, Powers MR, Thipakorn B. Differential action of plasma and albumin on transcapillary exchange of anionic solute. Am J Physiol. 1993;264:H1428–1437. doi: 10.1152/ajpheart.1993.264.5.H1428. [DOI] [PubMed] [Google Scholar]
- 17.Huxley VH, Meyer DJ., Jr Capillary permeability: an albumin component attenuates active changes in Lp. Am J Physiol. 1990;259:H1357–1364. doi: 10.1152/ajpheart.1990.259.5.H1357. [DOI] [PubMed] [Google Scholar]
- 18.Huxley VH, Williams DA. Basal and adenosine-mediated protein flux from isolated coronary arterioles. Am J Physiol. 1996;271:H1099–1108. doi: 10.1152/ajpheart.1996.271.3.H1099. [DOI] [PubMed] [Google Scholar]
- 19.Huxley VH, Williams DA. Role of a glycocalyx on coronary arteriole permeability to proteins: evidence from enzyme treatments. Am J Physiol Heart Circ Physiol. 2000;278:H1177–1185. doi: 10.1152/ajpheart.2000.278.4.H1177. [DOI] [PubMed] [Google Scholar]
- 20.Inoue S. Foundations of Confocal Scanned Imaging in Light Microscopy. In: Handbook of Biological Confocal Microscopy, edited by Pawley JB. New York: Plenum Press, 1995, p. 1–17.
- 21.Kim MB, Sarelius IH. Distributions of wall shear stress in venular convergences of mouse cremaster muscle. Microcirculation. 2003;10:167–178. doi: 10.1038/sj.mn.7800182. [DOI] [PubMed] [Google Scholar]
- 22.Kim MB, Sarelius IH. Regulation of leukocyte recruitment by local wall shear rate and leukocyte delivery. Microcirculation. 2004;11:55–67. doi: 10.1080/10739680490266199. [DOI] [PubMed] [Google Scholar]
- 23.Kim MB, Sarelius IH. Role of shear forces and adhesion molecule distribution on P-selectin-mediated leukocyte rolling in postcapillary venules. Am J Physiol Heart Circ Physiol. 2004;287:H2705–2711. doi: 10.1152/ajpheart.00448.2004. [DOI] [PubMed] [Google Scholar]
- 24.Kubes P, Grisham MB, Barrowman JA, Gaginella T, Granger DN. Leukocyte-induced vascular protein leakage in cat mesentery. Am J Physiol. 1991;261:H1872–1879. doi: 10.1152/ajpheart.1991.261.6.H1872. [DOI] [PubMed] [Google Scholar]
- 25.Kunkel EJ, Jung U, Ley K. TNF-alpha induces selectin-mediated leukocyte rolling in mouse cremaster muscle arterioles. Am J Physiol. 1997;272:H1391–1400. doi: 10.1152/ajpheart.1997.272.3.H1391. [DOI] [PubMed] [Google Scholar]
- 26.Lau KS, Grange RW, Isotani E, Sarelius IH, Kamm KE, Huang PL, Stull JT. nNOS and eNOS modulate cGMP formation and vascular response in contracting fast-twitch skeletal muscle. Physiol Genomics. 2000;2:21–27. doi: 10.1152/physiolgenomics.2000.2.1.21. [DOI] [PubMed] [Google Scholar]
- 27.Luscinskas FW, Ma S, Nusrat A, Parkos CA, Shaw SK. The role of endothelial cell lateral junctions during leukocyte trafficking. Immunol Rev. 2002;186:57–67. doi: 10.1034/j.1600-065x.2002.18606.x. [DOI] [PubMed] [Google Scholar]
- 28.Meyer DJ, Jr, Huxley VH. Differential sensitivity of exchange vessel hydraulic conductivity to atrial natriuretic peptide. Am J Physiol. 1990;258:H521–528. doi: 10.1152/ajpheart.1990.258.2.H521. [DOI] [PubMed] [Google Scholar]
- 29.Michel CC, Curry FE. Microvascular permeability. Physiol Rev. 1999;79:703–761. doi: 10.1152/physrev.1999.79.3.703. [DOI] [PubMed] [Google Scholar]
- 30.Muller WA. Migration of leukocytes across endothelial junctions: some concepts and controversies. Microcirculation. 2001;8:181–193. doi: 10.1038/sj/mn/7800078. [DOI] [PubMed] [Google Scholar]
- 31.Rao RM, Shaw SK, Kim M, Luscinskas FW. Emerging topics in the regulation of leukocyte transendothelial migration. Microcirculation. 2005;12:83–89. doi: 10.1080/10739680590896018. [DOI] [PubMed] [Google Scholar]
- 32.Rumbaut RE, Huxley VH. Similar permeability responses to nitric oxide synthase inhibitors of venules from three animal species. Microvasc Res. 2002;64:21–31. doi: 10.1006/mvre.2002.2394. [DOI] [PubMed] [Google Scholar]
- 33.Smith CW. Possible steps involved in the transition to stationary adhesion of rolling neutrophils: a brief review. Microcirculation. 2000;7:385–394. [PubMed] [Google Scholar]
- 34.Springer TA. Traffic signals for lymphocyte recirculation and leukocyte emigration: the multistep paradigm. Cell. 1994;76:301–314. doi: 10.1016/0092-8674(94)90337-9. [DOI] [PubMed] [Google Scholar]
- 35.Thipakorn B.Defining the cross-section of the fluorescence-filled capillaries from intensity profiles viewed at different angles (Ph.D.). Columbia. MO: University of Missouri, 1996.
- 36.Wang Q, Doerschuk CM. The signaling pathways induced by neutrophil-endothelial cell adhesion. Antioxid Redox Signal. 2002;4:39–47. doi: 10.1089/152308602753625843. [DOI] [PubMed] [Google Scholar]
- 37.Wu MH, Yuan SY, Granger HJ. The protein kinase MEK1/2 mediate vascular endothelial growth factor- and histamine-induced hyperpermeability in porcine coronary venules. J Physiol. 2005;563:95–104. doi: 10.1113/jphysiol.2004.076075. [DOI] [PMC free article] [PubMed] [Google Scholar]
- 38.Wu NZ, Baldwin AL. Transient venular permeability increase and endothelial gap formation induced by histamine. Am J Physiol. 1992;262:H1238–1247. doi: 10.1152/ajpheart.1992.262.4.H1238. [DOI] [PubMed] [Google Scholar]
- 39.Yang L, Froio RM, Sciuto TE, Dvorak AM, Alon R, and Luscinskas FW. ICAM-1 regulates neutrophil adhesion and transcellular migration of TNF-a activated vascular endothelium under flow. Blood April 5, prepublished on line, 2005. [DOI] [PMC free article] [PubMed]
- 40.Yuan SY, Wu MH, Ustinova EE, Guo M, Tinsley JH, De Lanerolle P, Xu W. Myosin light chain phosphorylation in neutrophil-stimulated coronary microvascular leakage. Circ Res. 2002;90:1214–1221. doi: 10.1161/01.res.0000020402.73609.f1. [DOI] [PubMed] [Google Scholar]
- 41.Zeng M, Zhang H, Lowell C, He P. Tumor necrosis factor-alpha-induced leukocyte adhesion and microvessel permeability. Am J Physiol Heart Circ Physiol. 2002;283:H2420–2430. doi: 10.1152/ajpheart.00787.2001. [DOI] [PubMed] [Google Scholar]
- 42.Zhu L, Castranova V, He P. fMLP-stimulated neutrophils increase endothelial [Ca2+]i and microvessel permeability in the absence of adhesion: role of reactive oxygen species. Am J Physiol Heart Circ Physiol. 2005;288:H1331–1338. doi: 10.1152/ajpheart.00802.2004. [DOI] [PubMed] [Google Scholar]