


Abstract
Interaction detection methods have led to the discovery of thousands of interactions between proteins, and discerning relevance within large-scale data sets is important to present-day biology. Here, a spectral method derived from graph theory was introduced to uncover hidden topological structures (i.e. quasi-cliques and quasi-bipartites) of complicated protein–protein interaction networks. Our analyses suggest that these hidden topological structures consist of biologically relevant functional groups. This result motivates a new method to predict the function of uncharacterized proteins based on the classification of known proteins within topological structures. Using this spectral analysis method, 48 quasi-cliques and six quasi-bipartites were isolated from a network involving 11 855 interactions among 2617 proteins in budding yeast, and 76 uncharacterized proteins were assigned functions.
INTRODUCTION
With the availability of complete DNA sequence data for many prokaryotic and eukaryotic genomes, a formidable challenge of post-genomic biology is to understand how genetic information results in the concerted action of gene products both temporally and spatially to achieve biological function, as well as how they interact with each other to create an organism. It is important to develop reliable proteome-wide approaches for a better understanding of protein functions (1,2). Genomic approaches have been used to predict functions of a large number of genes based on their sequences. However, as we know, proteins rarely act alone at the biochemical level; rather, they interact with other proteins as an assembly to perform particular cellular tasks. Having systematic functions, these assemblies represent more than the sum of their parts (3). Traditionally, protein interactions were studied individually by genetic, biochemical and biophysical techniques focusing on a few proteins at a time (4). It is increasingly realized that dissecting the genetic and biochemical circuitry of a cell prevents us from further understanding the biological processes as a whole. Basic constituents of cellular protein complexes and pathways, protein–protein interactions are key determinants of protein function. It is believed that all biological processes are essentially and accurately carried out through protein–protein interactions.
In the last 3 years, high-throughput interaction detection approaches, such as yeast two-hybrid systems (5,6), protein complex purification techniques using mass spectrometry (3,7), correlated messenger RNA expression profiles (8,9), genetic interaction data (10,11) and ‘in silico’ interaction predictions derived from gene context analysis [gene fusion (12,13), gene neighborhood (14,15) and gene co-occurrences or phylogenetic profiles (16,17)], have been developed and they have created a number of datasets regarding protein– protein interactions for several model organisms (Saccharo myces cerevisiae, Caenorhabditis elegans and Helicobacter pylori). These large-scale datasets open a door to comprehensive understanding of the genetic and biochemical phenomena in a cell. Subsequently, several promising methods have been successfully applied to this field. For instance, Schwikowski et al. (18) and Hishigaki et al. (19) predicted uncharacterized proteins based on interacting partners; Maslov and Sneppen (20) analyzed the stable topological properties of interaction networks; Ge et al. (21) provided the first global evidence that genes with similar expression profiles are more likely to encode interacting proteins; and Fraser et al. (22) revealed that the connectivity of well-conserved proteins in the network is negatively correlated with their rate of evolution. These studies revealed that the available data from protein–protein interaction networks in S.cerevisiae share some unexpected features with other complex networks.
The topological pattern of interactions is a rich source of biological functional information, and therefore we need to develop methods to mine and to understand the interaction networks. Here, we applied the spectral analysis method, which has been successful used in other fields (23), to proteomics to identify topological structures of interaction networks, i.e. quasi-cliques and quasi-bipartites. Interestingly, we found that the proteins within same group share similar biological functions. Moreover, for one-third of proteins that are still uncharacterized in S.cerevisiae, this method provides a new approach to predict their functions based on topological structures.
MATERIALS AND METHODS
Spectral analysis
Spectral analysis is a powerful tool to reveal high-level structures underlying enormous and complicated relationships. As a famous paradigm, David Gibson, Jon Kleinberg and Prabhakar Raghavan did excellent work on extracting information from link structure of the Web (23,24). The World Wide Web is known to be composed of an increasing number of pages with hyperlinks pointing to other pages. Despite high complexity of the Web structure, spectral analysis was successfully used to discover ‘authoritative’ information sources and ‘hub’ pages joining authoritative ones together.
We applied the spectral analysis method to complicated protein–protein interaction networks and identified interesting topological structures. In this method, a network is represented by a bi-directed graph G(V,E), i.e. vertex set including each protein as a vertex V = {P1,P2…Pn}, and the edge set E = {(Pi,Pj)| there is an interaction between protein Pi and Pi}. The symmetric n × n adjacent matrix is defined as A = (aij), where aij = 1 if (Pi,Pj) ∈ E, and aij = 0 if (Pi,Pj) ∉ E.
Spectrum of the adjacency matrix A is essentially a reasonable measurement of properties of nodes that could be propagated across the interactions. Let us consider assigning a score to each node to represent their intensity, say X. A node with a high score would increase its neighbors’ score through their interactions. In other words, two nodes are mutually reinforcing, which is in nature a cyclic definition of scores:

The iteration method derived from Gibson et al. (23) and Kleinberg (24) is introduced to break such a cycle. It is interesting that Xi converges to a fixed point from any initializing assignment, and it can be proved that the fixed point is one of the eigenvectors of matrix A, which means it is an intrinsic characteristic of interactions. Moreover, since matrix A is symmetric, all of its eigenvectors are mutually orthogonal, which means that the corresponding properties are also mutually independent. In other words, each eigenvector represents a special property that none of the others could represent.
Identification of topological structures
From a topological point of view, the spectrum helps to uncover the hidden topological structures of a complex interaction network. We found that for each eigenvector with a positive eigenvalue, the proteins corresponding to absolutely larger components tend to form a quasi-clique (i.e. every two of them tend to interact with each other) (Fig. 1a), whereas for each eigenvector with a negative eigenvalue, such proteins tend to form a quasi-bipartite (i.e. the proteins in which two disjoint subsets express high level connectivity between sets rather than within sets) (Fig. 1b).
Figure 1.

The topological structures of protein–protein interaction networks. In a quasi-clique, proteins tend to interact with each other (a), while in a quasi-bipartite, proteins between sets have denser interactions than those within sets (b).
This observation can be explained as follows. The maximal eigenvalue of an adjacent matrix is the maximal value of

(where xi is the ith component of the eigenvector). Other positive eigenvalues can also be described as the maximal value Q with orthogonal condition. Since Q is the summary of xixj corresponding to edge vivj, it would be maximal when the nodes with more edges are assigned a larger value with the same signal, which form a quasi-clique intuitively. Similar quasi-bipartites would be obtained eigenvectors with negative eigenvalues.
We applied the clustering coefficient (CC) (25,26) in our analysis to quantify a quasi-clique’s tendency to form a cluster. The ratio between the number of edges that actually exist between these N nodes and the total number N(N – 1)/2 gives the CC-value of a quasi-clique, i.e. CC = E/[N*(N – 1)/2]*100%, where E is the number of interactions within the clique and N is the number of proteins in it. CC is greater than 0 and less than 1. A value close to 1 represents a clique close to a complete graph.
Assignment of annotation and P-values to quasi-cliques
As an isolated quasi-clique may involve different functional categories, P-values (27,28) are used as criteria to assign each quasi-clique a main function. Hypergeometric distribution was applied to model the probability of observing at least k proteins from a quasi-clique size n by chance in a category containing C proteins from a total genome size of G proteins, such that the P-value is given by

The above test measures whether a quasi-clique is enriched with proteins from a particular category more than would be expected by chance. If the P-value of a category is near 0, the proteins of the category in a quasi-clique will have a low probability of being chosen by chance. Here, we assigned each quasi-clique the main function with the lowest P-value in all categories.
RESULTS
Data source and analysis
Among the interactions produced by high-throughput methods there could be many false positives. To measure their accuracy and to identify the biases, von Mering et al. (4) assessed a total of 80 000 interactions among 5400 yeast proteins reported previously and assigned each interaction a confidence value. In order to reduce the interference by false positives, we focused on 11 855 interactions with high and medium confidence among 2617 proteins.
To analyze the interaction dataset, first we applied the spectral method to calculate all eigenvalues and eigenvectors of the adjacency matrix corresponding to the network. The following criteria were then used to generate quasi-cliques based on eigenvectors with larger and positive eigenvalues. (i) All the proteins were sorted by their absolute weight value in an eigenvector, and the top 10% were selected. (ii) Every protein must interact with at least 20% of the members. Here, we used CC-value to measure the degree of the interconnectivity between nodes and tuned the parameter to guarantee the quality of those cliques. (iii) A quasi-clique must contain at least 10 proteins. As a result, we yielded 48 quasi-cliques, among which the largest one contains 109 proteins (quasi-clique 1 in Table 1) and the smallest one contains 10 proteins (quasi-clique 45 in Table 1); on average, a quasi-clique contains 26.6 proteins (a protein may appear in different quasi-cliques). Similar analysis based on eigenvector with negative eigenvalue produced six quasi-bipartites.
Table 1. Annotation of all quasi-cliques.
| No. | Protein no. | Interaction no. | CC (%) | Distribution (%) | P-value (log10) | Function | ||
|---|---|---|---|---|---|---|---|---|
| M | U | D | ||||||
| 1 | 109 | 2978 | 50 | 72 | 6 | 22 | 75 | Ribosome biogenesis |
| 2 | 97 | 2327 | 49 | 72 | 5 | 23 | 67 | Ribosome biogenesis |
| 3 | 68 | 955 | 41 | 19 | 50 | 31 | 10 | rRNA processing |
| 4 | 44 | 570 | 60 | 18 | 50 | 32 | 6 | rRNA processing |
| 5 | 37 | 423 | 63 | 19 | 49 | 32 | 6 | rRNA processing |
| 6 | 34 | 239 | 42 | 76 | 15 | 9 | 25 | Ribosome biogenesis |
| 7 | 24 | 230 | 83 | 50 | 0 | 50 | 15 | General transcription activities |
| 8 | 40 | 333 | 42 | 80 | 10 | 10 | 47 | Splicing |
| 9 | 34 | 329 | 58 | 9 | 50 | 41 | 5 | Other tRNA-transcription activities |
| 10 | 54 | 1018 | 71 | 78 | 9 | 13 | 41 | Ribosome biogenesis |
| 11 | 24 | 200 | 72 | 79 | 4 | 17 | 28 | Cytoplasmic and nuclear degradation |
| 12 | 44 | 410 | 43 | 59 | 11 | 30 | 20 | Ribosome biogenesis |
| 13 | 32 | 267 | 53 | 34 | 3 | 63 | 15 | rRNA synthesis |
| 14 | 34 | 214 | 38 | 18 | 21 | 61 | 7 | Amino acid degradation (catabolism) |
| 15 | 21 | 153 | 72 | 52 | 14 | 34 | 14 | rRNA processing |
| 16 | 31 | 189 | 40 | 39 | 19 | 42 | 7 | Oxidation of fatty acids; lipid, fatty-acid and isoprenoid biosynthesis |
| 17 | 27 | 251 | 71 | 11 | 67 | 22 | 2 | tRNA transcription; other control of cellular organization; other transcription activities |
| 18 | 16 | 106 | 88 | 63 | 19 | 18 | 16 | mRNA processing (splicing, 5′-, 3′-end processing) |
| 19 | 21 | 119 | 56 | 57 | 24 | 19 | 9 | Ribosome biogenesis |
| 20 | 35 | 281 | 47 | 60 | 3 | 37 | 17 | Ribosome biogenesis |
| 21 | 24 | 119 | 43 | 25 | 21 | 54 | 5 | Lipid, fatty-acid and isoprenoid biosynthesis |
| 22 | 16 | 62 | 51 | 19 | 13 | 68 | 7 | Osmosensing; protein binding |
| 23 | 13 | 78 | 100 | 69 | 31 | 0 | 8 | Ribosome biogenesis |
| 24 | 27 | 157 | 44 | 56 | 4 | 40 | 25 | rRNA synthesis |
| 25 | 14 | 46 | 50 | 36 | 7 | 57 | 6 | Respiration |
| 26 | 28 | 142 | 37 | 50 | 0 | 50 | 23 | rRNA synthesis |
| 27 | 21 | 134 | 63 | 71 | 0 | 29 | 20 | Splicing |
| 28 | 23 | 153 | 60 | 65 | 17 | 18 | 19 | Splicing |
| 29 | 17 | 86 | 63 | 82 | 0 | 18 | 27 | rRNA synthesis |
| 30 | 18 | 92 | 60 | 89 | 0 | 11 | 32 | Transport ATPases |
| 31 | 19 | 84 | 49 | 37 | 5 | 58 | 11 | Tricarboxylic-acid pathway (citrate cycle, Krebs cycle, TCA cycle) |
| 32 | 15 | 70 | 66 | 40 | 7 | 53 | 6 | Lipid, fatty-acid and isoprenoid biosynthesis |
| 33 | 11 | 51 | 92 | 27 | 9 | 64 | 4 | Homeostasis of metal ions (Na, K, Ca, etc.) |
| 34 | 12 | 57 | 86 | 33 | 8 | 59 | 6 | Homeostasis of metal ions (Na, K, Ca, etc.) |
| 35 | 20 | 96 | 50 | 35 | 5 | 60 | 11 | Tricarboxylic-acid pathway (citrate cycle, Krebs cycle, TCA cycle) |
| 36 | 11 | 45 | 82 | 55 | 27 | 18 | 2 | Assembly of protein complexes; lipid, fatty-acid and isoprenoid biosynthesis; cell wall |
| 37 | 11 | 51 | 93 | 27 | 9 | 64 | 4 | Homeostasis of metal ions (Na, K, Ca, etc.) |
| 38 | 19 | 136 | 79 | 79 | 5 | 16 | 22 | Cytoplasmic and nuclear degradation |
| 39 | 13 | 72 | 92 | 100 | 0 | 0 | 22 | Cytoplasmic and nuclear degradation |
| 40 | 14 | 59 | 64 | 29 | 21 | 50 | 2 | Aminoacyl-tRNA-synthetases; cell wall |
| 41 | 13 | 47 | 60 | 54 | 8 | 38 | 12 | Tricarboxylic-acid pathway (citrate cycle, Krebs cycle, TCA cycle) |
| 42 | 12 | 58 | 88 | 42 | 8 | 50 | 5 | Lipid, fatty-acid and isoprenoid biosynthesis |
| 43 | 19 | 91 | 53 | 21 | 37 | 42 | 4 | rRNA processing |
| 44 | 11 | 52 | 94 | 64 | 9 | 27 | 6 | Ribosome biogenesis |
| 45 | 10 | 24 | 53 | 50 | 0 | 50 | 5 | Amino acid biosynthesis |
| 46 | 11 | 52 | 94 | 64 | 9 | 27 | 6 | Ribosome biogenesis |
| 47 | 15 | 40 | 38 | 20 | 0 | 80 | 6 | Other proteolytic degradation |
| 48 | 15 | 51 | 48 | 40 | 20 | 40 | 6 | Lipid, fatty-acid and isoprenoid biosynthesis |
No., quasi-clique no. Protein no., the number of proteins in the quasi-clique. Interaction no., the number of interactions within the quasi-clique. CC, represents the CC-value of a quasi-clique (see Materials and Methods). Function, the assigned function of the quasi-clique. Distribution, percentages of the following three classes in the quasi-clique: M, the percentage of proteins which have the main function; U, the percentage of uncharacterized proteins and D, the percentage of proteins which are discordant with the quasi-clique’s function.
The two topological structures show different interaction patterns. In a quasi-clique proteins tend to interact with each other (Fig. 1a), while in a quasi-bipartite, proteins between sets have denser interactions than those within sets (Fig. 1b). Identification of the above topological structures could not only represent the complicated interaction network in order, but also make the complicated network more convenient to analyze.
Annotation of quasi-cliques
For each of the 48 quasi-cliques, we calculated its P-value and annotated it based on the Munich Information Center (MIPS) hierarchical functional categories. MIPS allows a protein to appear in more than one category, which was taken into account in the calculation of P-value. As a result, 43 quasi-cliques were annotated with one functional category and the other five quasi-cliques were assigned to a set of functional categories (Table 1; see Supplementary Material for complete data sets).
We investigated the functions of individual proteins in quasi-cliques and found that most of them usually share common functions, including ribosome biogenesis, rRNA and tRNA synthesis, processing, transcription control and mRNA splicing, etc. (Fig. 2 and Table 1). Only a small fraction of the proteins turn out uncharacterized or have functions conflicting with the common function of the quasi-clique, as shown in Figure 2. This could be explained by either unavoidable false positive interactions under the current experimental conditions or that the proteins really share this kind of function but it is yet not proved.
Figure 2.

The percentage of functional classes of the 48 quasi-cliques. Distribution of the following three classes: main function, percentage of the proteins that have the main function; unknown function, percentage of the uncharacterized proteins; and discordant function, percentage of the proteins that have discordant functions.
To visualize protein interactions and functional annotations, we have developed a software package that, along with the complete set of data generated by our algorithm, is publicly available at http://www.bioinfo.org.cn/PIN/. Using this software, users can view topological structures and find annotations of proteins and their interactions conveniently.
Functional prediction for uncharacterized proteins in quasi-cliques
The isolated quasi-cliques give a good clue to predict functions of the uncharacterized proteins. Among the 2617 proteins in the raw dataset, 555 were uncharacterized according to MIPS hierarchical functional categories (4). For the 76 uncharacterized proteins in the 48 quasi-cliques, we assigned for each one a function according to the main function of its hosting quasi-clique. If a protein falls into more than one quasi-clique, the main function of the quasi-clique with the lowest P-value was assigned to it. If multiple hosting quasi-cliques have the lowest P-value, or a quasi-clique has multiple main functions, a set of functions would be assigned to the protein. The 76 unknown proteins and their predicted functions with the corresponding P-values are listed in Table 2. There are 43 rRNA processing proteins, seven proteins related to pre-RNA processing, 11 proteins related to ribosome biogenesis, and the other 15 proteins related to energy, metabolism, cytoskeleton and transcription-regulating (See Table 2 for complete data).
Table 2. Prediction for uncharacterized proteins involved in 48 quasi-cliques.
| Protein | P-value (log10) | Predicted function |
|---|---|---|
| YLR421C | 28 | Cytoplasmic and nuclear degradation |
| YNL168C | 7 | Amino acid degradation (catabolism) |
| YDL193W | 6 | Lipid, fatty-acid and isoprenoid biosynthesis |
| YDR018C | 6 | Lipid, fatty-acid and isoprenoid biosynthesis |
| YNL026W | 6 | Lipid, fatty-acid and isoprenoid biosynthesis |
| YJL046W | 12 | Tricarboxylic-acid pathway (citrate cycle, Krebs cycle, TCA cycle) |
| YPL252C | 6 | Homeostasis of metal ions (Na, K, Ca, etc.) |
| YLR074C | 2 | tRNA transcription; other control of cellular organization; other transcription activities |
| YNL123W | 7 | Osmosensing; protein binding |
| YGL211W | 2 | Aminoacyl-tRNA-synthetases; cell wall |
| YGL211W | 2 | Assembly of protein complexes; lipid, fatty-acid and isoprenoid biosynthesis; cell wall |
| YBL055C | 7 | Oxidation of fatty acids; lipid, fatty-acid and isoprenoid biosynthesis |
| YDR428C | 7 | Oxidation of fatty acids; lipid, fatty-acid and isoprenoid biosynthesis |
| YGR263C | 7 | Oxidation of fatty acids; lipid, fatty-acid and isoprenoid biosynthesis |
| YOR093C | 7 | Oxidation of fatty acids; lipid, fatty-acid and isoprenoid biosynthesis |
| YGL059W | 7 | Oxidation of fatty acids; lipid, fatty-acid and isoprenoid biosynthesis |
| YDR428C | 7 | Amino acid degradation (catabolism) |
| YGR263C | 7 | Amino acid degradation (catabolism) |
| YOR093C | 7 | Amino acid degradation (catabolism) |
| YGL059W | 7 | Amino acid degradation (catabolism) |
| YGL059W | 7 | Osmosensing; protein binding |
| YJR008W | 25 | rRNA synthesis |
| YKL099C | 6 | rRNA processing |
| YBL004W | 10 | rRNA processing |
| YDL213C | 4 | rRNA processing |
| YDR324C | 10 | rRNA processing |
| YDR449C | 10 | rRNA processing |
| YDR496C | 10 | rRNA processing |
| YER082C | 10 | rRNA processing |
| YER126C | 10 | rRNA processing |
| YFR001W | 6 | rRNA processing |
| YGL111W | 10 | rRNA processing |
| YGR090W | 10 | rRNA processing |
| YGR103W | 10 | rRNA processing |
| YGR128C | 10 | rRNA processing |
| YGR145W | 10 | rRNA processing |
| YHR052W | 10 | rRNA processing |
| YHR088W | 14 | rRNA processing |
| YHR196W | 6 | rRNA processing |
| YHR197W | 10 | rRNA processing |
| YJL069C | 6 | rRNA processing |
| YJL109C | 10 | rRNA processing |
| YKL014C | 10 | rRNA processing |
| YKR060W | 10 | rRNA processing |
| YKR081C | 10 | rRNA processing |
| YLR022C | 14 | rRNA processing |
| YLR106C | 6 | rRNA processing |
| YLR186W | 10 | rRNA processing |
| YLR222C | 10 | rRNA processing |
| YLR276C | 10 | rRNA processing |
| YLR409C | 10 | rRNA processing |
| YMR049C | 10 | rRNA processing |
| YMR093W | 10 | rRNA processing |
| YNL002C | 10 | rRNA processing |
| YNL110C | 10 | rRNA processing |
| YNL182C | 10 | rRNA processing |
| YNR053C | 10 | rRNA processing |
| YOL041C | 10 | rRNA processing |
| YOL077C | 10 | rRNA processing |
| YOR001W | 14 | rRNA processing |
| YOR145C | 6 | rRNA processing |
| YPL012W | 10 | rRNA processing |
| YPL093W | 10 | rRNA processing |
| YPR144C | 10 | rRNA processing |
| YDL209C | 47 | Splicing |
| YGR278W | 47 | Splicing |
| YLR424W | 47 | Splicing |
| YPL151C | 47 | Splicing |
| YGR156W | 16 | mRNA processing (splicing, 5′-, 3′-end processing) |
| YKL018W | 16 | mRNA processing (splicing, 5′-, 3′-end processing) |
| YKL059C | 16 | mRNA processing (splicing, 5′-, 3′-end processing) |
| YDR036C | 20 | Ribosome biogenesis |
| YDR101C | 75 | Ribosome biogenesis |
| YGL129C | 20 | Ribosome biogenesis |
| YGR283C | 75 | Ribosome biogenesis |
| YIL093C | 20 | Ribosome biogenesis |
| YJR014W | 75 | Ribosome biogenesis |
| YKL155C | 20 | Ribosome biogenesis |
| YMR074C | 6 | Ribosome biogenesis |
| YMR158W | 75 | Ribosome biogenesis |
| YMR310C | 75 | Ribosome biogenesis |
| YNL177C | 75 | Ribosome biogenesis |
The ORF name of proteins is listed in the ‘Protein’ column, corresponding P-value is listed in the middle column and predicted function for each protein is listed in the ‘Predicted function’ column.
We assessed the ability of the P-value to annotate and assign functions using the same approach as Wu et al. (28). As a control, we created and analyzed random networks with the same interaction distribution as the original network. The results show that among the 48 quasi-cliques of our experimental data, >87.5% were significant in one or more annotation categories at P ≤ 0.01/Nc (here Nc is the number of categories), whereas <2.1% of quasi-cliques identified from random network met the same criteria. This means a substantial fraction of isolated quasi-cliques are likely to be biologically meaningful.
Some of our predictions were supported by recent experimental evidence. Of all the quasi-cliques, five were dominated by uncharacterized proteins (functions are unknown for at least 50% of proteins, Fig. 2), which imply that those unknown proteins in a same quasi-clique may form a large complex relating to a certain cellular process. For quasi-cliques 3 and 4, most of the proteins were predicted to mediate rRNA processing, which is partly consistent with the results from recent experiments (29,30,31) (Fig. 3).
Figure 3.
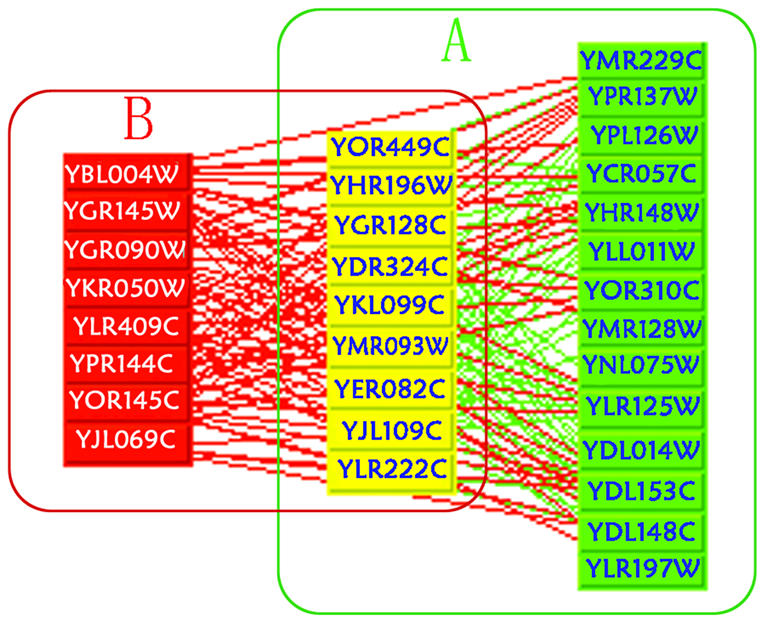
Comparison between function prediction and experimental annotation for small subunit (SSU) processome. (A) SSU processome that is supported by experimental evidence (the yellow and the green proteins); (B) our predictions based on quasi-clique 3 (the red proteins and the yellow proteins). The yellow ones are the overlap of (A) and (B). This suggests that our prediction is partly consistent with the experimental evidence (31).
DISCUSSION
The yeast large-scale protein–protein interaction data have broadened our view of protein functions in this proteomics era. The biological processes of a cell are controlled by interacting proteins in metabolic and signaling pathways and in complexes such as the molecular machines that synthesize and use adenosine triphosphate, replicate and transcribe genes, or build up the cytoskeletal infrastructure (32,33). The knowledge regarding protein–protein interactions has been accumulated by biochemical and genetic experiments, including the widely used high-throughput interaction detection methods, such as the yeast two-hybrid system and protein complex purification techniques using mass spectrometry. Now, a challenging task is to decipher the relationships between individual proteins and to understand the molecular organization of cellular networks. Here, for the first time, we analyzed the complicated protein interaction networks using the spectral analysis method. This approach is useful in revealing hidden topological structures, including quasi-cliques and quasi-bipartites, which exhibit meaningful information of a complex network. Figure 4a shows a part of the original interaction network, which contains 109 proteins. It looks confusing and difficult to assimilate before analysis. In contrast, a tightly interacting quasi-clique including 68 proteins was found from this part of network by spectral analysis. This suggests that a network actually is not random as it appears (Fig. 4b).
Figure 4.

Comparison of different visual representations with and without topological structure. The original protein–protein interaction network is rather miscellaneous and difficult to assimilate (a). The spectral analysis revealed a hidden topological structure underlying the miscellaneous network (b).
As part of these studies, we first offered a flexible and promising large-scale protein function prediction system based on spectral analysis. Compared with the previous approaches, what we presented here has a number of practical advantages. Previous methods used partners or neighbors alone to perform the prediction, whereas our method utilized the more informative topological structure of the whole network, and produced some results that were not covered by the previous predictions. The 76 proteins contain 43 rRNA processing proteins, seven proteins related to pre-RNA processing, 11 proteins related to ribosome biogenesis and another 15 proteins related to energy, metabolism, cytoskeleton and transcription regulation. As a control, we created and analyzed random networks with the same interaction distribution as the original network. The results show that among the 48 quasi-cliques of our experimental data, >87.5% were significant in one or more annotation categories at P ≤ 0.01/Nc (here Nc is the number of categories), whereas <2.1% of quasi-cliques identified from a random network met the same criteria. Some of our predictions have been proved by experiments published recently. This suggests that our prediction method is accurate. Furthermore, this method is a universal one that could be used to predict protein function in other organisms.
Although the initial results are promising, the current method is still far from perfect. We have not yet fully explored all quasi-cliques, for that the problem has been proved to be NP-Complete. Therefore new methods should be developed to reveal more sophisticated topological features. It should be pointed out that prediction accuracy is affected by knowledge of known annotations and false positive interactions. It is well known that so far annotations of proteins in databases are incomplete, i.e. a number of proteins with well-characterized function, or at least well-supported functional prediction, are annotated as ‘unknown function’ in MIPS. This introduces additional uncertainties into our prediction. We believe that our prediction would be better if a more accurate interaction and annotation dataset was applied.
SUPPLEMENTARY MATERIAL
Supplementary Material is available at NAR Online.
Acknowledgments
ACKNOWLEDGEMENTS
We would like to acknowledge with deep appreciation Professor Soren Norby for his examining and revising this paper. This work was supported by the Chinese Academy of Sciences Grant No. KSCX2-2-07, National Sciences Foundation of China Grant No. 39890070, the National High Technology Development Program of China under Grant No. 2002AA231031, National Key Basic Research & Development Program (973) under Grant No. 2002CB713805, the National Grand Fundamental Research 973 Program of China under Grant No. G1998030510 and Beijing Science and Technology Commission Grant No. H010210010113.
REFERENCES
- 1.Fields S. (1997) The future is function. Nature Genet., 15, 325–327. [DOI] [PubMed]
- 2.Rain J.C., Selig,L., De Reuse,H., Battaglia,V., Reverdy,C., Simon,S., Lenzen,G., Petel,F., Wojcik,J., Schachter,V., Chemama,Y., Labigne,A. and Legrain,P. (2001) The protein–protein interaction map of Helicobacter pylori. Nature, 409, 211–215. [DOI] [PubMed]
- 3.Gavin A.C., Bosche,M., Krause,R., Grandi,P., Marzioch,M., Bauer,A., Schultz,J., Rick,J.M., Michon,A.M., Cruciat,C.M. et al. (2002) Functional organization of the yeast proteome by systematic analysis of protein complexes. Nature, 415, 141–147. [DOI] [PubMed]
- 4.von Mering C., Krause,R., Snel,B., Cornell,M., Oliver,S.G., Fields,S. and Bork,P. (2002) Comparative assessment of large-scale data sets of protein–protein interactions. Nature, 417, 399–403. [DOI] [PubMed]
- 5.Uetz P., Giot,L., Cagney,G., Mansfield,T.A., Judson,R.S., Narayan,V., Lockshon,D., Srinivasan,M., Pochart,P. et al. (2000) A comprehensive analysis of protein–protein interactions in Saccharomyces cerevisiae. Nature, 403, 623–627. [DOI] [PubMed]
- 6.Ito T., Chiba,T., Ozawa,R., Yoshida,M., Hattori,M. and Sakaki,Y. (2001) A comprehensive two-hybrid analysis to explore the yeast protein interactome. Proc. Natl Acad. Sci. USA, 98, 4569–4574. [DOI] [PMC free article] [PubMed]
- 7.Ho Y., Gruhler,A., Heilbut,A., Bader,G.D., Moore,L., Adams,S.L., Millar,A., Taylor,P., Bennett,K., Boutilier,K. et al. (2002) Systematic identification of protein complexes in Saccharomyces cerevisiae by mass spectrometry. Nature, 415, 180–183. [DOI] [PubMed]
- 8.Cho R.J., Campbell,M.J., Winzeler,E.A., Steinmetz,L. Conway,A., Wodicka,L., Wolfsberg,T.G., Gabrielian,A.E., Landsman,D., Lockhart,D.J. and Davis,R.W. (1998) A genome-wide transcriptional analysis of the mitotic cell cycle. Mol. Cell, 2, 65–73. [DOI] [PubMed]
- 9.Hughes T.R., Marton,M.J., Jones,A.R., Roberts,C.J., Stoughton,R., Armour,C.D., Bennett,H.A., Coffey,E., Dai,H., He,Y.D. et al. (2000) Functional discovery via a compendium of expression profiles. Cell, 102, 109–126. [DOI] [PubMed]
- 10.Tong A.H., Drees,B., Nardelli,G., Bader,G.D., Brannetti,B., Castagnoli,L., Evangelista,M., Ferracuti,S., Nelson,B., Paoluzi,S. et al. (2001) Systematic genetic analysis with ordered arrays of yeast deletion mutants. Science, 294, 2364–2368. [DOI] [PubMed]
- 11.Mewes H.W., Frishman,D., Gildener,U., Mannhaupt,G., Mayer,K., Mokrejs,M., Morgenstern,B., Munsterkotter,M. et al. (2002) MIPS: a database for genomes and protein sequences. Nucleic Acids Res., 30, 31–34. [DOI] [PMC free article] [PubMed]
- 12.Enright A.J., Iliopoulos,I., Kyrpides,N.C. and Ouzounis,C.A. (1999) Protein interaction maps for complete genomes based on gene fusion events. Nature, 402, 86–90. [DOI] [PubMed]
- 13.Marcotte E.M., Pellegrini,M., Ng,H.L., Rice,D.W., Yeates,T.O. and Eisenberg,D. (1999) Detecting protein function and protein–protein interactions from genome sequences. Science, 285, 751–753. [DOI] [PubMed]
- 14.Overbeek R., Fonstein,M., D’Souza,M., Pusch,G.D. and Maltsev,N. (1999) The use of gene clusters to infer functional coupling. Proc. Natl Acad. Sci. USA, 96, 2896–2901. [DOI] [PMC free article] [PubMed]
- 15.Dandekar T., Snel,B., Huynen,M. and Bork,P. (1998) Conservation of gene order: a fingerprint of proteins that physically interact. Trends Biochem. Sci., 23, 324–328. [DOI] [PubMed]
- 16.Pellegrini M., Marcotte,E.M., Thompson,M.J., Eisenberg,D. and Yeates,T.O. (1999) Assigning protein functions by comparative genome analysis: protein phylogenetic profiles. Proc. Natl Acad. Sci. USA, 96, 4285–4288. [DOI] [PMC free article] [PubMed]
- 17.Huynen M.A. and Bork,P. (1998) Measuring genome evolution. Proc. Natl Acad. Sci. USA, 95, 5849–5856. [DOI] [PMC free article] [PubMed]
- 18.Schwikowski B., Uetz,P. and Fields,S. (2000) A network of protein–protein interactions in yeast. Nat. Biotechnol., 18, 1257–1261. [DOI] [PubMed]
- 19.Hishigaki H., Nakai,K., Ono,T., Tanigami,A. and Takagi,T. (2001) Assessment of prediction accuracy of protein function from protein–protein interaction data. Yeast, 18, 523–531. [DOI] [PubMed]
- 20.Maslov S. and Sneppen,K. (2002) Specificity and stability in topology of protein networks. Science, 296, 910–913. [DOI] [PubMed]
- 21.Ge H., Liu,Z., Church,G.M. and Vidal,M. (2001) Correlation between transcriptome and interactome mapping data from Saccharomyces cerevisiae. Nature Genet., 29, 482–486. [DOI] [PubMed]
- 22.Fraser H.B., Hirsh,A.E., Steinmetz,L.M., Scharfe,C. and Feldman,M.W. (2002) Evolutionary rate in the protein interaction network. Science, 296, 750–752. [DOI] [PubMed]
- 23.Gibson D., Kleinberg,J. and Raghavan,P. (1998) Inferring Web communities from link topology. Proceedings of the 9th ACM Conference on Hypertext and Hypermedia. ACM Press, New York, NY.
- 24.Kleinberg J. (1998) Authoritative sources in a hyper-linked environment. Proceedings of the 9th ACM Conference on Hypertext and Hypermedia. ACM Press, New York, NY.
- 25.Bollobas B. (1998) Modern Graph Theory. Springer-Verlag, Inc., New York, NY, pp. 3–77.
- 26.Watts D.J. and Strogatz,S.H. (1998) Collective dynamics of ‘small-world’ networks. Nature, 393, 440–442. [DOI] [PubMed]
- 27.Tavazoie S., Hughes,J.D., Campbell,M.J., Cho,R.J. and Church,G.M. (1999) Systematic determination of genetic network architecture. Nature Genet., 22, 281–285. [DOI] [PubMed]
- 28.Wu L.F., Hughes,T.R., Davierwala,A.P., Robinson,M.D., Stoughton,R. and Altschuler,S.J. (2002) Large-scale prediction of Saccharomyces cerevisiae gene function using overlapping transcriptional clusters. Nature Genet., 31, 255–265. [DOI] [PubMed]
- 29.Harnpicharnchai P., Jakovljevic,J., Horsey,E., Miles,T., Roman,J., Rout,M., Meagher,D., Imai,B., Guo,Y., Brame,C.J. et al. (2001) Composition and functional characterization of yeast 66S ribosome assembly intermediates. Mol. Cell, 8, 505–515. [DOI] [PubMed]
- 30.Bassler J., Grandi,P., Gadal,O., Lessmann,T., Petfalski,E., Tollervey,D., Lechner,J. and Hurt,E. (2001) Identification of a 60S preribosomal particle that is closely linked to nuclear export. Mol. Cell, 8, 517–529. [DOI] [PubMed]
- 31.Dragon F., Gallagher,J.E., Compagnone-Post,P.A., Mitchell,B.M., Porwancher,K.A., Wehner,K.A., Wormsley,S., Settlage,R.E., Shabanowitz,J., Osheim,Y. et al. (2002) A large nucleolar U3 ribonucleoprotein required for 18S ribosomal RNA biogenesis. Nature, 417, 967–970. [DOI] [PMC free article] [PubMed]
- 32.Alberts B., Bray,D., Lewis,J., Raff,M., Roberts,K. and Watson,D.J. (1994) Molecular Biology of the Cell, 3rd Edn. Garland, New York, NY.
- 33.Lodish H., Berk,A., Zipursky,S.L., Matsudaira,P., Baltimore,D. and Darnell,J. (1995) Molecular Cell Biology, 3rd Edn. Scientific American Books, New York, NY.
Associated Data
This section collects any data citations, data availability statements, or supplementary materials included in this article.