Abstract
To investigate the role of clathrin in coated vesicle formation, a cell line with inducible expression of clathrin heavy chain (CHC) antisense RNA was produced. After 18 h of CHC antisense RNA expression, the internalization of transferrin was inhibited by 90%. Although the amount of CHC was reduced by only 10%, the frequency of clathrin-coated pits at the cell surface increased by a factor of 3–5, and clathrin-coated structures also accumulated on a pleiomorphic, multivesicular, endosomal compartment. Remarkably, the coated pits were connected to the cell surface by long, tubular necks wrapped by dynamin rings, and the level of dynamin in the CHC antisense RNA-expressing cells was up-regulated 10-fold. In contrast, the amount of several other proteins associated with clathrin coat formation was unaffected. Thus, this study demonstrates that CHC antisense RNA causes accumulation of clathrin-coated pits with dynamin rings around the neck in intact cells not transfected with dynamin mutants, suggesting the existence of a previously uncharacterized functional interplay between clathrin and dynamin.
Clathrin coats are involved in a variety of transport processes, and different ways to interfere with clathrin-dependent steps are of interest in elucidating mechanisms of coat and vesicle formation and in clarifying functions of clathrin coats on various organelles. At the plasma membrane, clathrin-coated pits are involved in uptake of receptors and ligands. Clathrin also is present in the trans-Golgi network and on lysosomes and endosomes (1, 2). In the perinuclear recycling compartment, clathrin may be involved in both transport to the Golgi apparatus (3) and transferrin receptor recycling (4). Flat clathrin-coated microdomains could function to sort ubiquitinated membrane proteins destined for degradation (5, 6). Furthermore, clathrin may be important for early endosome distribution (7).
The exact mechanism(s) involved in formation of clathrin-coated vesicles is not known, but molecules such as dynamin, endophilin, and epsin (8) all might be involved. Several approaches have been used to inhibit vesicle formation from clathrin-coated structures (9). Recently, overexpression of mutant proteins or protein domains has been used to block clathrin-dependent endocytosis, but this method is likely to affect more than one function. For instance, overexpression of mutant dynamin (K44A) will inhibit not only uptake from clathrin-coated pits but also other types of endocytosis (10). Futhermore, overexpression of protein domains might lead to low-affinity interactions that normally do not occur, thereby depleting the cytosol of interacting proteins required for other functions. It is therefore useful to apply methods based on different principles.
To investigate the importance of clathrin, we have established a cell line with inducible expression of clathrin heavy chain (CHC) antisense RNA. In the present article we demonstrate some unexpected results concerning regulation of dynamin levels and accumulation of clathrin-coated structures.
Materials and Methods
Materials.
Geneticin (G418) was obtained from Serva. Tetracycline (tet), puromycin, pronase, aprotinin, transferrin, Hepes, Na Mes, BSA, and lactose were obtained from Sigma. Na125I and Expre35S35S Protein Labeling Mix were obtained from Perkin–Elmer. Protein A Sepharose, protein G agarose, and [32P]dCTP were obtained from Amersham Biosciences. Transferrin was labeled by the iodogen method (11) to a specific activity of 20,000–30,000 cpm/ng. ImmunoPure NHS-SS-Biotin was obtained from Pierce, and Dynabead M-280 Streptavidin was obtained from IGEN International (Gaithersburg, MD). The following antibodies were used: goat anti-CHC (Santa Cruz Biotechnology), mouse anti-CHC (Research Diagnostics, Flanders, NJ), mouse anti-α-adaptin (AP2; Affinity BioReagents, Golden, CO), mouse anti-adaptin (AP1) and anti-tubulinα (Sigma), anti-cathepsin D (Zymed), anti-dynamin (Hudy 1; Upstate Biotechnology, Lake Placid, NY), anti-amphiphysin I (PharMingen), and anti-epidermal growth factor receptor pathway substrate clone (EPS)-15 and anti-clathrin light chain (Covance Research Products). Anti-epsin and anti-endophilin were a kind gift from P. De Camilli (Yale University, New Haven, CT). The cDNA for CHC was generously provided by T. Kirchhausen (Harvard University, Boston). The plasmid containing hemagglutinin-tagged dynamin 2 wild type was kindly provided by S. L. Schmid (The Scripps Research Institute, La Jolla, CA).
Cells.
The BHK21-tTA cell line, kindly provided by A. Wandinger-Ness (University of New Mexico School of Medicine, Albuquerque) (12), was grown in complete DMEM (Flow Laboratories) supplemented with 7.5% FCS, 2 mM L-glutamine, 100 units/ml penicillin, 100 μg/ml streptomycin, and 200 μg/ml geneticin. Stable BHK21-tTA/anti-CHC cells were maintained in select DMEM (complete DMEM containing 200 ng/ml puromycin and 2 μg/ml tet). For induction of CHC antisense RNA expression, tet was removed from the medium.
Plasmid Constructs.
The entire coding region of rat CHC cDNA (13) was cloned into pLITMUS (New England Biolabs) and, further, into the expression plasmid pTet-Splice (GIBCO/BRL) in the antisense orientation, giving the construct paCHC.
Generation of a Stable Cell Line.
The BHK21-tTA/anti-CHC cell line was generated by transfection of subconfluent BHK21-tTA cells (12) with 10 μg of paCHC and 1 μg of the plasmid pBSpac, which contains the puromycin resistant gene (14), by using the transfection reagent DOTAP (Roche Molecular Biochemicals) according to the manufacturer's instructions. After transfection, the cells were allowed to recover in complete DMEM for 24 h before passage and transfer to complete DMEM containing 1 μg/ml puromycin. Individual BHK21-tTA/anti-CHC clones were isolated, and transferrin endocytosis was measured. A selected clone of BHK21-tTA/anti-CHC was subcloned by limited dilution.
Western Blot Analysis.
For analysis of clathrin and tubulin (as internal standard), cells were scraped off the plastic and lysed in Mes buffer (0.1 M Mes, pH 6.5/0.5 mM MgCl2/1 mM EGTA/20 μM leupeptin/1 mM PMSF/0.2% Triton X-100). Samples were resolved on a 7.5% SDS/PAGE gel under reducing conditions. The proteins were transferred to nitrocellulose (Schleicher & Schuell), and the membrane was blocked with 5% nonfat dry milk in PBS containing 0.05% Tween 20. For analysis of the different accessory proteins playing a role in clathrin-coated pit formation, cells were solubilized in RIPA buffer (50 mM Tris⋅HCl, pH 7.8/150 mM NaCl/1% deoxycholate/0.1% SDS/1.5% Triton X-100) supplemented with the Complete protease inhibitor mixture (Roche Diagnostics). Samples were resolved on 10–12.5% SDS/PAGE gels, and the proteins were transferred to poly(vinylidene difluoride) membranes (Millipore). The filters were incubated with primary antibodies in blocking solution for 1 h at room temperature, washed three times for 10 min with 0.05% Tween 20, and finally incubated with secondary antibodies conjugated to horseradish peroxidase for 45 min at room temperature. The results were developed with a chemiluminescent detection kit (Pierce).
Metabolic Labeling of Cells and Immunoprecipitation.
The cells were starved for 30 min in DMEM lacking Met/Cys. [35S]Met/[35S]Cys (Expre35S35S label) was added to the medium (75 μCi/ml; 1 Ci = 37 GBq), and the cells were incubated for another 30 min. The cells were then scraped off and lysed in a Mes buffer containing 0.2% Triton X-100 (see Western Blot Analysis). The cell lysate was aspirated six times through a 21-gauge needle, incubated on ice for 20 min, and centrifuged at 6,800 × g for 10 min at 4°C. The protein concentration in the supernatant was determined by using the Protein Assay kit (Bio-Rad). One hundred micrograms of total protein was immunoprecipitated with goat anti-CHC (30 μl) bound to protein G agarose (25 μl) for 24 h at 4°C on a rotating platform. Immunocomplexes were washed four times with 500 μl of TBS buffer (50 mM Tris, pH 7.6/0.5M NaCl), resuspended in sample buffer, and separated on a 7.5% SDS/PAGE gel under reducing conditions.
For degradation experiments, cells were plated and incubated overnight before they were transferred to Met- and Cys-free medium. A mixture of [35S]Met/[35S]Cys (10 μCi/ml) was added, and the cells were incubated for another 24 h in the presence of tet. The cells then were incubated in normal medium without tet, in the presence or absence of lactacystin (10 μM) for 24 h. Cell lysates were prepared, and CHC was immunoprecipitated, as described above. Radioactive bands were visualized by fluorography, and quantification was performed by using a scanning densitometer.
The rate of dynamin synthesis was measured by a metabolic pulse labeling experiment. Cells grown for 2 days with or without tet were Met/Cys-starved for 30 min. Then they were pulsed with [35S]Met/[35S]Cys (75 μCi/ml) for 30 min and chased in complete DMEM/10% FCS for 10 min. The cells were lysed in RIPA buffer and centrifuged at 3,800 × g for 10 min. Cell lysates were incubated with 20 μl of protein A Sepharose prebound to anti-dynamin (5 μl of Hudy 1). Immunocomplexes were washed with RIPA buffer and resolved by using a 10% SDS/PAGE gel. The gel was exposed to PhosphorImager screens and analyzed by using phosphorimager and imagequant software (Molecular Dynamics).
Measurements of Endocytosis and Recycling.
Endocytosis of transferrin was measured after a 5-min incubation at 37°C with 125I-transferrin (≈100 ng/ml) in Hepes medium. The cells were washed with ice-cold Hepes and then treated with pronase (2 mg/ml) in Hepes medium for 1 h on ice. The cells were removed from the incubation medium by centrifugation, and the radioactivity in the cell pellet (endocytosed transferrin) and in the supernatant (surface-bound transferrin) was measured. Recycling of transferrin was measured by using TAG- and biotin-labeled transferrin as described (15).
Sorting and Processing of Cathepsin D.
The assay was performed as described (25): The cells were starved for Met/Cys for 30 min, pulsed with [35S]Met/[35S]Cys for 30 min, and chased for various time periods in the presence of mannose-6-phosphate (5 mM) to inhibit endocytosis of released enzyme. Metabolically labeled cathepsin D was immunoprecipitated from cell lysates and media. The relative amounts of procathepsin D and mature forms of cathepsin D were determined by SDS/PAGE, autoradiography, and densitometry.
Electron Microscopy.
The cells were washed with PBS and fixed with 0.1% glutaraldehyde and 2% formaldehyde in 0.1 M phosphate buffer, pH 7.2, followed by dehydration and embedding in Epon. Alternatively, the fixed cells were processed for ultracryosections and subsequent ImmunoGold labeling to localize dynamin (16). In some experiments, cells were fixed in the presence of ruthenium red (0.5 mg/ml) before they were washed and embedded in Epon (16). Finally, some cells were incubated for 1 h at 37°C with horseradish peroxidase (5 mg/ml; Sigma type II) before fixation as described (16). Sections were analyzed with a Philips 100 CM electron microscope (Eindhoven, The Netherlands).
RNA Preparation and Northern Blot Analysis.
Total RNA was isolated by using the RNeasy mini kit (Qiagen), was run on a 1% agarose gel with formaldehyde, and finally was blotted onto a Hybond-N membrane (Amersham Biosciences). The probe for dynamin 2 detection was generated by labeling the entire cDNA of dynamin 2 with Redivue [α-32P]dCTP by using the Random Primers DNA labeling system (Invitrogen). Hybridization was done overnight at 60°C.
Results and Discussion
Synthesis of CHC Is Reduced in Cells Expressing CHC Antisense RNA.
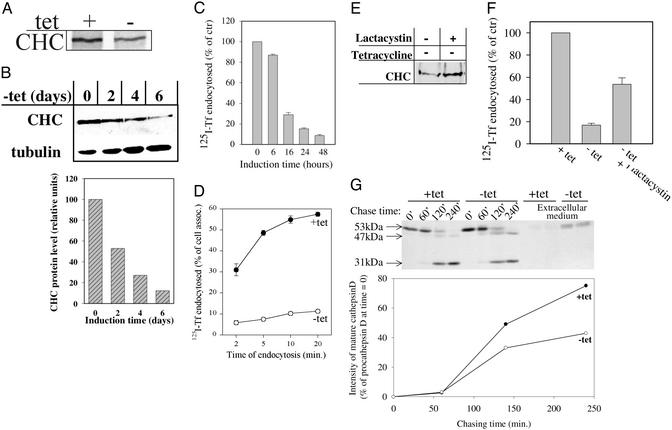
Here we have used a tet-controlled expression system that is tightly regulated (17) to produce BHK cells with inducible expression of CHC antisense RNA. The maximum level of expression of the inserted gene in this system is ≈48 h (12, 18). The synthesis of CHC in different experiments was reduced by 25–40% after 48 h of CHC antisense RNA expression (Fig. 1A). As shown by Western blot analyses, the protein level was reduced by 50% after 2 days of induction, and after 4 days of induction the level was reduced to 28% (Fig. 1B). In this experiment we used an anti-CHC that recognized an epitope close to the C-terminal end of the protein. The reduction of CHC was similar when an anti-CHC against the N-terminal part of the protein was used (data not shown). After 24 h of induction, a reduction in the CHC level was barely detectable, a finding that agrees with earlier results demonstrating that the half-life of CHC is rather long (19). Furthermore, total RNA was extracted from cells grown in the absence or presence of tet for 2 and 4 days. After 2 days, the reduction in the endogenous CHC mRNA level was ≈50% of control cells. After 4 days there was no detectable CHC mRNA (data not shown).
Figure 1.
Effect of CHC antisense RNA on clathrin and clathrin-dependent trafficking in the BHK21-tTA/anti-CHC cells. (A) Cells grown with or without tet for 2 days were pulse-labeled with [35S]Met/[35S]Cys for 30 min and solubilized. The lysates were immunoprecipitated with goat anti-CHC, and the precipitates were analyzed by SDS/PAGE (7.5% gel) and autoradiography. (B) Cells were grown in the absence of tet for indicated time points and lysed, and equal volumes of the lysates were separated on a 7.5% SDS/PAGE gel. The gel was subjected to Western blot analysis probing with goat anti-CHC antibody and with anti-tubulinα antibody (as internal standard). The film was scanned by densitometry and normalized against tubulin. (C) Cells were grown in the absence of tet for indicated time points and transferred to Hepes medium. 125I-transferrin was added to the cells and endocytosed for 5 min. (D) Cells were grown with or without tet for 2 days. Then the endocytosis of 125I-transferrin for the indicated times was measured. (E) The cells were [35S]Cys/[35S]Met-labeled for 24 h in the presence of tet and further incubated in medium without tet and ± lactacystin for 24 h. CHC was immunoprecipitated with anti-CHC, and the precipitates were analyzed on a 7.5% SDS/PAGE gel. (F) Cells were induced to express CHC antisense RNA for 24 h ± lactacystin, and 125I-transferrin endocytosis during a 5-min incubation at 37°C was measured. (G) Cells were grown with or without tet for 2 days and metabolically labeled. At the indicated chasing times the cells were lysed, and cathepsin D was immunoprecipitated from the lysate and the medium. The precipitates were analyzed on a 12.5% SDS/PAGE gel. The gel then was subjected to autoradiography and densitometric quantification.
Transferrin Trafficking in CHC Antisense RNA-Producing Cells.
Transferrin endocytosis was inhibited significantly after 16 h of CHC antisense RNA expression, and after 48 h the transferrin endocytosis was reduced by 90–95% (Fig. 1 C and D). This level remained constant when the cells were incubated for up to 6 days (data not shown). The inhibition of transferrin endocytosis was accompanied by an increased binding of transferrin (2- to 3-fold) at the plasma membrane (data not shown), suggesting that recycling of the internalized transferrin receptor continued although the uptake became blocked.
The rapid inhibition of transferrin uptake could be due to partial cleavage of clathrin molecules that might interfere (possibly in a dominant negative manner) with the formation of clathrin-coated vesicles. We therefore investigated whether lactacystin, an inhibitor of proteolysis, could counteract degradation of clathrin and the inhibition of transferrin endocytosis, and indeed this was the case. A pulse–chase experiment showed that incubation with lactacystin decreased the degradation of clathrin (Fig. 1E). Western blot analysis revealed an increased clathrin level when cells were grown without tet and in the presence of lactacystin (data not shown). Furthermore, the reduction in transferrin endocytosis was partially abrogated by lactacystin (Fig. 1F). Lactacystin is an inhibitor of proteasomes (20) and of a newly characterized giant protease, tripeptidyl peptidase II (TPPII), possessing both the ability to remove tripeptides from the N terminus and an endoprotease activity (21). Although the effect of lactacystin might be indirect, the data are compatible with the idea that proteolytic processing of preexisting clathrin molecules might be involved in inhibition of clathrin-dependent endocytosis.
Effect of CHC Antisense RNA Expression on Transport and Maturation of Cathepsin D.
The lysosomal hydrolase cathepsin D is normally transported by a clathrin-dependent pathway from the Golgi apparatus to endosomes, where it is processed to a mature form. To test whether this pathway was affected by expression of CHC antisense RNA, we studied the kinetics of procathepsin D maturation. Induced expression of CHC antisense RNA inhibited the formation of mature cathepsin D by 50% after a 4-h chase (Fig. 1G), and there was a 5-fold increase in extracellular secretion of procathepsin D (Fig. 1G). Furthermore, the rate of procathepsin D synthesis was increased ≈2-fold. Lysosomes seemed normal by electron microscopy after 2 days of CHC antisense RNA induction, probably because of the high stability of lysosomal enzymes. However, 4 days of induction led to formation of very large lysosomes containing a lot of internal membrane (data not shown). Their formation is most likely a consequence of impaired transport/maturation of lysosomal enzymes.
CHC Antisense RNA Leads to Accumulation of Clathrin-Coated Pits at the Cell Surface and on Endosomes.
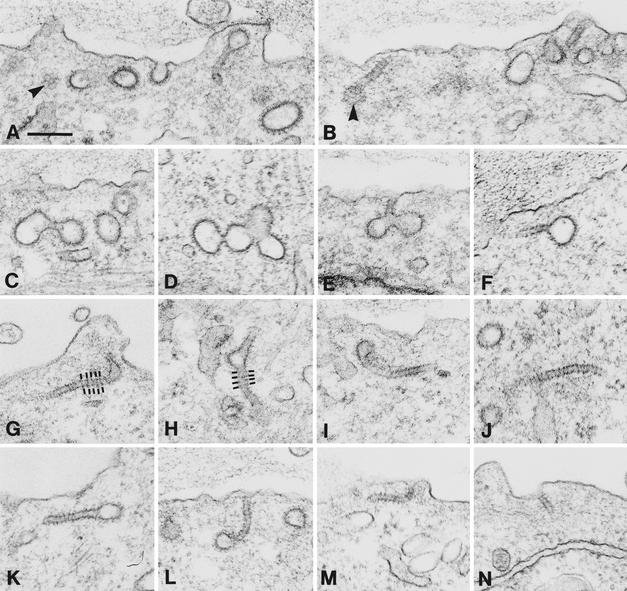
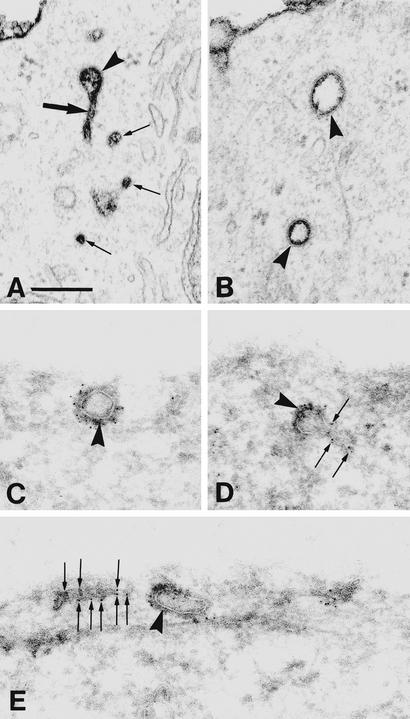
The effect of CHC antisense RNA expression on clathrin-associated structures at the plasma membrane and on endosomes was examined at the ultrastructural level. Numerous clathrin-coated pits and vesicular profiles were noticed at the cell surface (Fig. 2). The clathrin coats appeared structurally normal, even when cut tangentially, where the characteristic honeycomb-like pattern was evident (Fig. 2 A and B). Their diameter varied from 80 to 150 nm. They often formed aggregates (Fig. 2 C–E) and appeared to be connected to the cell surface by long tubules (necks) with a diameter of 25–30 nm. These tubules often showed a cross-striation with a periodicity of ≈20 nm (Fig. 2). It turned out that virtually all clathrin-coated profiles at the cell surface were indeed connected to the cell surface, because they were stained by ruthenium red added during fixation (Fig. 3 A and B). Small vesicular profiles with a diameter of ≈30 nm were often also stained by ruthenium red. These may represent cross-sectioned tubules. There appeared to be roughly one striated tubule per three to four clathrin-coated vesicular profiles. However, whereas the clathrin-coated vesicular profiles are readily identified no matter the section plane, the striated tubules can be identified unequivocally only in longitudinal sections. Because many tubules will be cross-sectioned, we find it likely that there is close to one tubule per clathrin-coated pit or aggregate of pits. The number of clathrin-coated structures at the cell surface in CHC antisense RNA-expressing cells from 2 to 6 days of induction was quantified and found to be 3- to 5-fold higher than in control cells (Table 1). Similarly, the number of striated tubules appeared constant from 2 to 6 days of induction. Thus, CHC still present at this time is able to form coat structures, but the coated pits cannot pinch off. Whether these coated structures contain some partially cleaved molecules interfering with normal clathrin function is not known. The first signs of multiple coated pit structures and some formation of striated tubules were noticed after 18 h of CHC antisense RNA induction, suggesting that their formation correlated with inhibition of endocytosis.
Figure 2.
Representative examples of clathrin-coated vesicular structures at the cell surface of BHK21-tTA/anti-CHC cells expressing CHC antisense RNA for 2–4 days. The clathrin-coated structures often form clusters. Moreover, they are frequently connected to the cell surface by long tubules. These tubules show a cross-striation (indicated in G and H). Arrowheads in A and B show the characteristic honeycomb-like pattern of tangentially sectioned clathrin-coated pits/vesicles. (Bar = 200 nm.)
Figure 3.
(A and B) Representative examples of the peripheral cytoplasm of BHK21-tTA/anti-CHC cells expressing CHC antisense RNA (without tet for 2 days) and fixed in the presence of ruthenium red. Note the ruthenium red-stained clathrin-coated profiles (arrowheads). One such profile is associated with a tubule (large arrow in A); several very small vesicular profiles, which may actually represent cross-sectioned tubules, are also shown (small arrows in A). (C–E) Ultracryosections of the cells expressing CHC antisense RNA (for 3 days). The sections are ImmunoGold-labeled (with Hudy 1 followed by 5-nm gold particles) to identify dynamin, which is present not only on clathrin-coated vesicular profiles (arrowheads) but also on tubular structures (arrows). (Bar = 200 nm.)
Table 1.
Expression of CHC antisense RNA increases the number of clathrin coats associated with the cell surface
| Growth conditions | No. of clathrin-coated profiles per 100 μm of cell surface | No. of cell profiles examined |
|---|---|---|
| + tet, 48 h | 6.1 ± 2.1 | 11 |
| − tet, 48 h | 20.1 ± 5.3 | 9 |
| − tet, 96 h | 24.4 ± 5.2 | 14 |
| − tet, 144 h | 29.4 ± 11.0 | 5 |
Cells were grown with (+) or without (−) tet for the indicated times. Values shown are mean ± SD.
The cross-striated 20- to 30-nm tubules connecting the clathrin-coated pits to the cell surface in CHC antisense RNA-expressing cells resemble the dynamin-wrapped necks of clathrin-coated structures found in permeabilized synaptosomes after incubation with guanosine 5′-[γ-thio]triphosphate (22), or upon overexpression of mutant dynamin (8). Thus, we incubated ultracryosections of CHC antisense RNA-expressing cells with an anti-dynamin antibody (Hudy 1). This antibody not only labeled the clathrin coats as reported (16, 18), but also the tubular structures (Fig. 3 C–E). Thus, in CHC antisense RNA-expressing cells, clathrin-coated pits accumulated at the cell surface, connected to the plasma membrane via long, dynamin-wrapped necks. The reason for this phenotype is not obvious but could depend on, although it is not caused by, the increased expression of endogenous dynamin (see below).
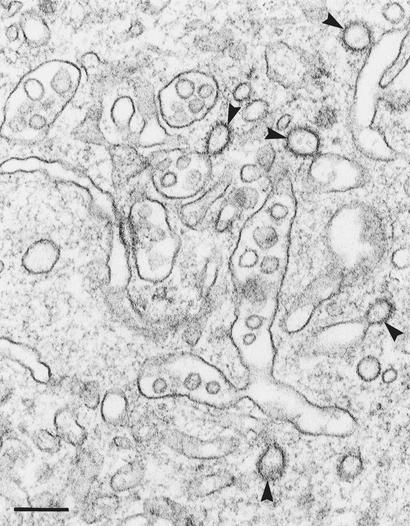
Another striking structural effect of antisense-CHC expression was a highly pleiomorphic, multivesicular compartment (Fig. 4). This compartment was not associated with the cell surface, because it was not stained after fixation with ruthenium red (data not shown). In contrast, it contained internalized horseradish peroxidase (data not shown), and we therefore consider it a modified endosome compartment. This multivesicular compartment was associated with numerous 70- to 120-nm clathrin-coated vesicular structures (which were rarely observed on endosomes in control cells) (Fig. 4). This image is reminiscent of images observed in shibire nerve terminals during recovery from a temperature block (23). Interestingly, in contrast to the situation at the plasma membrane, the endosome-associated clathrin-coated pits never showed tubular neck or ring structures, even though a high level of dynamin was present in the cytosol (see below), suggesting differences in the mechanism of vesicle formation at the two donor membranes. Despite accumulation of clathrin on endosomes, endocytosed transferrin seemed to be exocytosed at a normal rate (data not shown).
Figure 4.
BHK21-tTA/anti-CHC cells expressing CHC antisense RNA (without tet for 4 days). Note the numerous clathrin-coated buds (arrowheads) on the pleiomorphic, multivesicular compartment. (Bar = 200 nm.)
Dynamin Synthesis Is Increased upon CHC Antisense RNA Expression.
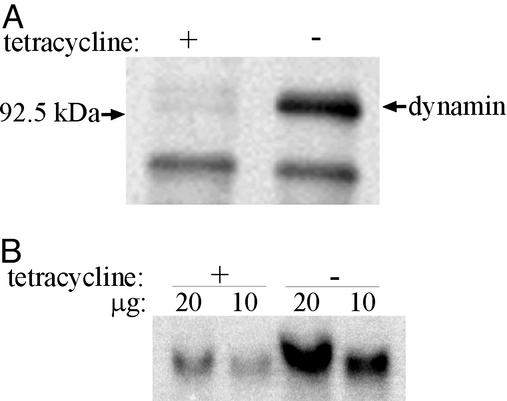
The observation of accumulated clathrin-coated pits in the CHC antisense RNA cells made us investigate expression levels of different proteins participating in clathrin-coated vesicle formation (24). Western blot analysis revealed that the steady-state level of dynamin was increased ≈20-fold, whereas there was no change in the other proteins investigated (clathrin light chain, AP1, AP2, Eps15, epsin, amphiphysin, and endophilin; data not shown). Furthermore, the synthesis of dynamin was found to be up-regulated ≈10-fold as determined by a metabolic pulse experiment (Fig. 5A). This increase also was reflected in different Northern blot analysis experiments. An ≈5-fold higher level of dynamin 2 mRNA in the CHC antisense RNA-expressing cells is demonstrated in Fig. 5B. Interestingly, the time course of this increased level of dynamin corresponded to the time course of the inhibition of transferrin endocytosis (data not shown), as if the cells tried to counteract the inhibition of clathrin-dependent endocytosis. Such an up-regulation might be required for formation of dynamin rings in the cells studied here, but it is clearly not the explanation for this phenotype. Immunofluorescence microscopy of the uninduced BHK21-tTA/anti-CHC cells transiently overexpressing hemagglutinin-tagged dynamin 2 wild type displayed no inhibition in uptake of Cy3-labeled transferrin (data not shown). This agrees with previous studies of wild-type dynamin overexpression (18).
Figure 5.
Expression of dynamin is increased in the CHC antisense RNA cells. (A) Increased rate of dynamin synthesis. The cells were grown with or without tet for 2 days. Then they were pulse-labeled with [35S]Met/[35S]Cys (30 min) and solubilized. Dynamin was immunoprecipitated and resolved on a 10% SDS/PAGE gel. (B) Northern blot analysis of dynamin 2 mRNA. Total cellular RNA was isolated from cells grown with or without tet for 2 days, and 10 and 20 μg of each RNA sample, as indicated, were loaded onto a 1% agarose/formaldehyde gel and blotted onto a nylon membrane. Hybridization was carried out at 60°C with a labeled cDNA probe for dynamin 2. Band intensities on the blot were quantified with a PhosphorImager.
In conclusion, despite an increased level of dynamin in the cells expressing CHC antisense RNA, dynamin at the neck of clathrin-coated pits in our CHC antisense RNA cells is not sufficient for release of vesicles. The function of dynamin in fission might require a critical level of clathrin or recently synthesized intact clathrin. Interestingly, our data suggest a new and unexpected link between synthesis of CHC and dynamin.
Acknowledgments
We thank Jorunn Jacobsen, Anne-Grethe Myrann, Ulla Hjortenberg, Mette Ohlsen, Keld Ottosen, and Kirsten Pedersen for expert technical assistance. This work was supported by the Norwegian and the Danish Cancer Societies, the Norwegian Research Council for Science and the Humanities, the Danish Medical Research Council, the Novo Nordisk Foundation, the Jahre Foundation, and the Jeanette and Søren Bothners Legacy.
Abbreviations
- CHC
clathrin heavy chain
- tet
tetracycline
Footnotes
This paper was submitted directly (Track II) to the PNAS office.
See commentary on page 4981.
References
- 1.Traub L M, Bannykh S I, Rodel J E, Aridor M, Balch W E, Kornfeld S. J Cell Biol. 1996;135:1801–1814. doi: 10.1083/jcb.135.6.1801. [DOI] [PMC free article] [PubMed] [Google Scholar]
- 2.Stoorvogel W, Oorschot V, Geuze H J. J Cell Biol. 1996;132:21–33. doi: 10.1083/jcb.132.1.21. [DOI] [PMC free article] [PubMed] [Google Scholar]
- 3.Johannes L, Goud B. Traffic. 2000;1:119–123. doi: 10.1034/j.1600-0854.2000.010204.x. [DOI] [PubMed] [Google Scholar]
- 4.van Dam E M, Stoorvogel W. Mol Biol Cell. 2002;13:169–182. doi: 10.1091/mbc.01-07-0380. [DOI] [PMC free article] [PubMed] [Google Scholar]
- 5.Raiborg C, Bache K G, Gillooly D J, Madshus I H, Stang E, Stenmark H. Nat Cell Biol. 2002;4:394–398. doi: 10.1038/ncb791. [DOI] [PubMed] [Google Scholar]
- 6.Sachse M, Urbe S, Oorschot V, Strous G J, Klumperman J. Mol Biol Cell. 2002;13:1313–1328. doi: 10.1091/mbc.01-10-0525. [DOI] [PMC free article] [PubMed] [Google Scholar]
- 7.Bennett E M, Lin S X, Towler M C, Maxfield F R, Brodsky F M. Mol Biol Cell. 2001;12:2790–2799. doi: 10.1091/mbc.12.9.2790. [DOI] [PMC free article] [PubMed] [Google Scholar]
- 8.Marks B, Stowell M H, Vallis Y, Mills I G, Gibson A, Hopkins C R, McMahon H T. Nature. 2001;410:231–235. doi: 10.1038/35065645. [DOI] [PubMed] [Google Scholar]
- 9.Sandvig K, van Deurs B. Annu Rev Cell Dev Biol. 2002;18:1–14. doi: 10.1146/annurev.cellbio.18.011502.142107. [DOI] [PubMed] [Google Scholar]
- 10.Lamaze C, Dujeancourt A, Baba T, Lo C G, Benmerah A, Dautry-Varsat A. Mol Cell. 2001;7:661–671. doi: 10.1016/s1097-2765(01)00212-x. [DOI] [PubMed] [Google Scholar]
- 11.Fraker P J, Speck J C., Jr Biochem Biophys Res Commun. 1978;80:849–857. doi: 10.1016/0006-291x(78)91322-0. [DOI] [PubMed] [Google Scholar]
- 12.Press B, Feng Y, Hoflack B, Wandinger-Ness A. J Cell Biol. 1998;140:1075–1089. doi: 10.1083/jcb.140.5.1075. [DOI] [PMC free article] [PubMed] [Google Scholar]
- 13.Kirchhausen T, Harrison S C, Chow E P, Mattaliano R J, Ramachandran K L, Smart J, Brosius J. Proc Natl Acad Sci USA. 1987;84:8805–8809. doi: 10.1073/pnas.84.24.8805. [DOI] [PMC free article] [PubMed] [Google Scholar]
- 14.de la Luna S, Soria I, Pulido D, Ortin J, Jimenez A. Gene. 1988;62:121–126. doi: 10.1016/0378-1119(88)90585-9. [DOI] [PubMed] [Google Scholar]
- 15.Skretting G, Torgersen M L, van Deurs B, Sandvig K. J Cell Sci. 1999;112:3899–3909. doi: 10.1242/jcs.112.22.3899. [DOI] [PubMed] [Google Scholar]
- 16.Nicoziani P, Vilhardt F, Llorente A, Hilout L, Courtoy P J, Sandvig K, van Deurs B. Mol Biol Cell. 2000;11:481–495. doi: 10.1091/mbc.11.2.481. [DOI] [PMC free article] [PubMed] [Google Scholar]
- 17.Gossen M, Bujard H. Proc Natl Acad Sci USA. 1992;89:5547–5551. doi: 10.1073/pnas.89.12.5547. [DOI] [PMC free article] [PubMed] [Google Scholar]
- 18.Damke H, Baba T, Warnock D E, Schmid S L. J Cell Biol. 1994;127:915–934. doi: 10.1083/jcb.127.4.915. [DOI] [PMC free article] [PubMed] [Google Scholar]
- 19.Acton S L, Brodsky F M. J Cell Biol. 1990;111:1419–1426. doi: 10.1083/jcb.111.4.1419. [DOI] [PMC free article] [PubMed] [Google Scholar]
- 20.Fenteany G, Standaert R F, Lane W S, Choi S, Corey E J, Schreiber S L. Science. 1995;268:726–731. doi: 10.1126/science.7732382. [DOI] [PubMed] [Google Scholar]
- 21.Geier E, Pfeifer G, Wilm M, Lucchiari-Hartz M, Baumeister W, Eichmann K, Niedermann G. Science. 1999;283:978–981. doi: 10.1126/science.283.5404.978. [DOI] [PubMed] [Google Scholar]
- 22.Takei K, McPherson P S, Schmid S L, De Camilli P. Nature. 1995;374:186–190. doi: 10.1038/374186a0. [DOI] [PubMed] [Google Scholar]
- 23.Koenig J H, Ikeda K. J Neurosci. 1989;9:3844–3860. doi: 10.1523/JNEUROSCI.09-11-03844.1989. [DOI] [PMC free article] [PubMed] [Google Scholar]
- 24.Takei K, Haucke V. Trends Cell Biol. 2001;11:385–391. doi: 10.1016/s0962-8924(01)02082-7. [DOI] [PubMed] [Google Scholar]
- 25.Satin B, Norais N, Telford J, Rappuoli R, Murgia M, Montecucco C, Papini E. J Biol Chem. 1997;272:25022–25028. doi: 10.1074/jbc.272.40.25022. [DOI] [PubMed] [Google Scholar]


