Abstract
Cells attaching to an extracellular matrix through integrins flatten out (spread) on the matrix, eliciting cellular signals needed for survival. We show that the shape of the nucleus changes and the nuclear calcium level increases in spreading cells. Moreover, cell spreading and osmotic stretching of isolated nuclei cause release of perinuclear Ca2+, and patch clamping of nuclei reveals stretch-activated Ca2+ permeable channels. Gene expression assays with myocyte enhancer factor 2, which is activated by calmodulin-dependent kinase IV, indicate that the elevation in nuclear Ca2+ is functionally significant. We propose a mechano-transduction pathway in which spreading-induced nuclear stretching releases Ca2+ from the perinuclear space, and the resulting Ca2+ elevation in the nucleus provokes changes in gene expression.
Extracellular matrix (ECM) is a protein meshwork that serves as a scaffold for cell attachment and spreading. ECM activates intracellular signaling pathways via cell surface integrin receptors and influences a wide range of cell functions, including survival, proliferation, and differentiation (1). The spreading of cells on a substrate also causes tension-dependent changes in cell shape that are closely linked to gene expression, growth regulation, and survival (2). Integration of signals from chemical and mechanical input is likely to be important in the regulation of these cellular functions. Mechanical forces applied on a cell at the cell membrane activate various signaling pathways in the cytoplasm, including those involving mitogen-activated protein kinase, cAMP, and Rho (3–5), and they generate ion fluxes through stretch-activated ion channels located in the plasma membrane (6). A physical connection between the ECM, cytoskeletal network, and nucleus may trigger signals in the nucleus in response to mechanical force (7–9). Nuclear Ca2+ could potentially control gene expression through the activation of calmodulin-dependent kinase IV and the consequent phosphorylation of transcription factors such as cAMP responsive element binding protein (CREB) and myocyte enhancer factor 2 (MEF2). CREB and MEF2 are of critical importance in the plasticity and differentiation of several cell types including neurons and cardiomyocytes (10–13). We hypothesized that a mechanical connection from integrins attaching to an ECM substrate might operate through Ca2+ transients in the nucleus.
We have used Ca2+ indicators to investigate nuclear Ca2+ dynamics under conditions that induce shape changes and distention of the nucleus. We used yellow cameleons (YCs) (14, 15) to monitor both nuclear and endoplasmic reticulum (ER) Ca2+ transients. The cameleons are genetically engineered Ca2+ sensors bearing subcellular localization signals. Their reporter function is based on the binding of Ca2+ to a calmodulin domain that results in conformational change that binds two fluorescent protein modules to a closer proximity, allowing fluorescence resonance energy transfer. The ratio of fluorescence at two wavelengths changes in response to the concentration of Ca2+. We show here that the nuclear shape change caused by cell spreading and direct mechanical stretching of isolated nuclei are both accompanied by a release of Ca2+ from the perinuclear space (the nuclear envelope and perinuclear ER) and a concomitant increase of Ca2+ in the nuclear interior and cytoplasm. We also find a mechano-sensitive Ca2+ channel in the nuclear membrane that may be responsible for this Ca2+ release. As nuclear Ca2+ can regulate gene expression, these results support the hypothesis that mechanical forces exerted on a cell may control gene expression and delineate a pathway for such regulation.
Methods
Cameleon Constructs and Transfection.
YC-2.1NU with nuclear localization signal, YC-2.1ER and YC-4ER with the signal peptide from calreticulin, and an ER retention signal were created by PCR modification from YC-2 and YC-3 as described (14, 15). These YC constructs were cloned into a bicistronic expression vector and transfected into MC3T3-E1 cells (RIKEN Cell Bank, Tsukuba, Japan) by using FuGENE 6 transfection reagent (Roche Molecular Biochemicals). Stable transfectants were selected by culturing in αMEM containing 10% FCS and 0.5 mg/ml G418, and then pooled. High expressing cells (5% of total cell population) were enriched from the G418-resistant cell pools by FACStar cell sorting (Becton Dickinson).
Cell Attachment.
To prepare substrates for cell attachment and spreading, glass-bottom dishes were coated with 10 μg/ml human plasma fibronectin, 100 μg/ml poly-l-lysine, 100 μg/ml monomer collagen (Vitrogen 100, Celtrix Laboratories, Palo Alto, CA) at room temperature for at least 3 h or with polymerized collagen fibrils prepared by neutralizing the collagen solution (final concentration 1 mg/ml). The coated dishes were treated with 3% BSA to block any remaining protein binding sites and used for cell spreading experiments.
Real-Time Fluorescence and Calcium Imaging.
To monitor nuclear shape, we imaged fluorescence emission from the YC dye, YC-2.1NU, which was located exclusively in the nucleus. Fluorescent images (emission wavelength of 530 nm) were obtained at an excitation wavelength of 488 nm by using a laser scanning confocal microscope MRC-1024 MP (Bio-Rad) with a PlanFluor ×40, NA0.75 objective (Nikon). Transfected cells were suspended in serum-free medium and placed in a glass bottom dish precoated with ECM proteins for the analysis. Photo bleaching and cell damage were minimized by setting the intensity of the laser to 3% of the maximum power. All experiments were performed at 37°C on a chamber platform connected to a heat controller (Warner Instruments, Hamden, CT). Three-dimensional images were constructed from a series of 60–80 serial confocal sections at intervals of 0.3 μm. Quantitative 3D analyses of the nuclei were performed with AUTOVISUALIZE-3D software (AutoQuant Imaging, Watervliet, NY).
Intracellular store [Ca2+] was measured by emission ratio imaging using YC-4ER or YC-2.1NU, as described (16). Stable transfectants expressing YC-4ER or YC-2.1NU were imaged at 37°C on a Zeiss axiovert 100 M equipped for epifluorescence microscopy, using a ×63, 1.4 numerical aperture oil objective (Zeiss), 430 ± 10-nm excitation filter (Chroma Technology, Brattleboro, VT), and two emission filters (535DF30 and 470DF30) controlled by a filter wheel. Images were acquired on a cooled charge-coupled device camera controlled by slidebook deconvolution software (Intelligent Imaging Innovations, Denver) and stored on optical disks for later analysis. After background subtraction, the YC-4ER fluorescence ratio R (535/470 nm) was calibrated for the [Ca2+] by using the equation, Kd value, and Hill coefficient as described (14, 17). Rmax was obtained in the presence of 10 μM ionomycin and 20 mM CaCl2, and Rmin was obtained in the presence of 10 μM ionomycin and 20 mM EGTA. A previously described approach (16) to reduce photo bleaching and photo chromism of the cameleons was used in producing the fluorescent images (16). The length of each acquisition was 100 ms. All experiments were performed at 37°C on a heat-controlled chamber platform (Warner Instruments).
To monitor the spatial patterns of [Ca2+] in the ER, dual-emission ratio imaging of YC-4ER was performed at an excitation wavelength of 815 nm under a two-photon excitation microscope (Bio-Rad) equipped with a Fluor ×60, 1.4 numerical aperture oil objective (18). The microscope was equipped with a MaiTai laser (Spectra-Physics), an Eclipse TE300 microscope (Nikon) with dichroic mirrors (500DRLP), and two emission filters (485DF22 for enhanced cyan fluorescent protein and 525DF40 for enhanced yellow fluorescent protein, Chroma Technology). The output laser beam, with an average power of 0.7 W, was vertically polarized. The output was stored and processed with RTS2000 software. All experiments were performed at 37°C. Digital imaging of intracellular cytoplasmic [Ca2+] with fura-2 or nuclear [Ca2+] with indo-1-dextran was accomplished by using standard methods.
Isolation of Nuclei.
Intact nuclei from MC3T3-E1 cells were isolated as described (19). Briefly, cells were homogenized in cold TKM/sucrose solution (50 mM Tris⋅HCl, pH 7.5, with 25 mM KCl, 5 mM MgCl2, and 0.25 mM sucrose). The homogenate was then filtered and centrifuged (700 × g, 10 min) and the pellet was homogenized twice and centrifuged at 1,000 × g after each homogenization step (all at 4°C). The nuclei were further purified by sedimentation through 2 M sucrose.
Measurement of Perinuclear [Ca2+].
Mobilization of perinuclear [Ca2+] by osmo-mechanical stress was measured by using isolated nuclei from stable transfectants expressing YC-2.1ER. The isolated nuclei were suspended in the standard solution (125 mM KCl, 2 mM K2HPO4, 4 mM MgCl2, 0.1 mM EGTA, 250 mM sucrose, 50 mM Hepes, pH 7.0, and 1 mM ATP) and centrifuged at 1,000 × g for 10 min. The nuclear envelope was then Ca2+-loaded for 30 min at room temperature in the standard solution with free [Ca2+] adjusted to ≈100 nM. For relative [Ca2+] measurements, a FluoroMax-2 spectrofluorimeter (λex = 432 nm, λem = 495 and 530 nm) was used. The Ca2+ concentration of the solutions was checked by using a spectrofluorimeter with Calcium Green-1. Standard Ca2+-EGTA buffers (Molecular Probes) were used for calibration. Perinuclear localization of YC-2.1ER was also imaged in the confocal microscope.
Single-Channel Recording and Analysis.
Patch electrodes were fabricated from 100-λ glass capillaries (Drummond Scientific, Broomall, PA) in three steps on an electrode puller (model P-97, Sutter Instruments, Novato, CA) and heat-polished on a microforge. Tips of freshly pulled pipettes were filled by placement in a sample vial containing filtered buffer solution and the shanks were backfilled. The bath and pipette solutions contained 145 mM KCl, 0.1 mM CaCl2, 1.1 mM EGTA, 2 mM MgCl2, 10 mM Hepes, pH.7.4. To evaluate permeability of Ca2+, the pipette solution contained 72.5 mM CaCl2, 2 mM MgCl2, 10 mM Hepes, pH.7.4. Pipettes were mounted on a micromanipulator and connected to the probe of a patch-clamp amplifier (model EPC-7, List Electronics, Darmstadt, Germany). Mechanical stretch in the patch was induced by applying negative pressure into the pipette with a pneumatic transducer tester (DPM-1B, Bio-Tek, Winooski, VT) connected to the pipette holder. All experiments were conducted at room temperature. Currents were stored on VHS videotapes. The stored raw data were replayed and filtered at 2 kHz. The electrophysiological properties of the channel were analyzed by using PCLAMP 6 software (Axon Instruments, Foster City, CA). Kinetics of open and closed events were analyzed for patches containing only one active channel (determined by an all-points amplitude histogram).
Results and Discussion
Nuclear Shape and Ca2+ in Spreading Cells.
To image free Ca2+ in intact cells, we stably transfected MC3T3-E1 mouse osteoblasts with YCs directed either into the nucleus (YC-2.1NU) or to the ER (YC-4ER). To test the responsiveness of the transfected probes, we treated the cells with the Ca2+ pump inhibitor thapsigargin and Ca2+ ionophore ionomycin. As expected, the treatment decreased YC-4ER fluorescence because these compounds deplete ER Ca2+ stores. In contrast, YC-2.1NU fluorescence increased, indicating transfer of some of the ER Ca2+ into the nucleus from the cytoplasm (not shown).
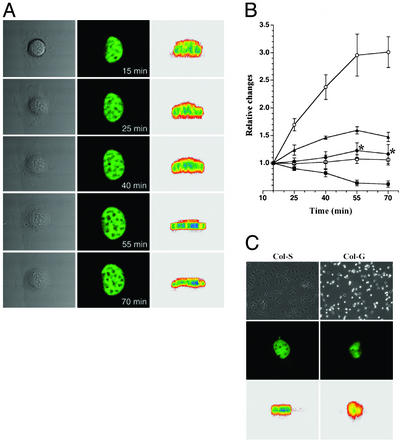
Monitoring YC-2.1NU fluorescence in real time showed that the nucleus flattened coincidentally with cell spreading (Fig. 1A). The nuclear area increased in horizontal sections to a maximum of 160% of the original area, whereas the height of the nucleus decreased by 40% (Fig. 1B). There were no statistically significant changes in nuclear volume during cell spreading. We also plated cells on type I collagen coated on glass coverslips and a polymerized gel of the same collagen. In accordance with earlier results (20), the rigid substrate provided by the collagen coating allowed cell spreading, whereas cells remained round on the flexible gel. The relationship between cell spreading and nuclear shape on these substrates was the same as in round and spread cells on different substrates (Fig. 1C).
Figure 1.
3D morphometric analysis of confocal nuclear images. (A) Cell morphology was visualized by differential interference contrast at the indicated times after cell attachment to fibronectin substrate (Left). Changes in nuclear shape were detected by monitoring YC-2.1NU fluorescence in living cells. Confocal horizontal-section images were taken at single planes through the center of the nucleus (Center). Vertical sections were reconstructed from confocal sections of the nucleus (Right). (B) Quantitative morphometric measurements of nuclear dimensions were made from 3D reconstruction of confocal images. Values (n = 6) are mean ± SD of cell area (○), nuclear area in horizontal section (▴), nuclear surface area (●), nuclear volume (□), and nuclear height (■). *, P < 0.05 (significance was shown in nuclear surface area by ANOVA at 55 and 70 min). (C) Cell and nuclear shape on collagen coating (Col-S) and collagen gel (Col-G) substrates (20) were evaluated by using phase-contrast microscopy and confocal microscopy.
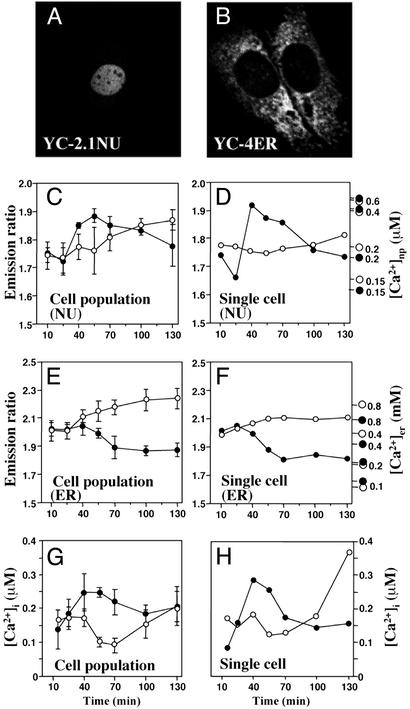
The nuclear and ER cameleons, which were exclusively localized in the nucleus (Fig. 2A) or tubular ER structures (Fig. 2B), respectively, were used to probe nuclear and ER Ca2+ levels in MC3T3-E1 cells spreading on fibronectin. Nuclear Ca2+ increased rapidly in the first 40 min, and after an additional 90 min, slowly decreased to the basal level (Fig. 2C, filled circles). In contrast, a gradual increase of nuclear Ca2+ was seen in cells that remained rounded on BSA (Fig. 2C, open circles). ER Ca2+ stores decreased on fibronectin (Fig. 2E, filled circles), but increased slightly on BSA (Fig. 2E, open circles). These results, which were obtained on cell populations, were confirmed by single cell imaging. On fibronectin, nuclear [Ca2+] increased from a basal level of 160 to 450 nM (Fig. 2D, filled circles), whereas ER [Ca2+] gradually declined from 600 to 200–250 μM (Fig. 2F, filled circles). Although both the timing and magnitude of changes in ER and nuclear Ca2+ levels varied somewhat among individual cells, the vast majority of cells displayed a pattern similar to the one shown in Fig. 2. In cells plated on the two collagen substrates, ER [Ca2+] was significantly (P < 0.01) lower on the rigid substrate than on the gel, supporting the notion that the ER Ca2+ levels are regulated by cell shape, even when the chemical composition of the substrate is the same. We also measured cytoplasmic Ca2+ with fura-2 (21) and found changes paralleling those in the nucleus (Fig. 2 G and H).
Figure 2.
Intracellular localization of YC Ca2+ reporters and changes in nuclear and ER [Ca2+] during cell spreading. Confocal microscopic images and fluorescence emission ratios of MC3T3-E1 cells expressing YC-2.1NU (A, C, and D) and YC-4ER (B, E, and F). Stable transfectants expressing YC-2.1NU or YC-4ER were placed on glass-bottom dishes coated with fibronectin (●) or BSA (○). The images were captured at 37°C through a cooled charge-coupled device camera attached to an epifluorescence microscope with 430 ± 10-nm excitation filter and two emission filters (535DF30 and 470DF30). Fluorescence emission ratios (535/470 nm) of YC-2.1NU and YC-4ER were monitored in populations of spreading cells or in individual single cells, and analyzed with slidebook deconvolution software (Intelligent Imaging Innovations). Values are means ± SD from more than three separate experiments. Ca2+ concentrations were calibrated separately for the cells plated on fibronectin and BSA as described (14, 17). Rmax was obtained in the presence of 10 μM ionomycin and 20 mM CaCl2. Rmin was obtained in the presence of 10 μM ionomycin and 20 mM EGTA. (G and H) Cytosolic Ca2+ concentration ([Ca2+]i) monitored with fura-2 in cells plated on fibronectin (●) or BSA (○).
Ca2+ Changes in Isolated Nuclei.
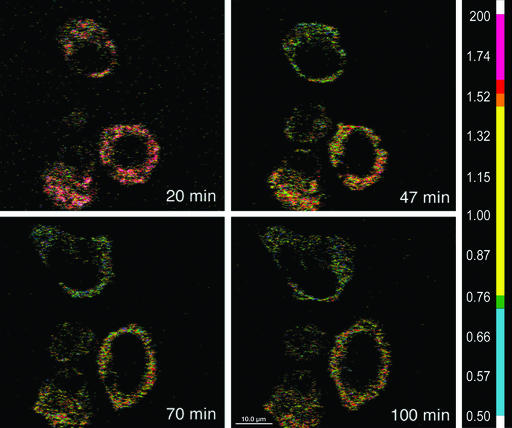
Although the ER is thought to be a continuous tubular network, spatially and functionally distinct Ca2+ stores within the ER have been demonstrated (22). To examine spatial patterns of changes in the ER Ca2+ stores during cell spreading, we used two-photon excitation microscopy (18). In most spreading cells, the changes in store Ca2+ in the perinuclear space were similar to those in the rest of the ER (Fig. 3). Thus, the perinuclear ER is the closest potential source of the increased nuclear Ca2+.
Figure 3.
Ca2+ levels during cell spreading. Dual-emission ratio imaging of YC-4ER expressing cells was performed at an excitation wavelength of 815 nm by using a two-photon excitation microscope with dichroic mirrors and two emission filters. Cells were allowed to attach and spread for 100 min on fibronectin. Ratio images (525/480 nm) of three cells were captured at 37°C at the indicated time points during cell spreading. The bar indicates the relationship of the colors with [Ca2+].
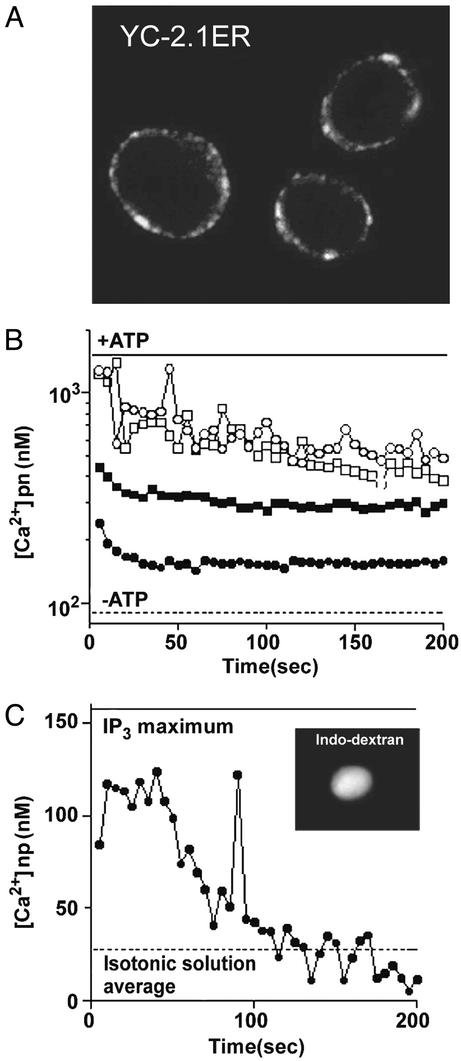
There are physical connections from integrins through the cytoskeleton to the nucleus (9), and mechanical forces can release Ca2+ from intracellular stores (23, 24). Therefore, we next studied whether the perinuclear space, which is continuous with the lumen of the ER and can serve as a source of nuclear Ca2+ (11), is responsive to mechanical forces. We isolated nuclei from stable transfectants expressing YC-2.1ER and showed that the cameleon was present in the perinuclear space (Fig. 4A). To compensate for loss of perinuclear Ca2+ during the isolation of the nuclei, the nuclei were incubated with Ca2+ (19, 25). Ca2+ release from the perinuclear space was monitored after exposing the nuclei to hypotonic medium as a mechanical stimulus (26). Control treatment with thapsigargin and ionomycin showed that this Ca2+ store retains its responsiveness in the isolated nuclei (not shown). Hypotonic (but not isotonic or hypertonic) medium caused a sharp decrease in the perinuclear Ca2+ concentration (Fig. 4B). Control experiments showed that isolated nuclei exposed to hypotonic solution before Ca2+ loading accumulated the same amount of Ca2+ into the perinuclear space as untreated nuclei (not shown). Thus, the Ca2+ release seen after the hypotonic treatment was not caused by rupture of the nuclear membrane. These results are in agreement with the notion that the perinuclear stores can respond to physical stimuli independent of biochemical signals from the plasma membrane. Next, to directly examine the effect of hypotonic treatment on nucleoplasmic [Ca2+], isolated nuclei were loaded with indo-dextran and Ca2+, and the nucleoplasmic fluorescence ratio was monitored after exposure of the nuclei to hypotonic solution (50 mM sucrose) or inositol trisphosphate (InsP3). The hypotonic solution produced a transient increase in nucleoplasmic [Ca2+] that reached a level ≈70% of the level triggered by InsP3 treatment (Fig. 4C).
Figure 4.
Response of perinuclear Ca2+ to mechanical stretching of isolated nuclei. (A) Perinuclear localization of YC-2.1ER in a confocal microscopic image of nuclei isolated from stable transfectants expressing YC-2.1ER. (B) Mobilization of perinuclear (pn) Ca2+ by hypotonic treatment of isolated nuclei from Y-2.1-expressing cells. Ca2+-loaded nuclei were exposed to standard solution (125 mM KCl, 2 mM K2HPO4, 4 mM MgCl2, 0.1 mM EGTA, 50 mM Hepes, pH 7.4) containing 50 mM (●), 125 mM (▪), 250 mM (□), and 500 mM (○) sucrose. Fluorescence ratios (530/495 nm) were measured by using a spectrofluorometer (λex = 432 nm, λem = 495 and 530 nm) and converted into Ca2+ levels (scale). The perinuclear Ca2+ levels in nuclei loaded with Ca2+ in the presence (ATP+) and absence (baseline; ATP−) of ATP are shown for reference. A representative experiment of three is shown. (C) Traces showing the rise in the nucleoplasmic (np) Ca2+ concentration elicited by treatment of isolated nuclei with hypoosmotic solution in the presence of ATP (200 μM). Isolated nuclei were loaded with indo-1-dextran and Ca2+. (Inset) Confocal microscopic image of an indo-dextran-loaded nucleus. Nucleoplasmic fluorescence ratios (408/466 nm) were measured by using a spectrofluorometer (λex = 350 nm, λem = 408 and 466 nm) after exposure of the isolated nuclei to 50 mM sucrose solution (●). Treatment with InsP3 (10 μM) was used to obtain a reference value for maximal stimulation (solid line). Baseline value was obtained by treating the nuclei with an isotonic solution (250 mM sucrose; dotted line). A representative experiment of three is shown.
Stretch-Activated Channels in Nuclear Membrane.
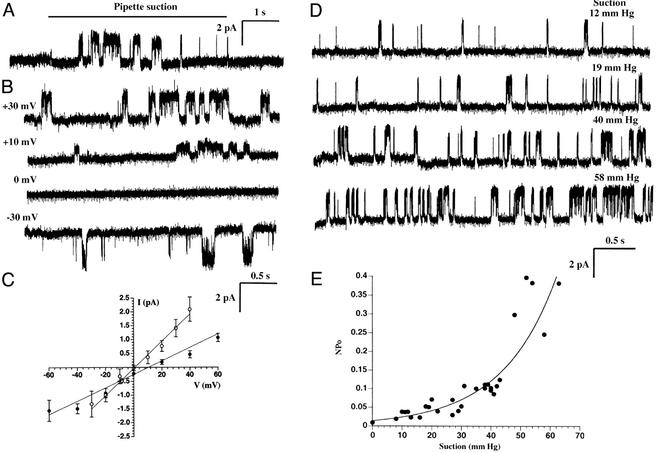
We next investigated the potential route of Ca2+ flux across the outer nuclear membrane in response to a mechanical stimulus. Single-channel recording on isolated nuclei by patch clamping has demonstrated the presence of several types of ion channels in the nuclear membrane (27). We applied this approach to detect the possible existence of mechano-sensitive Ca2+ channels. We observed single-channel currents from a mechano-sensitive channel with a unitary conductance of ≈50 pS in symmetrical 145 mM KCl solution (Fig. 5). When negative pressure was applied inside the patch pipette to stretch the nuclear membrane, increased channel activity was observed after a lag time of ≈1 s (Fig. 5A). The frequency of detection of the nuclear channel (n = 102 patches, 12% incidence) was similar or somewhat smaller than that of nonselective stretch-activated cation channels reported in the plasma membrane of cardiac myocytes (28). Representative current traces of single-channel records at various potentials are shown in Fig. 5B. Ion selectivity of the nuclear channel was estimated from current–voltage (I–V) relationships obtained under different ionic conditions (Fig. 5C). A nearly linear I–V relationship with a reversal potential close to zero was observed with symmetric 145 mM KCl solution. In 145 mM KCl bath/72.5 mM CaCl2 pipette solutions, there was a positive shift in the reversal potential, indicating that this channel is a nonselective cation channel permeable to Ca2+. Examples of current traces under different levels of negative pressure are shown in Fig. 5D. The open probability of the channel increased as greater negative pressure was applied to the pipette (Fig. 5E), supporting the notion of a stretch-activated channel.
Figure 5.
Mechano-sensitive single-channel currents from isolated nuclei. (A) A typical record of single-channel currents from a nucleus-attached patch in response to pipette suction (40 mm Hg) at an applied potential of +40 mV. Pipette and bath solutions were 145 mM KCl, 0.1 mM CaCl2, 2 mM MgCl2, 1.1 mM EGTA, 10 mM Hepes-K, at pH 7.4. (B) Single-channel records at different applied membrane potentials from −30 to +30 mV during constant pipette suction. (C) Current–voltage (I–V) curves from nucleus-attached patches recorded in symmetrical 145 mM KCl (○) or 72.5 mM CaCl2 pipette/145 mM KCl (●) bath solutions. Each point represents the mean single-channel amplitude of the main open state (obtained from all-points total amplitude histograms) versus the relative membrane potential averaged over three separate experiments (± SD). (D) Relationship of channel activity to pipette suction strength at a relative membrane potential of +40 mV. Negative pressures applied to the pipette progressively increased channel activity. (E) Pressure dependence of channel open probability (NPo, where N is the number of channels in the patch and Po is the open probability of a single channel).
Taken together, these results suggest that physical stimuli result in diffusion of Ca2+ from perinuclear stores into nucleoplasm. The nucleus can be moved within the cell through a force exerted on integrins at the cell surface. The physical link between the cell surface attachment apparatus and the nucleus is presumably the cytoskeleton (9, 29). This cytoskeletal connection is also likely to be responsible for the stretching of the nucleus we observed during cell spreading. This could, in turn, activate Ca2+ channels in the outer nuclear membrane and the adjoining ER, resulting in an increase in cytosolic and nuclear Ca2+.
The influx of Ca2+ into isolated nuclei and nuclei of spreading cells could occur through nuclear pores (which span both the outer and inner nuclear membranes) or via direct Ca2+ mobilization across the inner nuclear membrane. Influx of Ca2+ into the nucleus has been proposed to occur through nuclear pores. This nuclear influx is thought to occur after chemically induced release of Ca2+ from intracellular stores into the cytoplasm (30, 31). As shown here, parallel changes in nuclear and cytoplasmic Ca2+ suggest a similar route from the perinuclear ER to the nucleus in spreading cells.
Ca2+-Induced Signaling in the Nucleus.
We next examined whether the elevation of nuclear Ca2+ we have demonstrated might cause changes in gene expression. Activation of calmodulin-dependent kinase IV (CaMKIV) is one likely response to elevated nuclear Ca2+ levels. Activated CaMKIV phosphorylates the transcription factor cAMP responsive element binding protein (CREB), enhancing CREB-dependent transcription of genes such as c-fos and c-jun (32) and also activates the transcription factor MEF2 (12, 13). The YC probe we used to detect the elevated nuclear Ca2+ levels is based on the binding of Ca2+ by calmodulin. Moreover, the absolute Ca2+ levels we measured in the nucleus of spreading cells (450 nM) are within the range of Ca2+ concentrations known to elicit calmodulin-dependent responses (33).
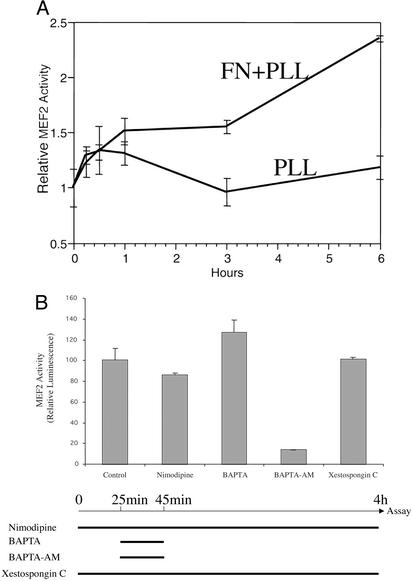
We found that transcription of a reporter gene with MEF2 sites in its promoter region (34) was triggered by integrin-mediated cell spreading (Fig. 6A). Chelation of extracellular Ca2+ with 1,2-bis(2-aminophenoxy)ethane-N,N,N′,N′-tetraacetate (BAPTA) or blockade of Ca2+ entry via L-type Ca2+ channels with nimodipine (12) had no effect on increased MEF2 site-reporter gene activity triggered by cell spreading (Fig. 6B). In contrast, chelation of intracellular Ca2+ (including intranuclear Ca2+) with cell-permeable acetoxymethyl ester of BAPTA completely abrogated reporter gene activity in this context. Thus, intracellular Ca2+ stores are responsible for the increased Ca2+ that regulates MEF2-dependent gene expression in the nucleus. The nuclear envelope contains receptors for InsP3, which are InsP3-regulated Ca2+ channels (35, 36). Moreover, there is evidence to indicate that the InsP3 receptors are located in the inner nuclear membrane (37). Thus, activation of these channels in the nuclear envelope could be responsible for the increase in nuclear Ca2+ during cell spreading. However, these receptors do not appear to be involved, as treating spreading cells with the InsP3 receptor inhibitor, xestospongin (38), had no effect on MEF2 activation in spreading cells (Fig. 6B).
Figure 6.
Cell spreading triggers intracellular Ca2+-mediated gene expression. (A) Cells transfected with a MEF2 site-luciferase reporter gene construct (based on the promoter of the brain creatine kinase gene) (33) were seeded onto fibronectin (FN) plus poly-l-lysine (PLL)-coated dishes or, as a control, PLL alone. Integrin-mediated cell spreading observed on FN was accompanied by MEF2-associated gene transcription. (B) Cells transfected with a MEF2 site-luciferase reporter gene construct were seeded onto fibronectin (time 0). Nimodipine (10 μM), BAPTA (1 mM), acetoxymethyl ester of BAPTA (BAPTA-AM) (100 μM), or Xestospongin C (2 μM) was added at the indicated time. Four hours after plating the cells, luciferase assays were performed. Luciferase activity from untreated cultures (Control) was assigned a value of 100.
We show here that integrin-mediated cell spreading on a fibronectin matrix causes flattening of the nucleus, and that this shape change is accompanied by a transient elevation of nuclear [Ca2+]. We also demonstrate the existence of a stretch-activated Ca2+ permeable channel in the nuclear membrane that may be responsible for releasing Ca2+ from the perinuclear space and entry into the nucleus. Finally, we show that the activity of a Ca2+-regulated transcription factor is enhanced in spreading cells. Another laboratory has recently found a correlation between gene expression and nuclear shape changes in cells cultured on micropatterned substrata (39). Thus, these experimental results provide support for all of the elements of a novel mechano-transduction pathway from integrins in the ECM to gene regulation in the nucleus via an intracellular Ca2+-mediated signaling cascade. Indeed, our results show that MEF2-dependent transcription is greatly elevated in cells spreading on fibronectin substrata, substantiating the existence of a mechano-sensing pathway extending from extracellular to nuclear domains.
Acknowledgments
This work was supported by National Institutes of Health Grants CA79984 and CA67224 (to E.R.), P01 HD29587 (to D.Z. and S.A.L.), and R01 EY05477 (to S.A.L.), and National Cancer Institute Cancer Center Support Grant CA30199. N.I. was supported by postdoctoral fellowships for research abroad (Japan Society for the Promotion of Science). Some of the work included here was conducted at the National Center for Microscopy and Imaging Research, which is supported by National Institutes of Health Grant RR04050 to Dr. Mark H. Ellisman (Department of Neurosciences, School of Medicine, University of California, San Diego). YC constructs were provided by Aurora Biosciences (San Diego).
Abbreviations
- ECM
extracellular matrix
- MEF2
myocyte enhancer factor 2
- YC
yellow cameleon
- ER
endoplasmic reticulum
- InsP3
inositol trisphosphate
- BAPTA
1,2-bis(2-aminophenoxy)ethane-N,N,N′,N′-tetraacetate
References
- 1.Giancotti F G, Ruoslahti E. Science. 1999;285:1028–1032. doi: 10.1126/science.285.5430.1028. [DOI] [PubMed] [Google Scholar]
- 2.Chen C S, Mrksich M, Huang S, Whitesides G M, Ingber D E. Science. 1997;276:1425–1428. doi: 10.1126/science.276.5317.1425. [DOI] [PubMed] [Google Scholar]
- 3.MacKenna D A, Dolfi F, Vuori K, Ruoslahti E. J Clin Invest. 1998;101:301–310. doi: 10.1172/JCI1026. [DOI] [PMC free article] [PubMed] [Google Scholar]
- 4.Meyer C J, Alenghat F J, Rim P, Fong J H, Fabry B, Ingber D E. Nat Cell Biol. 2000;2:666–668. doi: 10.1038/35023621. [DOI] [PubMed] [Google Scholar]
- 5.Shyy J Y, Chien S. Circ Res. 2002;91:769–775. doi: 10.1161/01.res.0000038487.19924.18. [DOI] [PubMed] [Google Scholar]
- 6.Naruse K, Yamada T, Sokabe M. Am J Physiol. 1998;274:H1532–H1538. doi: 10.1152/ajpheart.1998.274.5.H1532. [DOI] [PubMed] [Google Scholar]
- 7.Ruoslahti E. Science. 1997;276:1345–1346. doi: 10.1126/science.276.5317.1345. [DOI] [PubMed] [Google Scholar]
- 8.Ingber D E, Folkman J. Cell. 1989;58:803–805. doi: 10.1016/0092-8674(89)90928-8. [DOI] [PubMed] [Google Scholar]
- 9.Maniotis A J, Chen C S, Ingber D E. Proc Natl Acad Sci USA. 1997;94:849–854. doi: 10.1073/pnas.94.3.849. [DOI] [PMC free article] [PubMed] [Google Scholar]
- 10.Hardingham G E, Chawla S, Johnson C M, Bading H. Nature. 1997;385:260–265. doi: 10.1038/385260a0. [DOI] [PubMed] [Google Scholar]
- 11.Malviya A N, Rogue P J. Cell. 1998;92:17–23. doi: 10.1016/s0092-8674(00)80895-8. [DOI] [PubMed] [Google Scholar]
- 12.Dolmetsch R E, Pajvani U, Fife K, Spotts J M, Greenberg M E. Science. 2001;294:333–339. doi: 10.1126/science.1063395. [DOI] [PubMed] [Google Scholar]
- 13.Passier R, Zeng H, Frey N, Naya F J, Nicol R L, McKinsey T A, Overbeek P, Richardson J A, Grant S R, Olson E N. J Clin Invest. 2000;105:1395–1406. doi: 10.1172/JCI8551. [DOI] [PMC free article] [PubMed] [Google Scholar]
- 14.Miyawaki A, Llopis J, Heim R, McCaffery J M, Adams J A, Ikura M, Tsien R Y. Nature. 1997;388:882–887. doi: 10.1038/42264. [DOI] [PubMed] [Google Scholar]
- 15.Miyawaki A, Griesbeck O, Heim R, Tsien R Y. Proc Natl Acad Sci USA. 1999;96:2135–2140. doi: 10.1073/pnas.96.5.2135. [DOI] [PMC free article] [PubMed] [Google Scholar]
- 16.Yu R, Hinkle P M. J Biol Chem. 2000;275:23648–23653. doi: 10.1074/jbc.M002684200. [DOI] [PubMed] [Google Scholar]
- 17.Foyouzi-Youssefi R, Arnaudeau S, Borner C, Kelley W L, Tschopp J, Lew D P, Demaurex N, Krause K H. Proc Natl Acad Sci USA. 2000;97:5723–5728. doi: 10.1073/pnas.97.11.5723. [DOI] [PMC free article] [PubMed] [Google Scholar]
- 18.Fan G Y, Fujisaki H, Miyawaki A, Tsay R K, Tsien R Y, Ellisman M H. Biophys J. 1999;76:2412–2420. doi: 10.1016/S0006-3495(99)77396-0. [DOI] [PMC free article] [PubMed] [Google Scholar]
- 19.Adebanjo O A, Anandatheerthavarada H K, Koval A P, Moonga B S, Biswas G, Sun L, Sodam B R, Bevis P J, Huang C L, Epstein S, et al. Nat Cell Biol. 1999;1:409–414. doi: 10.1038/15640. [DOI] [PubMed] [Google Scholar]
- 20.Koyama H, Raines E W, Bornfeldt K E, Roberts J M, Ross R. Cell. 1996;87:1069–1078. doi: 10.1016/s0092-8674(00)81801-2. [DOI] [PubMed] [Google Scholar]
- 21.Schwartz M A. J Cell Biol. 1993;120:1003–1010. doi: 10.1083/jcb.120.4.1003. [DOI] [PMC free article] [PubMed] [Google Scholar]
- 22.Golovina V A, Blaustein M P. Science. 1997;275:1643–1648. doi: 10.1126/science.275.5306.1643. [DOI] [PubMed] [Google Scholar]
- 23.Missiaen L, De Smedt H, Parys J B, Sienaert I, Vanlingen S, Droogmans G, Nilius B, Casteels R. J Biol Chem. 1996;271:4601–4604. doi: 10.1074/jbc.271.9.4601. [DOI] [PubMed] [Google Scholar]
- 24.Jena M, Minore J F, O'Neill W C. Am J Physiol. 1997;273:C316–C322. doi: 10.1152/ajpcell.1997.273.1.C316. [DOI] [PubMed] [Google Scholar]
- 25.Nicotera P, Orrenius S, Nilsson T, Berggren P O. Proc Natl Acad Sci USA. 1990;87:6858–6862. doi: 10.1073/pnas.87.17.6858. [DOI] [PMC free article] [PubMed] [Google Scholar]
- 26.Innocenti B, Mazzanti M. J Membr Biol. 1993;131:137–142. doi: 10.1007/BF02791322. [DOI] [PubMed] [Google Scholar]
- 27.Mazzanti M, DeFelice L J, Cohn J, Malter H. Nature. 1990;343:764–767. doi: 10.1038/343764a0. [DOI] [PubMed] [Google Scholar]
- 28.Kawakubo T, Naruse K, Matsubara T, Hotta N, Sokabe M. Am J Physiol. 1999;276:H1827–H1838. doi: 10.1152/ajpheart.1999.276.6.H1827. [DOI] [PubMed] [Google Scholar]
- 29.Ingber D E, Prusty D, Sun Z, Betensky H, Wang N. J Biomech. 1995;28:1471–1484. doi: 10.1016/0021-9290(95)00095-x. [DOI] [PubMed] [Google Scholar]
- 30.Lipp P, Thomas D, Berridge M J, Bootman M D. EMBO J. 1997;16:7166–7173. doi: 10.1093/emboj/16.23.7166. [DOI] [PMC free article] [PubMed] [Google Scholar]
- 31.Bootman M D, Thomas D, Tovey S C, Berridge M J, Lipp P. Cell Mol Life Sci. 2000;57:371–378. doi: 10.1007/PL00000699. [DOI] [PMC free article] [PubMed] [Google Scholar]
- 32.Enslen H, Sun P, Brickey D, Soderling S H, Klamo E, Soderling T R. J Biol Chem. 1994;269:15520–15527. [PubMed] [Google Scholar]
- 33.Chin D, Means A R. Trends Cell Biol. 2000;10:322–328. doi: 10.1016/s0962-8924(00)01800-6. [DOI] [PubMed] [Google Scholar]
- 34.Okamoto S, Li Z, Ju C, Scholzke M N, Mathews E, Cui J, Salvesen G S, Bossy-Wetzel E, Lipton S A. Proc Natl Acad Sci USA. 2002;99:3974–3979. doi: 10.1073/pnas.022036399. [DOI] [PMC free article] [PubMed] [Google Scholar]
- 35.Gerasimenko O V, Gerasimenko J V, Tepikin A V, Petersen O H. Cell. 1995;80:439–444. doi: 10.1016/0092-8674(95)90494-8. [DOI] [PubMed] [Google Scholar]
- 36.Santella L, Carafoli E. FASEB J. 1997;11:1091–1109. [PubMed] [Google Scholar]
- 37.Humbert J P, Matter N, Artault J C, Koppler P, Malviya A N. J Biol Chem. 1996;271:478–485. doi: 10.1074/jbc.271.1.478. [DOI] [PubMed] [Google Scholar]
- 38.Gafni J, Munsch J A, Lam T H, Catlin M C, Costa L G, Molinski T F, Pessah I N. Neuron. 1997;19:723–733. doi: 10.1016/s0896-6273(00)80384-0. [DOI] [PubMed] [Google Scholar]
- 39.Thomas C H, Collier J H, Sfeir C S, Healy K E. Proc Natl Acad Sci USA. 2002;99:1972–1977. doi: 10.1073/pnas.032668799. [DOI] [PMC free article] [PubMed] [Google Scholar]


