Abstract
Recent studies have demonstrated a role for telomerase in driving tumor progression, but its mechanism of action remains unclear. Here we show that stable, ribozyme-mediated suppression of mouse telomerase RNA reduced telomerase RNA expression, telomerase activity, and telomere length, which significantly reduced tumor invasion and metastatic potential. Our studies reveal that previously unidentified effects of telomerase may mediate its tumor-promoting effects. First, reducing telomerase activity induced a more dendritic morphology, accompanied by increased melanin content and increased expression of tyrosinase, a key enzyme in melanin biosynthesis. Second, gene expression profiling revealed that telomerase targeting down-regulated expression of several glycolytic pathway genes, with a corresponding decrease in glucose consumption and lactate production. Thus, telomerase activity controls the glycolytic pathway, potentially altering the energy state of tumor cells and thereby modulating tyrosinase activity and melanin production. These studies have important implications for understanding the mechanisms by which telomerase promotes tumor invasion and metastasis.
Keywords: differentiation, glycolysis
Telomerase is a ribonucleoprotein complex composed of core protein (telomerase reverse transcriptase) and RNA (telomerase RNA or TER) moieties. The most extensively characterized function of telomerase is to maintain the telomeric repeats capping the ends of eukaryotic chromosomes and thereby preserve their integrity by preventing end-to-end fusions (1–4). Whereas normal somatic cells have diminished telomerase activity, >90% of human cancers overexpress telomerase (5, 6). The well established roles for telomerase in tumor initiation and cellular immortalization (7, 8) have led to the identification of telomerase as a potentially important molecular target in cancer therapeutics (9–11). To date, multiple studies have examined the utility of targeting telomerase to inhibit tumor cell proliferation (12–16).
Although the importance of telomerase for tumor cell proliferation is well documented, its impact on tumor invasion and metastasis has been studied less. In our recent study, we used a systemic injection model of an effective anti-telomerase ribozyme to reveal that inhibiting telomerase activity in tumor-bearing mice significantly reduces metastatic progression (16). Here, we examine the direct role played by telomerase in the metastatic potential of murine melanoma and characterize cellular pathways altered by telomerase suppression in tumor cells. We show that stable, ribozyme-mediated suppression of TER levels in melanoma cells results in a more dendritic phenotype, accompanied by increased tyrosinase expression and pigment production. Furthermore, we show that TER suppression results in down-regulation of glycolytic pathway genes and significantly reduces glucose metabolism, providing a mechanistic basis for the reduced metastatic capacity and increased pigment production observed.
Results
To directly examine the role of telomerase in the progression of murine melanoma, we developed stable transformant cell lines expressing a ribozyme targeting mouse TER at position 180 (TER 180 Rz), driven by the human U6 promoter. This anti-TER 180 Rz was previously shown to down-regulate TER levels (by TaqMan assays; Applied Biosystems) and telomerase enzymatic activity, and to significantly suppress metastatic progression in vivo compared with vector-only and mutant ribozyme controls (16). Previously, a control inactive mutant anti-TER ribozyme was shown to be comparable to the empty vector control in its inability to suppress the lung metastasis of melanoma (16). Therefore, the effects of ribozyme expression were compared with B16 cells transfected with the empty vector as an appropriate control in these studies.
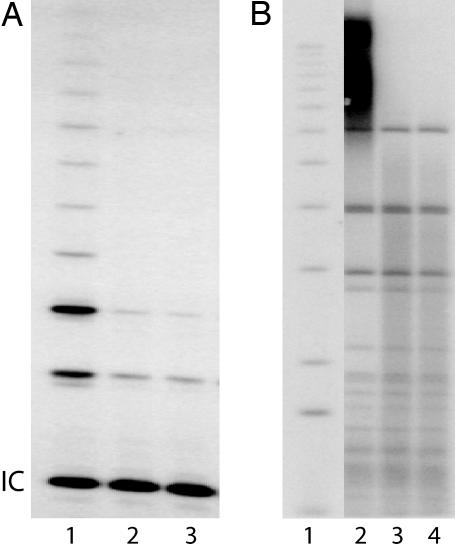
Ribozyme expression in the TER 180 Rz clones was verified by Northern analysis (data not shown). Three clones that demonstrated suppression of TER expression on the initial TaqMan screen were pooled for further analysis. Clone 5, a ribozyme clone that highly suppressed TER expression, was also analyzed as a single clone. TER expression levels were reduced by 67% in pooled ribozyme clones compared with pooled empty vector clones (P < 0.00001), as measured by quantitative RT-PCR (Table 1). This down-regulation in TER expression corresponded to a concomitant inhibition of telomerase enzymatic activity as measured by the telomeric repeat amplification protocol assay. Telomerase activity was reduced by up to 80% in TER 180 Rz clones compared with controls (Fig. 1A and Table 1). In addition, the reduced telomerase activity was associated with shortened telomeres in the ribozyme-expressing clones (Fig. 1B).
Table 1.
Comparison of telomerase expression and activity and mechanistic analyses in control and anti-TER ribozyme-expressing B16 transformants
| Clone | TER expression, % | Telomerase activity, % | Melanin content, μg/5 × 106 cells | Cells in S phase, % | Apoptotic cells, % |
|---|---|---|---|---|---|
| Pooled vector | 100 | 100 | 10.8 | 38 | 0.06 |
| Pooled ribozyme | 33 | 22 | 35.3 | 23.4 | 0.3 |
| Ribozyme clone 5 | 25 | 28 | 36.4 | 21.2 | 0.5 |
Fig. 1.
Effects of TER 180 Rz expression on telomerase activity and telomere lengths. (A) Analysis of telomerase activity by telomeric repeat amplification protocol (IC, TRAPeze kit internal control band). Lanes: 1, pooled vector; 2, pooled ribozyme; 3, ribozyme clone 5. (B) Southern blotting analysis of telomere lengths in pooled vector, pooled ribozyme, and ribozyme clone 5 cells. Lanes: 1, ladder of size markers; 2, pooled vector; 3, pooled ribozyme; 4, ribozyme clone 5 transformants.
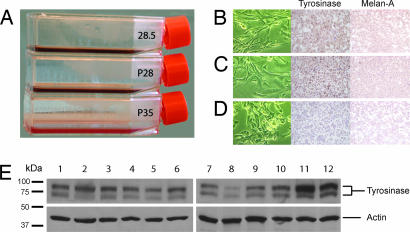
Unexpectedly, the cell clones stably expressing the TER 180 Rz displayed an altered morphology compared with the control vector-only transformants. Although vector-only transformants displayed the rounded, poorly differentiated morphology of the parental cell line, TER 180 Rz transformants revealed a more dendritic morphology, more closely resembling melanocytes, their cell of origin (Fig. 2). This morphological change was accompanied by visible darkening of the growth medium (Fig. 2) and associated with increased immunostaining for tyrosinase and Melan-A/MART-1 (Fig. 2), two markers of melanocytic differentiation, as well as a 3-fold increase in melanin content (Table 1). The effects of TER down-regulation on tyrosinase expression were further investigated by using Western blot analysis of tyrosinase over time. Tyrosinase expression was increased in mouse TER-suppressed cells only on day 10 in culture when the cells reached confluence, but not on days 0, 3, and 7 (Fig. 2).
Fig. 2.
Effects of TER 180 Rz expression on B16 cell morphology and expression of tyrosimase and Melan-A. (A) Flasks containing confluent cell cultures of ribozyme clone 5 (28.5), pooled ribozyme (P28), and pooled vector (P35) B16 clones with medium. (B–D) In vitro morphology (Left) of ribozyme clone 5 (B), pooled ribozyme (C), and pooled vector (D) B16 clones, along with tyrosinase (Center) and Melan-A (Right) immunostaining for each subclone. (E) Western blot of tyrosinase and actin in pooled vector (lanes 1, 4, 7, and 10), pooled ribozyme (lanes 2, 5, 8, and 11), and clone 5 (lanes 3, 6, 9, and 12) cells on day 0 (lanes 1–3), day 3 (lanes 4–6), day 7 (lanes 7–9), and day 10 (lanes 10–12).
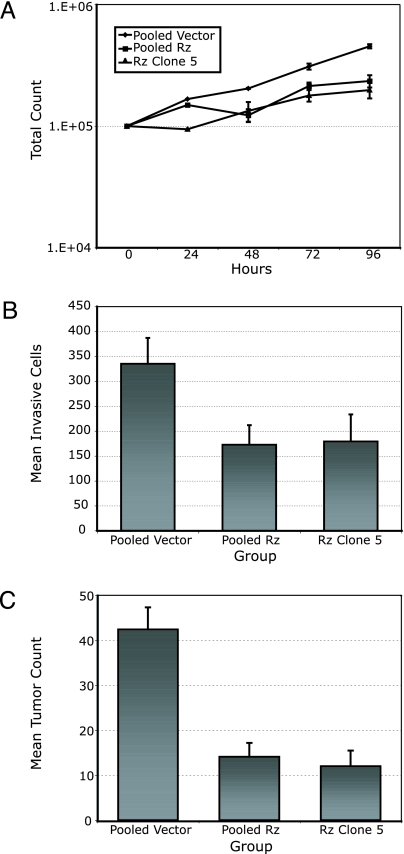
Next, we examined the effects of TER suppression on in vitro growth characteristics of B16 cells. Cell growth curves of the stable transformants over 4 days revealed significantly reduced growth rates in TER 180 Rz compared with vector-only control clones (Fig. 3A and Table 1). To determine whether the slower growth rate observed was because of increased doubling times or apoptosis, we performed FACS-based BrdU incorporation and TUNEL assays, respectively. The TER 180 Rz clones had higher rates of apoptosis and also ≈40% fewer cells in S phase than the vector-only controls (P < 0.001) (Table 1).
Fig. 3.
Reduced cell proliferation, invasive, and metastatic capacity of anti-TER ribozyme-expressing B16 cells. (A) Growth curves measuring cell counts over 96 h for pooled vector, pooled ribozyme (Rz), and ribozyme clone 5 cells. (B) Quantitation of tumor cell invasion into Matrigel. (C) Total tumor counts in the lungs of mice i.v. injected with pooled vector, pooled ribozyme, and ribozyme clone 5 B16 cells.
Given the altered morphology of the ribozyme-expressing B16 clones, we hypothesized that TER suppression may result in decreased invasiveness of B16 cells. To investigate this hypothesis, we plated ribozyme-expressing and control cells onto a Matrigel matrix and 24 h later counted all of the cells that had invaded. This analysis revealed an ≈50% decrease in the number of invading cells in TER 180 Rz vs. vector-only control groups (P < 0.002; Fig. 3B), a difference that could not be accounted for by the differing proliferation rates of the control vs. ribozyme-expressing cells.
In addition, we analyzed the effects of telomerase suppression on the metastatic potential of ribozyme-expressing B16 clones in vivo. Tail-vein injection of 3 × 10⁴ stable transformant cells per mouse resulted in 70% fewer metastatic tumors in the lungs of mice injected with TER 180 Rz-expressing clones, compared with vector-only clones (P < 0.0001) (Fig. 3C).
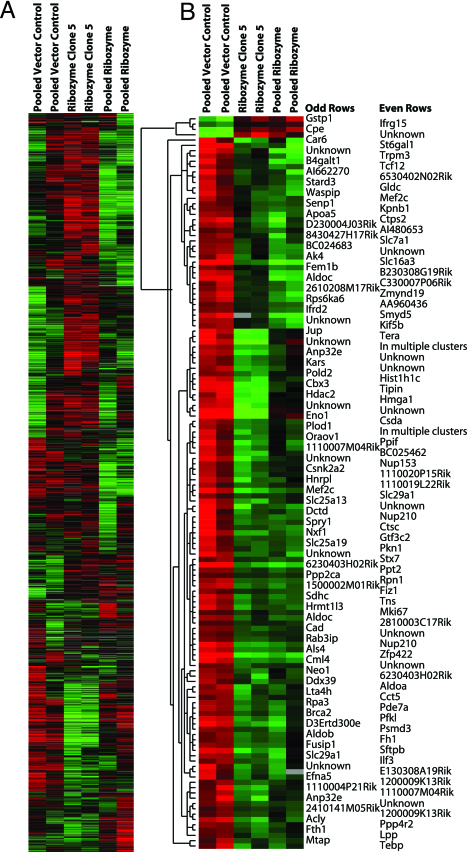
Finally, to identify the potential downstream pathways controlled by telomerase, we performed gene expression profiling and supervised hierarchical analysis of duplicate arrays of the pooled ribozyme-expressing clones and of clone 5 and compared these with the pooled vector-only control clones (Fig. 4A). Significance analysis of microarrays identified 138 genes whose expression was significantly different between ribozyme-expressing and control vector-only clones. Four of these genes were up-regulated, but the great majority (134 genes) showed down-regulation of expression after ribozyme expression and TER inhibition. Among the down-regulated genes were several involved in DNA binding and transcriptional regulation, cell proliferation, and metabolic pathways such as glycolysis (Fig. 4B). Specifically, this gene set included eight cDNAs involving genes participating in the glycolytic pathway, including two independent clones of aldolase C and three separate isoforms of aldolase.
Fig. 4.
Gene expression profiling comparing duplicate arrays of RNA isolated from pooled vector (lanes 1 and 2), ribozyme clone 5 (lanes 3 and 4), and pooled ribozyme (lanes 5 and 6) cells. (A) The entire gene set in the array. (B) The significant gene list derived from significance analysis of microarray analysis. The gene tree on the left of B represents the degree of correlation between genetic expression values.
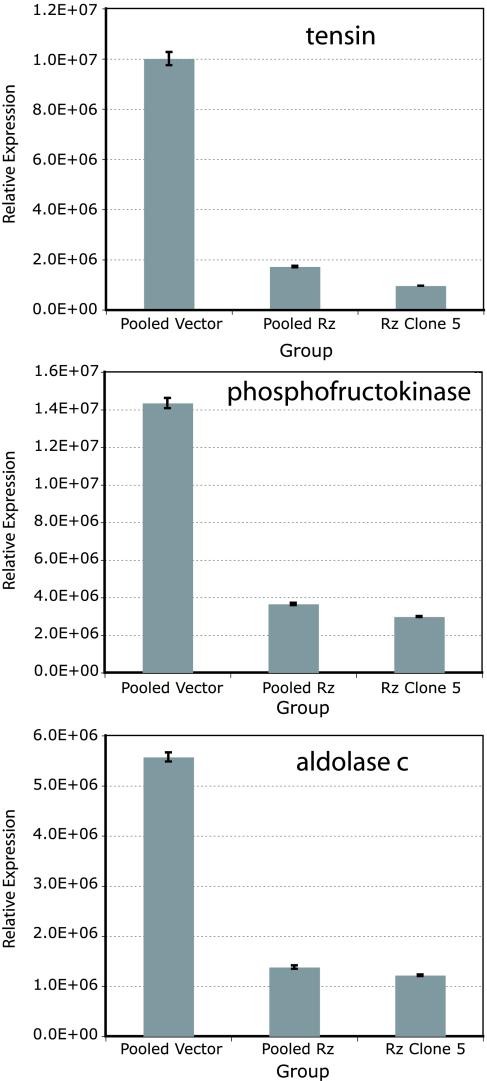
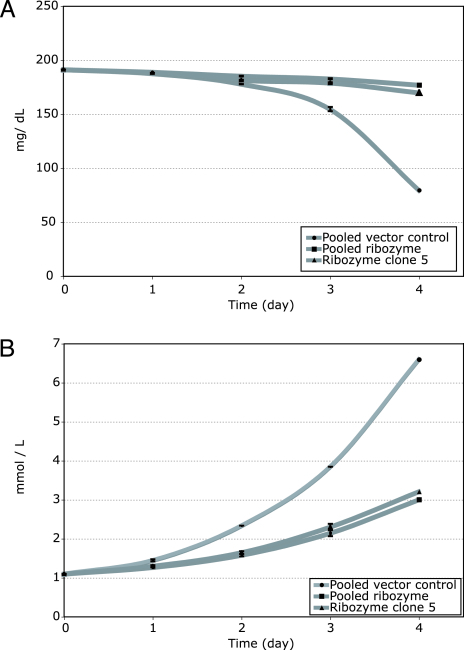
Down-regulation of three genes identified by this analysis (tensin and two of the glycolytic pathway genes, phosphofructokinase and aldolase C) was confirmed by quantitative RT-PCR. Expression of each of these genes was reduced by 70–90% in pooled ribozyme and clone 5 cells compared with pooled vector clones (Fig. 5). Finally, glucose metabolism in the ribozyme-expressing and control vector clones was compared by measuring glucose and lactate levels in an in vitro time course assay. Both glucose consumption (Fig. 6A) and lactate production (Fig. 6B) were significantly lower in the pooled ribozyme-expressing clones and clone 5 compared with vector-only clones, even after controlling for the differing rates of proliferation of the vector vs. ribozyme-expressing clones.
Fig. 5.
Expression of tensin, phosphofructokinase, and aldolase C by TaqMan as normalized to level of histone gene expression in pooled vector, pooled ribozyme (Rz), and ribozyme clone 5 cells.
Fig. 6.
Glycolytic rates as measured by glucose (A) and lactate (B) levels in pooled vector, pooled ribozyme, and ribozyme clone 5 cells.
Discussion
Our results provide evidence suggesting that telomerase may drive tumor progression and metastasis by pathways that are distinct from its well documented effects on tumor cell proliferation rate. One such newly implicated mechanism is telomerase-induced activation of the glycolytic pathway, as suggested by the gene expression profiling studies. Suppression of TER primarily produced measurable down-regulation of gene expression, including that of genes involved in transcriptional regulation, DNA binding, cell proliferation, cell adhesion, nuclear transport and trafficking, DNA replication, and chromatin assembly. Strikingly, eight significantly down-regulated cDNAs corresponded with genes involved in the glycolytic pathway, including three isoforms of aldolase. This reduced expression of the glycolytic pathway genes was verified by TaqMan analysis and occurred in concert with measurably reduced glucose metabolism.
The importance of enhanced glycolysis to tumor cell growth, invasion, and metastasis has been clearly documented (reviewed in ref. 17). Specifically, up-regulation of several glycolytic enzymes has been shown to promote tumor growth, angiogenesis, and metastasis (18, 19). Our work provides support for a direct relationship between manipulating telomerase status and the activation of glycolysis in cancer cells. Recent studies have implicated the Akt pathway in the induction of aerobic glycolysis in tumor cells (20), and Akt kinase has been shown to enhance telomerase activity (21). It is thus possible that telomerase may stimulate glycolysis downstream of Akt kinase activation.
The reduced glycolysis observed in the anti-TER ribozyme-expressing clones may, in part, be responsible for the morphologic reversion observed in the murine melanoma cells. Tyrosinase can be inactivated in melanoma cells in response to acidified conditions, and the inactive tyrosinase accumulates in the endoplasmic reticulum (22). Importantly, restoration of tyrosinase activity in melanoma cells was demonstrated recently through restriction of glucose uptake (23), suggesting a direct link between glucose metabolism, tyrosinase expression and processing, and melanin synthesis. Our results corroborate this hypothesis by demonstrating that inactivation of glycolysis after TER-based suppression was accompanied by increased tyrosinase expression and melanin production. Intriguingly, tyrosinase expression was increased as the ribozyme-expressing cells reached confluence on day 10 of the time course assay but not in earlier time points. These results are consistent with both the darkening of the cell culture medium observed here and reports showing that accumulation of the tyrosinase substrate dopa results in activation of tyrosinase and in its transport from the endoplasmic reticulum to the Golgi, resulting in melanin production (24).
In addition, the anti-TER ribozyme-expressing clones assumed a dendritic morphology, with a concomitant increase in immunostaining for Melan-A/Mart-1, an additional marker of melanocytic differentiation not known to be affected by glycolytic rates. These results suggest that telomerase suppression may play an active role in the induction of cellular differentiation in tumor cells. Previous reports have shown that differentiation in leukemia cells that was experimentally induced by retinoic acid, for example, was accompanied by lowering of telomerase activity (25, 26). Such findings had been interpreted as indicating that the down-regulation of telomerase was a consequence, rather than a causative factor, of differentiation. In contrast, our results now suggest that the experimental suppression of telomerase activity itself may be sufficient to directly induce at least some properties consistent with tumor cell differentiation.
Loss of cellular differentiation is a characteristic of highly progressed cancer cells. The present results support a model in which part of the role of telomerase in cancer progression may derive from an unanticipated ability of telomerase to inhibit cellular differentiation. Intriguingly, the phenotype observed upon suppressing telomerase was similar to that previously seen upon stable expression of a ribozyme targeting the activated HRAS gene in human melanoma cells (27). Whether telomerase and HRAS act in the same or different pathways to promote maintenance of tumor cells in a dedifferentiated state will be of great interest.
The global pattern of down-regulation of gene expression after TER suppression shown here was similar to that recently reported by transient, small interfering RNA-mediated TER suppression in human colon carcinoma cells (28). The expression profiling results in these two studies revealed differences in the specific genes with significantly altered expression. These differences may reflect the stable nature of TER suppression produced here that resulted in telomere shortening, the gene expression patterns activated in mouse vs. human cells, and/or the different array platforms used in these studies. However, it is tempting to speculate that transient vs. prolonged TER suppression may result in repression of different gene networks and cellular pathways.
Finally, our study provides evidence for a direct relationship between telomerase activity and metastatic potential. These results extend recent studies showing a prometastatic phenotype for oncogene- (including telomerase reverse transcriptase) transformed fibroblasts (29) and melanocytes (30). The fact that the telomerase inhibition reported here reduced the metastatic potential of a spontaneously arising tumor cell line, which has many genetic abnormalities other than up-regulation of telomerase, firmly establishes a role for telomerase in tumor metastasis, highlighting its importance to the lethal stages of tumor progression.
It has also been shown that knock-down of the level of telomerase RNA by RNA interference rapidly inhibits human cancer cell growth, through a pathway that does not require p53 or involve any detectable telomere shortening or loss of telomere protective functions (15, 28). Together, these findings indicate that telomerase exerts its proinvasive and prometastatic effects not solely by polymerizing telomeric DNA to elongate chromosome ends, but also through involvement in central cell fate decisions. Hence, suppression of the level of the telomerase ribonucleoprotein complex may have a place in therapies directed against advanced metastatic cancer (16).
Materials and Methods
Cloning.
The pAVU6+27 plasmid (31) was digested with SalI and XbaI and fill-in ligated with DNA (5′-TCGATGCGCTCTGATGAGTCCGTGAGGACGAAACGTTTG-3′) encoding the TER 180 Rz as described in refs. 16 and 32, and its sequence was verified by using a gene-specific primer (5′-TTTCTTGGGTAGTTTGCATTTT-3′).
Generation of Stable Transformants.
The transfection reagent N-[1-(2,3-dioleoyloxy)propyl]-N,N,N-trimethylammonium methylsulfate (DOTAP, 100 mM; Avanti Polar Lipids) and plasmid DNA were added sequentially to 5% dextrose in water (4 nmol of lipid and 1 mg of DNA in 0.5 ml total volume per 1 × 10⁵ cells) and added drop-wise onto cultured B16-F10 murine melanoma cells (American Type Culture Collection) grown in serum-free medium. At 72 h posttransfection, cells were replated at 1:2 to 1:16 dilutions and grown in selective medium containing 800 μg/ml Geneticin (Mediatech, Herndon, VA) and 10% FBS. Individual colonies were selected, expanded, and analyzed for ribozyme and target gene expression.
Tissue Culture.
Cells were cultured in RPMI medium 1640 with 5% FBS and 800 μg/ml Geneticin (37°C, 5% CO2). This medium was changed to RPMI medium 1640 with 5% FBS and 800 μg/ml Geneticin for FACS and growth curve analyses, and to RPMI medium 1640 with 5 μg/ml insulin for invasion assays. For in vivo experiments, cells were cultured in RPMI medium 1640 with 10% FBS and 800 μg/ml Geneticin up to the time of injection.
Northern Blotting Analyses and Quantified RT-PCR.
Total cellular RNA was extracted by using the TRIzol method (Invitrogen), and the TaqMan assay was performed as described in ref. 16. Expression levels of various genes were normalized to histone before intersample comparisons.
Telomerase Assays.
Protein extractions and the telomeric repeat amplification protocol assay were performed as described in ref. 16. Telomere length was measured as described in ref. 15.
Melanin Content.
Cells were grown to 80% confluence in equal volumes of RPMI medium 1640 with 5% FBS and 800 μg/ml Geneticin. Cells (5 × 10⁶) were trypsinized, washed once with 1× PBS, pelleted, and lysed with 1 M KOH (Sigma no. P4494) at 80°C for 1 h. The lysates were centrifuged at 16,000 × g for 10 min, and the absorbance of the supernatants was measured at 492 nm. To determine the melanin content of the transformants, a standard curve was generated with synthetic melanin (Sigma no. M0418) and prepared in 1 M KOH at 80°C for 1 h, covering a concentration range of 0–300 μg/ml.
Western Blotting.
Total protein was isolated from monolayer cells according to the manufacturer’s protocol (Santa Cruz Biotechnology), and 50 μg of protein was separated by 10% Tris·HCl denaturing gels, pH 8.8 (Bio-Rad), and blotted onto nitrocellulose membranes (Bio-Rad). Membranes were first incubated with anti-tyrosinase primary antibody (Santa Cruz Biotechnology no. sc-7834) and then with horseradish peroxidase-labeled secondary antibody. Subsequently, membranes were stripped with stripping buffer (Pierce) and reprobed with anti-actin primary antibody, and then with horseradish peroxidase-labeled secondary antibody (Chemicon International, Temecula, CA). Binding was detected by using luminol reagent (Santa Cruz Biotechnology).
Immunostaining.
Slides were prepared from formalin-fixed cell blocks and stained with anti-mouse tyrosinase antibody at a 1:25 dilution. Microwave antigen retrieval was conducted in 10 mM citrate buffer, pH 6.0. Endogenous peroxidase was blocked with 3% H2O2, and additional blocking was performed with normal rabbit serum. The primary antibody was diluted in 1.0% BSA in PBS and applied overnight at 4°C. Antibody staining was observed by using biotin-labeled anti-goat IgG and avidin–biotin (ABC-HRP; Vector Laboratories) followed by diaminobenzidine. Sections were counterstained with hematoxylin.
FACS Analysis.
Cell cycle times and rates of apoptosis were analyzed by FACS with the Acid-S and Apo-BrdU kits (Phoenix Flow Systems), respectively. Cells were seeded at 20–30% confluence in serum-starved (1% FBS) conditions and harvested 48 h later (per the manufacturer-suggested protocol) with Accutase and Accumax (Phoenix Flow Systems) cell detachment buffers. For the BrdU incorporation assay, cells were incubated with BrdU for 4 h. For each sample, 50,000 cells were counted by FACS, and the results were analyzed for statistical significance by using the Kolmogorov–Smirnov test.
Growth Curves.
Cells (1 × 10⁵) were plated in triplicate onto six-well plates and grown in medium containing 1% FBS over 96 h.
Invasion Assays.
The Matrigel assay for tumor invasion was performed as described in ref. 32.
Animal Studies.
All animal care was in accord with institutional guidelines, following a protocol approved by the University of California, San Francisco Committee on Animal Research. Transformant cells (3 × 10⁴) were administered to C57BL/6 mice by tail vein injection, and total tumor counts were analyzed by using the unpaired, two-sided Student’s t test as described in ref. 16.
Gene Expression Profiling Studies and Statistical Analysis.
RNA was extracted from various B16 clones by using TRIzol reagent (Invitrogen). Ten micrograms of total RNA, along with universal mouse reference RNA (Stratagene), was converted to aminoallyl-modified cDNA by oligo(dT)-primed polymerization using SuperScript II reverse transcriptase (Invitrogen), coupled to N-hydroxysuccinimidyl esters of Cy3 or Cy5 (Amersham Pharmacia), and then hybridized to a microarray slide as described in ref. 33. After linear normalization, log (base 2) transformation, and supervised hierarchical clustering, the resulting cluster data table was imported into the significance analysis of microarrays software package. Delta was chosen to limit the output gene list so that <5% predicted false positives would be included.
Microarrays.
From the total 15,658 cDNAs used in this study, ≈8,000 clones were from Incyte Corporation (Wilmington, DE), and the other 8,000 were from the National Institute on Aging clone set (Baltimore, MD; see ref. 34). Based on Unigene identifier (http://source.stanford.edu), these clones represent 10,953 unique genes.
Glucose and Lactate Levels.
The control and ribozyme-expressing B16 cells were seeded in triplicate over 96 h. The samples were processed for glucose and lactate levels by the Department of Laboratory Medicine (University of California, San Francisco, CA), with Synchron LX20 Pro (Beckman Coulter). The glucose and lactate levels were adjusted for the cell growth characteristics of each cell line by calculating the exponential growth factor, k, with the formula A = A0ekt. Glucose consumption and lactate production were calculated for 100,000 cells.
Acknowledgments
We thank Loretta Chan for assistance with immunostaining and Rosie Casella for manuscript preparation. This work was supported by the Zackheim Endowment Fund; American Cancer Society Grants RSG-03-247-01-MGO and R03 AR049378 (to M.K.-S.); a Damon Runyon Postdoctoral Fellowship (to S.L.); the Steven and Michelle Kirsch Foundation (E.H.B.); and Public Health Service Grants CA114337 (to M.K.-S.), CA96666 (to R.J.D.), and CA96840 (to E.H.B.).
Abbreviations
- TER
telomerase RNA
- TER 180 Rz
ribozyme targeting mouse TER at position 180.
Footnotes
Conflict of interest statement: No conflicts declared.
This paper was submitted directly (Track II) to the PNAS office.
References
- 1.Greider C. W., Blackburn E. H. Cell. 1987;51:887–898. doi: 10.1016/0092-8674(87)90576-9. [DOI] [PubMed] [Google Scholar]
- 2.Greider C. W., Blackburn E. H. Nature. 1989;337:331–337. doi: 10.1038/337331a0. [DOI] [PubMed] [Google Scholar]
- 3.Zakian V. A. Science. 1995;270:1601–1607. doi: 10.1126/science.270.5242.1601. [DOI] [PubMed] [Google Scholar]
- 4.Blackburn E. H. Nature. 2000;408:53–56. doi: 10.1038/35040500. [DOI] [PubMed] [Google Scholar]
- 5.Shay J. W., Bacchetti S. Eur. J. Cancer. 1997;33:787–791. doi: 10.1016/S0959-8049(97)00062-2. [DOI] [PubMed] [Google Scholar]
- 6.Hiyama E., Hiyama K. Oncogene. 2002;21:643–649. doi: 10.1038/sj.onc.1205070. [DOI] [PubMed] [Google Scholar]
- 7.Hahn W. C., Counter C. M., Lundberg A. S., Beijersbergen R. L., Brooks M. W., Weinberg R. A. Nature. 1999;400:464–468. doi: 10.1038/22780. [DOI] [PubMed] [Google Scholar]
- 8.Stewart S. A., Hahn W. C., O’Connor B. F., Banner E. N., Lundberg A. S., Modha P., Mizuno H., Brooks M. W., Fleming M., Zimonjic D. B., et al. Proc. Natl. Acad. Sci. USA. 2002;99:12606–12611. doi: 10.1073/pnas.182407599. [DOI] [PMC free article] [PubMed] [Google Scholar]
- 9.Komata T., Kanzawa T., Kondo Y., Kondo S. Oncogene. 2002;21:656–663. doi: 10.1038/sj.onc.1205072. [DOI] [PubMed] [Google Scholar]
- 10.Shay J. W., Wright W. E. Cancer Cell. 2002;2:257–265. doi: 10.1016/s1535-6108(02)00159-9. [DOI] [PubMed] [Google Scholar]
- 11.Blasco M. A. Curr. Opin. Genet. Dev. 2003;13:70–76. doi: 10.1016/s0959-437x(02)00011-4. [DOI] [PubMed] [Google Scholar]
- 12.Hahn W. C., Stewart S. A, Brooks M. W., York S. G., Eaton E., Kurachi A., Beijersbergen R. L., Meyerson M., Weinberg R. A. Nat. Med. 1999;5:1164–1170. doi: 10.1038/13495. [DOI] [PubMed] [Google Scholar]
- 13.Ludwig A., Saretzki G., Holm P. S., Tiemann F., Lorenz M., Emrich T. Cancer Res. 2001;61:3053–3061. [PubMed] [Google Scholar]
- 14.Saretzki G., Ludwig A., von Zglinicki T., Runnebaum I. B. Cancer Gene Ther. 2001;8:827–834. doi: 10.1038/sj.cgt.7700383. [DOI] [PubMed] [Google Scholar]
- 15.Li S., Rosenberg J. E., Donjacour A. A., Botchkina I. L., Hom Y. K., Cunha G. R., Blackburn E. H. Cancer Res. 2004;64:4833–4840. doi: 10.1158/0008-5472.CAN-04-0953. [DOI] [PubMed] [Google Scholar]
- 16.Nosrati M., Li S., Bagheri S., Ginzinger D., Blackburn E. H., Debs R. J., Kashani-Sabet M. Clin. Cancer Res. 2004;10:4983–4990. doi: 10.1158/1078-0432.CCR-04-0134. [DOI] [PubMed] [Google Scholar]
- 17.Gatenby R. A., Gillies R. J. Nat. Rev. Cancer. 2004;4:891–899. doi: 10.1038/nrc1478. [DOI] [PubMed] [Google Scholar]
- 18.Lay A. J., Jiang X. M., Kisker O., Flynn E., Underwood A., Condron R., Hogg P. J. Nature. 2000;408:869–873. doi: 10.1038/35048596. [DOI] [PubMed] [Google Scholar]
- 19.Tsutsumi S., Yanagawa T., Shimura T., Kuwano H., Raz A. Clin. Cancer Res. 2004;10:7775–7784. doi: 10.1158/1078-0432.CCR-04-1015. [DOI] [PubMed] [Google Scholar]
- 20.Elstrom R. L., Bauer D. E., Buzzai M., Karnauskas R., Harris M. H., Plas D. R., Zhuang H., Cinalli R. M., Alavi A., Rudin C. M., et al. Cancer Res. 2004;64:3892–3899. doi: 10.1158/0008-5472.CAN-03-2904. [DOI] [PubMed] [Google Scholar]
- 21.Kang S. S., Kwon T., Kwon D. Y., Do S. I. J. Biol. Chem. 1999;274:3085–3090. doi: 10.1074/jbc.274.19.13085. [DOI] [PubMed] [Google Scholar]
- 22.Halaban R., Cheng E., Zhang Y., Moellmann G., Hanlon D., Michalak M., Setaluri V., Hebert D. N. Proc. Natl. Acad. Sci. USA. 1997;94:6210–6215. doi: 10.1073/pnas.94.12.6210. [DOI] [PMC free article] [PubMed] [Google Scholar]
- 23.Halaban R., Patton R. S., Cheng E., Svedine S., Trombetta E. S., Wahl M. L., Ariyan S., Hebert D. N. J. Biol. Chem. 2002;277:14821–14828. doi: 10.1074/jbc.M111497200. [DOI] [PubMed] [Google Scholar]
- 24.Halaban R., Cheng E., Svedine S., Aron R., Hebert D. N. J. Biol. Chem. 2001;276:11933–11938. doi: 10.1074/jbc.M008703200. [DOI] [PubMed] [Google Scholar]
- 25.Zhang W., Piatyszek M. A., Kobayashi T., Estey E., Andreeff M., Deisseroth A. B., Wright W. E., Shay J. W. Clin. Cancer Res. 1996;2:799–803. [PubMed] [Google Scholar]
- 26.Liu L., Berletch J. B., Green J. G., Pate M. S., Andrews L. G., Tollefsbol T. O. Mol. Cancer Ther. 2004;3:1003–1009. [PubMed] [Google Scholar]
- 27.Ohta Y., Kijima H., Kashani-Sabet M., Scanlon K. J. J. Invest. Dermatol. 1996;106:275–280. doi: 10.1111/1523-1747.ep12340688. [DOI] [PubMed] [Google Scholar]
- 28.Li S., Crothers J., Haqq C. M., Blackburn E. H. J. Biol. Chem. 2005;280:23709–23717. doi: 10.1074/jbc.M502782200. [DOI] [PubMed] [Google Scholar]
- 29.Chang S., Khoo C. M., Naylor M. L., Maser R. S., DePinho R. A. Genes Dev. 2003;17:88–100. doi: 10.1101/gad.1029903. [DOI] [PMC free article] [PubMed] [Google Scholar]
- 30.Gupta P. B., Kuperwasser C., Brunet J.-P., Ramaswamy S., Kuo W. L., Gray J. W., Naber S. P., Weinberg R. A. Nat. Genet. 2005;37:1047–1054. doi: 10.1038/ng1634. [DOI] [PMC free article] [PubMed] [Google Scholar]
- 31.Good P. D., Krikos A. J., Li S. X., Bertrand E., Lee N. S., Giver L., Ellington A., Zaia J. A., Rossi J. J., Engelke D. R. Gene Ther. 1997;4:45–54. doi: 10.1038/sj.gt.3300354. [DOI] [PubMed] [Google Scholar]
- 32.Kashani-Sabet M., Liu Y., Fong S., Desprez P. Y., Liu S., Tu G., Nosrati M., Handumrongkul C., Ligget D., Thor A. D., Debs R. J. Proc. Natl. Acad. Sci. USA. 2002;99:3878–3883. doi: 10.1073/pnas.002025599. [DOI] [PMC free article] [PubMed] [Google Scholar]
- 33.Haqq C., Nosrati M., Sudilovsky D., Crothers J., Khodabakhsh D., Pulliam B. L., Federman S., Miller J. R., III, Allen R. E., Singer M. I., et al. Proc. Natl. Acad. Sci. USA. 2005;102:6092–6097. doi: 10.1073/pnas.0501564102. [DOI] [PMC free article] [PubMed] [Google Scholar]
- 34.Van Buren V., Piao Y., Dudekula D. B., Qian Y., Carter M. G., Martin P. R., Stagg C. A., Bassey U. C., Aiba K., Hamatani T., et al. Genome Res. 2002;12:1999–2003. doi: 10.1101/gr.633802. [DOI] [PMC free article] [PubMed] [Google Scholar]


