

Abstract
To identify the molecular changes that occur in non-small cell lung carcinoma (NSCLC), we compared the gene expression profile of the NCI-H292 (H292) NSCLC cell line with that of normal human tracheobronchial epithelial (NHTBE) cells. The NHTBE cells were grown in a three-dimensional organotypic culture system that permits maintenance of the normal pseudostratified mucociliary phenotype characteristic of bronchial epithelium in vivo. Microarray analysis using the Affymetrix oligonucleotide chip U95Av2 revealed that 1,683 genes showed a > 1.5-fold change in expression in the H292 cell line relative to the NHTBE cells. Specifically, 418 genes were downregulated and 1,265 were upregulated in the H292 cells. The expression data for selected genes were validated in several different NSCLC cell lines using quantitative real-time PCR and Western analysis. Further analysis of the differentially expressed genes indicated that WNT responses, apoptosis, cell cycle regulation and cell proliferation were significantly altered in the H292 cells. Functional analysis using fluorescence-activated cell sorting confirmed concurrent changes in the activity of these pathways in the H292 line. These findings show that (1) NSCLC cells display deregulation of the WNT, apoptosis, proliferation and cell cycle pathways, as has been found in many other types of cancer cells, and (2) that organotypically cultured NHTBE cells can be used as a reference to identify genes and pathways that are differentially expressed in tumor cells derived from bronchogenic epithelium.
Keywords: Microarray analysis, Gene expression profile, Biological pathways, Normal human tracheobronchial epithelium (NHTBE), Nonsmall cell lung cancer (NSCLC)
Introduction
Lung cancer remains a leading cause of cancer death, with an overall 10-year survival rate as low as 8–10% (Fry et al. 1999). It was estimated that more than 170,000 new cases of lung cancer would appear in the United States in 2003 and that about 150,000 individuals would die of the disease (Jemal et al. 2003). Lung cancer occurs in two major subtypes—nonsmall cell lung carcinoma (NSCLC) and small cell lung carcinoma. NSCLC accounts for approximately 80% of all cases, and is further classified as adenocarcinoma, squamous cell carcinoma or large cell carcinoma, based on cell morphology. It is widely accepted that the progenitor cell of adenocarcinoma and squamous cell carcinoma is the epithelial cell of the lung. Squamous cell carcinoma originates mainly from genetically altered surface epithelial cells in the conducting airways, while adenocarcinoma arises from alveolar type II epithelial cells in the lung itself. A better understanding of the etiology and pathogenesis of epithelial cancers should facilitate the identification of novel and better targets for the treatment and prevention of NSCLC.
The recent development of cDNA and oligonucleotide microarray analysis enables us to comprehensively analyze gene expression profiles in NSCLC cells and classify lung cancers at the molecular level (for recent reviews, see Petty et al. 2004; Whitsett et al. 2004 and references therein). However, the use of epithelial tissue from sites adjacent to tumors as the normal control in such studies has drawn criticism (Braakhuis et al. 2004), as this tissue often includes histologically normal but genetically abnormal cells (Braakhuis et al. 2003). In the present study we have used primary organotypically cultured normal human tracheobronchial epithelial (NHTBE) cells as our control. We previously demonstrated that primary TBE cells adopt the mucociliary epithelial organization found in vivo when grown and maintained in a retinoid-sufficient bronchial epithelial cell growth medium (BEGM) using a three-dimensional organotypic air-liquid interface (ALI) culture method. We have already demonstrated the utility of this system for studying the physiology of airway epithelium (a, Koo et al. 1999b). Given that lung cancers originate from epithelial cells and that NSCLC cell lines represent mixed histotypes, we chose the human mucoepidermoid pulmonary carcinoma line NCI-H292 (H292) as the counterpart of normal bronchial epithelial cells to identify differentially expressed genes. The H292 cells retain epithelial morphology in culture, and are defined as a mucin-producing NSCLC cell line because they stain positive for mucicarmine (mucous differentiation). They also stain positively for keratin and vimentin, which are indicative of squamous differentiation. The cells have been widely used as surrogate epithelial cells for studying the regulation of MUC5AC, a marker for mucin gene expression in the mucous goblet cell of the bronchial surface epithelium (Takeyama et al. 1999; Koo et al. 2002; Lemjabbar and Basbaum 2002).
We used RNAs isolated from fully differentiated NHTBE cells and from the H292 NSCLC cell line to identify expressed genes by oligonucleotide microarray analysis on Affymetrix chips. The results revealed that 1,683 genes were differentially expressed (i.e., showed a > 1.5-fold change in transcription level). Analysis of the differentially expressed genes revealed concurrent alterations in several biological pathways, including WNT and apoptosis pathways, cell cycle regulation and cell proliferation, in the H292 cell line. The differential expression of selected genes was further verified by real-time PCR and Western analysis in several other NSCLC cell lines. The NHTBE cells promise to be a useful control for the study of lung epithelial carcinogenesis. This study describes alterations in biological networks associated with NSCLC carcinogenesis, and provides a valuable resource for the identification and characterization of diagnostic markers and targets for lung cancer prevention and therapeutics.
Materials and methods
Three-dimensional organotypic ALI culture of NHTBE cells
Passage 1 NHTBE cells (Clonetics, San Diego, CA, USA) were subcultured once and then stored in liquid nitrogen. The stored cells were used for further cultures as described previously (a, Koo et al. 1999b). Briefly, 1×10⁵ passage-2 NHTBE cells were seeded onto 24-mm permeable membranes (Transwell-Clear culture inserts; Corning, Acton, MA, USA) in a 1:1 mixture of BEGM (Clonetics) and Dulbecco’s Modified Eagle’s Medium (DMEM) supplemented with insulin (5 μg/ml), hydro-cortisone (0.072 μg/ml), epidermal growth factor (0.5 ng/ml), T3 (10−8 M), transferrin (10 μg/ml), epinephrine (0.6 μg/ml), bovine pituitary extract (0.8%), BSA (0.5 mg/ml), gentamicin (50 μg/ml) and retinoic acid (5×10⁻⁸ M). The cultures were kept submerged for the first 7 days, and the medium was removed from the apical compartment to provide the air-liquid interface (ALI) on day 7 or 8 when the cultures were confluent. Culture was continued under these conditions for a further 21 days (changing the medium daily) to generate fully differentiated mucociliary bronchial epithelial cells.
Culture of NSCLC cell lines
The NSCLC cell lines NCI-H226 (H226), H292, NCI-H520 (H520), NCI-H1563 (H1536), NCI-H1703 (H1703), NCI-H1734 (H1734), NCI-H1975 (H1975), NCI-H2228 (H2228), NCI-H2170 (H2170), and A549 were purchased from the American Type Culture Collection (Manassas, VA, USA). All of the cell lines were maintained in RPMI 1640 medium (Gibco BRL, Life Technologies, Grand Island, NY, USA) supplemented with 10% fetal bovine serum (Hyclone, Logan, Utah), penicillin (100 U/ml), and streptomycin (100 mg/ml) on treated, nonpyrogenic, polystyrene tissue culture dishes at 37°C and a pH of 7.0–7.2 in a humidified atmosphere (95% air/5% CO2). Total RNA for microarray analysis and real-time PCR, and whole-cell lysates for Western analysis, were prepared from the cultured cells 3 days after the monolayers had become confluent.
Histology
For histological analysis, NHTBE and H292 cells were grown on porous membrane inserts (Transwell-Clear plates) in their optimal media (BEGM:DMEM mixture and RPMI with 10% FBS, respectively; see above) for 28 and 10 days, respectively. The detailed method was described previously (Gray et al. 1996; Koo et al. 1999b). The cultures were fixed in 10% neutral buffered formalin, embedded in paraffin, sectioned, and stained with hematoxylin-eosin (HE). The sections were then examined under the microscope and photographed.
RNA and oligonucleotide microarray preparation
Total RNA was extracted from cells using the RNeasy Kit (Qiagen, Valencia, CA, USA) according to the manufacturer’s protocol. The Affymetrix (Santa Clara, CA, USA) GeneChip U95Av2 was employed for microarray hybridizations. This GeneChip carries 12,626 human genes. Each gene is represented by 11–20 different 25mers referred to as perfect match (PM) oligonucleotides, and each PM oligonucleotide is paired with a mismatch (MM) oligonucleotide having a 1-base mismatch at the thirteenth base. Each of the 11–20 PM–MM pairs representing a gene is termed a ‘probe set’. Thus, the U95Av2 chip contains 12,626 probe sets. The oligonucleotides are directly synthesized on a silicon chip using a combination of photolithography and combinatorial chemistry.
For microarray hybridization, we followed the protocol described in the Affymetrix manual to synthesize double-stranded cDNA from mRNA and then used this cDNA to synthesize complementary RNA (cRNA). The cRNA was labeled and used for hybridization with the GenChips. Briefly, 5 μg of total RNA was converted into first-strand cDNA by reverse transcription (RT) in a 20-μl reaction containing 200 U of SuperScript II (Invitrogen, Carlsbad, CA, USA) and 100 pmol of T7-(dT)24 primer [5′-GGCCAGTGAATTGTAATACGACTCACTATAGGGAGGCGG-(dT)24-3′ (GeneSet, San Diego, CA, USA). The reaction was incubated at 42°C for 1 h. The second strand of the cDNA was synthesized at 16°C for 2 h in the presence of DNA polymerase I (40 U), DNA ligase (10 U), RNase H (2 U), and 1x second strand buffer (Invitrogen). The double-stranded cDNA was then blunt-ended using 20 U of T4 DNA polymerase, purified by extraction with phenol/chloroform, and transcribed into cRNA in the presence of biotin-labeled ribonucleotides using the BioArray HighYield RNA Transcript Labeling Kit (Affymetrix) as described by the manufacturer. This biotin-labeled cRNA was purified using the Qiagen RNeasy Kit, quantified, and fragmented by incubation at 94°C for 35 min in the presence of 1 (fragmentation buffer [40 mM TRIS-acetate (pH 8.0), 100 mM potassium acetate, and 30 mM magnesium acetate]. The fragmented cRNA was then used for hybridization to the U95Av2 chip at 42°C for 16 h. The chips were washed and stained using Affymetrix GeneChip Fluidic, and scanned and visualized using a GeneArray Scanner (Hewlett-Pacrkard, Palo Alto, CA, USA).
To maintain experimental consistency, approximately equal numbers of cells were collected at similar stages, and the same group of researchers performed the RNA isolation and microarray hybridization in a repeat experiment.
Data collection and bioinformatic analysis
The microarray hybridization data were collected using the Affymetrix Microarray Suite 5.0 software (MAS 5.0). After collection, the data were exported to the Affymetrix MicroDB for further analysis using the Affymetrix Data Mining Tool 3.0 (DMT). The signal-intensity data extracted with the DMT were statistically analyzed using S-plus 2000 software (Mathsoft, Cambridge, MA, USA) to obtain correlation coefficients and scatter plots for evaluation of the reproducibility and quality of the array analysis. The qualified data sets were then analyzed using DNA-Chip Analyzer software (dChip) (Li and Wong 2001). Briefly, the array data sets were first normalized using a default baseline array; the PM–MM model was then employed to calculate the expression values. To identify the differentially expressed genes using dChip, we set 100 as the average signal-intensity difference to avoid the effects of unreliable low intensity, and used the lower confidence bound of fold change (LBFC; 90%) as the conservative relative change (1.5×). The differentially expressed genes were then subjected to clustering, categorical, and pathway analysis using dChip and public databases such as PubMed (http://www.ncbi.nlm.nih.gov/entrez/query.fcgi?db=PubMed), EASEonline (http://david.niaid.nih.gov/david/upload1.asp) and the Kyoto Encyclopedia of Genes and Genomes (KEGG, http://www.genome.ad.jp/kegg/). Details of the genes (and gene products) specifically considered in this present work are listed in the Tables.
Quantitative real-time PCR (qRT-PCR)
We used qRT-PCR to validate 15 of the differentially expressed genes identified via microarray analysis. The primer pairs used are listed in Table 1. PCR was performed in 25-μl volumes in an iCycler (Bio-Rad, Hercules, CA, USA) using SYBR Green PCR Core Reagents (Applied Biosystems). The reaction contained 0.2-mM primers (Invitrogen), 3-mM MgCl2, and 3 μl of the RT mix. The housekeeping gene glyceraldehyde-3-phosphate dehydrogenase (GAPDH) was chosen as the reference. Each sample was duplicated in each run, and the experiment was repeated four times. The reactions for tested genes and GAPDH were set up in separate wells of the same 96-well plate, and a prerun using a well factor solution (Bio-Rad) to subtract the background was carried out, followed by an initial denaturation step at 95°C for 10 min. PCR was performed for 40 cycles of denaturation at 95°C for 20 s, and elongation at 60°C for 60 s. Because GAPDH was consistently expressed at a moderate level in the microarray experiment, each PCR result was normalized against the value for GAPDH.
Table 1.
Primer pairs used for qRT-PCR
| Target gene | Sequence (5′–3′) |
|---|---|
| AATF | TCAGCCTGTCCCAGAGAGTT and CGAAGGAGCTGGTGGTAAAA (AATF) |
| AKT | CACACCACCTGACCAAGATG and CTGGCCGAGTAGGAGAACTG-3′ |
| API5 | ACAGGCCGACCTAGAACAGA and AGGGAGAACCTGCTCACAGA |
| AXL | GACGGGTCTGTGTCCAATCT and ACGAGAAGGCAGGAGTTGAA |
| BCLX | GGAGCTGGTGGTTGACTTTC and CTCCGATTCAGTCCCTTCTG |
| CDK1 | CTTTTCCATGGGGATTCAGA and AGGCTTCCTGGTTTCCATTT |
| CYCS | TGGGGAAATTGCTTCACTGT and CTTCAACCCTTGCCTTTAAGA |
| GAS6 | GGACCTCGTGCAGCCTATAA and CCTGGATGGTGGTGTCTTCT |
| IGFBP4 | GACCATCGTCCTTCCTCTCA and GTCTGGACCTCGTGACCATT |
| KRT6E | CATTGGAGGTGGCTTCAGTT and GAGGAGGAGGTGGTGGTGTA |
| LOH11CR2A | AACCCAAGCCTGATGTCAAC and ACTTGCTGGAGTCTCCCTGA |
| MYC | GGCAAAAGGTCAGAGTCTGG and GTGCATTTTCGGTTGTTGC |
| SFRP1 | GCTCCAGTTTGCATTTGGAT and ACCTGAGCCTCCTGCATCTA |
| TF | CCTGATCCATGGGCTAAGAA and CCTCCACAGGTTTCCTGGTA |
| TP53 | TTTGGGTCTTTGAACCCTTG and CCACAACAAAACACCAGTGC |
Western analysis
Western analysis used to confirm that differential gene expression was reflected at the translation level. Antibodies raised against beta-catenin (E-5, 1:500), CDK1 (B-6, 1:1000), CCNB1 (GNS-1, 1:1000), GAS6 (D-18, 1:1000), AKT (C-20, 1:1000), API (IAP-1, 1:1000), and BCL2 (C-2, 1:1000) were purchased from Santa Cruz Biotechnology (Santa Cruz, CA, USA). An anti-β-actin antibody (AC-15, 1:5,000) was purchased from Sigma (St. Louis, MO, USA) and used as an internal control. Whole-cell extracts were obtained by lysing cells with 1 ml of lysis buffer [(20% glycerol, 4% SDS, and 0.3% dichlorodiphenyltrichloroethane in 20 mM TRIS–HCl, (pH 6.8)] per well. The cell lysate was quantified, and a total of 30 μl of the lysate was electrophoresed on SDS-polyacrylamide gels (10%) and transferred to nitrocellulose membranes. Membranes were blocked, incubated with primary antibodies, and subsequently incubated with diluted (1:2,000) horseradish peroxidase-conjugated goat antirabbit IgG or goat antimouse IgG (Bio-Rad). Labeled bands were detected using the SuperSignal West Pico Chemiluminescent Substrate (Pierce, Rockford, Ill.) and exposed to Hyper MP autoradiography film (Amersham, Little Chalfont, Bucks., UK) or Kodak Scientific Image Film (Eastman Kodak, Rochester, NY, USA). β-Actin was used as an internal control.
Fluorescence-activated cell sorting (FACS)
FACS was used to monitor the cell cycle, apoptosis, cell proliferation, and the mitochondrial membrane potential. For cell cycle analysis, cells were seeded in 2 ml of medium at a density of 1×10⁵ cells/well in 6-well plates. After the cells had reached confluence, the attached cells were flushed twice with 1× phosphate-buffered saline (PBS), trypsinized, washed, and resuspended in 1xPBS.
For cell cycle analysis, a 2-ml aliquot of cell suspension (approximately 106 cells) was added to 5 ml of 95% ethanol under gentle vortexing, and then fixed for at least 30 min at room temperature. The fixed cells were then pelleted by centrifugation, resuspended in 1 ml of (50 μg/ml) propidium iodide (PI; Sigma) and 100 μl of 1 mg/ml RNase (Roche, Indianapolis, Ind.), and incubated at 37°C for 30 min before being loaded onto a FACScan (BD Biosciences, Franklin Lakes, NJ, USA).
For apoptosis analysis, the cell pellet (~106 cells) obtained after trypsinization and washing was resuspended and stained using the Annexin-V-FLUOS staining kit (Roche) as described in the manufacturer’s instructions. Cells that had not been stained with annexin were used as the controls.
For cell proliferation analysis, cells were seeded into 6-well culture plates at a density of 1×10⁵ cells/well. After the cells reached the exponential growth stage, bromodeoxyuridine (BrdU) was added directly to the medium at a final concentration of 10 μM. The cells were incubated at 37°C for 60 min and stained using the Anti-BrdU-FITC Kit (BD Biosciences) following the manufacturer’s instructions. Cells that had not been exposed to anti-BrdU-FITC were used as controls. The absorbance of the FITC at 488 nm was measured using a FACScan (BD Biosciences).
For mitochondrial membrane potential analysis, the mitochondrial membrane potential was normalized and measured using two-color staining with MitoTracker Green (MTGreen) and CMXRosamine (CMXRos) dyes (Molecular Probes, Eugene, OR, USA). Confluent cells were harvested and resuspended at a concentration of 106 cells/ml in prewarmed cell culture medium. A 1-ml aliquot was removed to a 15-ml Falcon tube and incubated in a 37°C water bath for at least 5 min. Next, 1 μl each of the dye stock solutions (200 μM MTGreen and 200 μM CMXRos) was added to the cell suspension and mixed well. The cell suspension was incubated at 37°C for 60 min in the dark. The cells were then washed three times using 1 ml of 1xPBS, and the cell pellet was resuspended in 500 μl of medium. Immediately after staining, flow cytometry was performed with a FACScan (BD Biosciences) using an excitation wavelength of 488 nm. We measured the emissions with a 530-nm bandpass filter for MTGreen and a 630-nm long-pass filter for CMXRos.
Statistical analysis
The qRT-PCR and FACS data were subjected to statistical analysis. The qRT-PCR experiment was repeated two to four times with duplicates of each sample. In each qRT-PCR, a GAPDH standard curve was generated using the log-starting quantity of a serial dilution of the RT mix. The serial dilution factor was 1/2n (n = 5); each dilution was measured in duplicate. Data acquisition and standard curve generation were performed using an iCycler 3.0 (Bio-Rad). Transcript levels were calculated from the slope of the standard curve using the formula x(y − b)/}a, where x is the log10 value of the transcript-starting amount, y is the Ct value, a is the slope, and b is the y interception. The relative change was obtained using the ratio of inverse log10 values of x between the tumor and normal cells. Standard errors (SE) were obtained for the fold change based on the repeated QRT-PCR experiments using statistical functions in the Excel software program (Microsoft, Redmond, WA, USA).
The FACS analysis was repeated at least three times. FACS data were collected using a FACScan (BD Biosciences) and analyzed using the WinMDI software (version 2.8) (http://facs.scripps.edu/software.html) and Excel statistical functions.
Results
Histological analysis of NHTBE and H292 cells grown in ALI culture
Primary or early passage NHTBE cells were cultured under organotypic ALI conditions in defined serum-free medium supplemented with growth factors and hormones as described previously (a, Koo et al. 1999b). The morphological pattern of differentiation mimicked that of pseudostratified mucociliary bronchial epithelium in vivo, as shown in Fig. 1. Basal cells attached to the basement membrane and a significant number of ciliated cells were clearly visible in the polarized columnar epithelium that formed in the culture system. Under these conditions, the ability of these cells to differentiate into mucous and ciliated cells was maintained. The use of ALI cultures for the study of bronchial epithelial cell biology was demonstrated previously (Gray et al. 1996; Kolodziejski et al. 2002; Koo et al. 1999b; Singer et al. 2004). In sharp contrast, H292 NSCLC cell lines cultured under similar conditions generated multiple layers of cells that did not display any obvious basal-apical polarity.
Fig. 1.
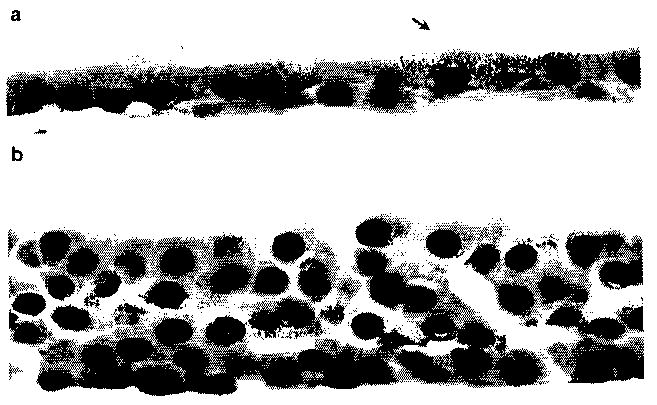
a, b Histological analysis of NHTBE and H292 cells grown in ALI culture. a NHTBE cells were grown under ALI conditions in the presence of retinoic acid (5×10⁻⁸ M) for 28 days, then fixed in 10% neutral buffered formalin, embedded in paraffin, sectioned, and stained with hematoxylin and eosin. For the detection of mucous goblet cells, the section was also stained with Alcian Blue-Periodic Acid Schiff s (arrows). b Histological section of H292 cells grown in RPMI1640 supplemented with 10% fetal bovine serum for 10 days in ALI culture were prepared and stained with hematoxylin and eosin as described above for NHTBE cells
Oligonucleotide microarray analysis
To elucidate the molecular events involved in lung epithelial carcinogenesis, we examined global gene expression in NHTBE cells and the H292 cell line using the Affymetrix oligonucleotide chip U95Av2 as described in Materials and methods. The experiment was performed in duplicate. To check the quality of the experiment, we generated scatter plots and calculated correlation coefficients between replicates. We found a strong correlation between replicates within the same samples. The correlation coefficient was 0.97 for NHTBE replicates (Fig. 2a) and 0.99 for H292 replicates (Fig. 2b), and the linear relationship in the x–y plane was close to diagonal (Fig. 2a, b), indicating that the replicates within the samples were highly reproducible and consistent. In contrast, the relationship between replicates of different samples (Fig. 2c–f) was marked by a high degree of scatter and was not linear. Accordingly, the correlation coefficients (0.79, 0.79, 0.85, and 0.85, respectively) were much lower than those for within-sample comparisons, indicating that the nature of the samples had a greater effect on data variation than handing error. Therefore, we concluded that these microarray hybridizations were successful and likely to provide reliable data for further analysis.
Fig. 2.
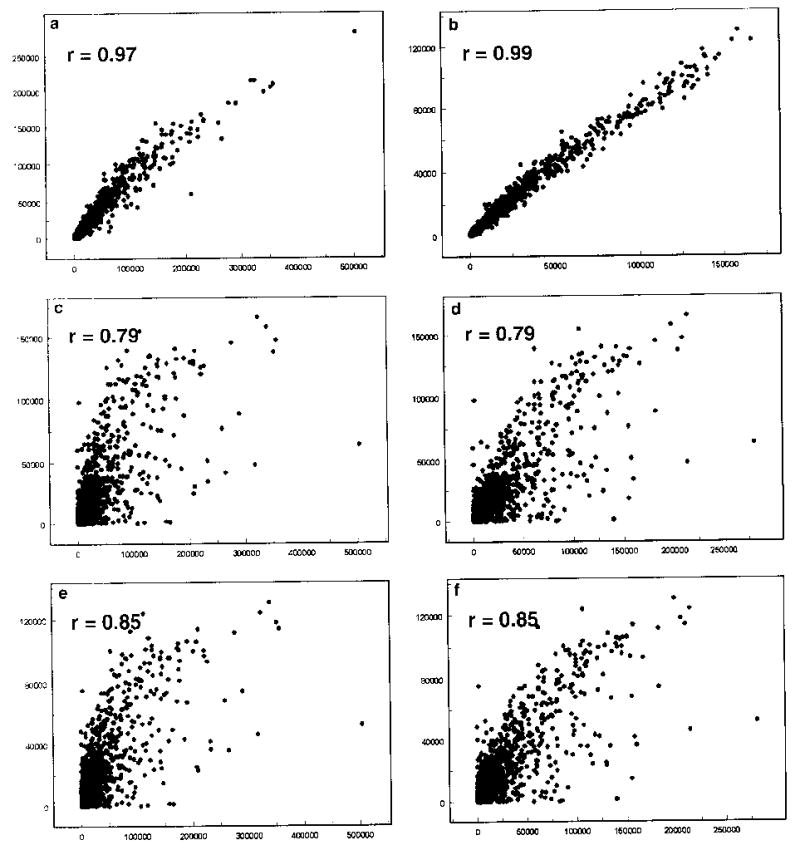
a–f Scatter plots of microarray signal intensity data. a Replicates of NHTBE plotted against each other. b Replicates of H292. c Replicate 1 of NHTBE versus replicate 1 of H292. d Replicate 1 of NHTBE versus replicate 2 of H292. e Replicate 2 of NHTBE versus replicate 1 of H292. f Replicate 2 of NHTBE versus replicate 2 of H292. r is the correlation coefficient
Differentially expressed genes and the gene expression profile
After qualification and quantification of the microarray experiment, gene expression in the two cell lines was analyzed, and differentially expressed genes were identified using dChip. Out of 12,625 genes analyzed, 418 were downregulated, and 1,265 were upregulated by at least 1.5-fold in H292 cells relative to the NHTBE cells. The downregulated genes included genes related to the cytoskeleton structure, immunoglobulins, inflammatory stress, the basement membrane, small cytokines, stress responses, and tumor suppressors. The upregulated genes were related mainly to antiapoptosis, the cell cycle, cell growth, extracellular proteins, heat shock proteins, nucleic acid-binding proteins, transcription, and translation. These differentially expressed genes provided the pool for further genomic analysis on biological pathways, biomarkers therapeutic targets (data not shown).
Elucidation of biological pathways
To elucidate the biological pathways affected in the H292 cells, we first used the ‘Classify Genes’ option in dChip to separate the 1,683 differentially expressed genes into ontology groups. Based on molecular functions, we obtained 1,158 gene ontology groups (approximately 1.5 unique genes per group). Disregarding the more general group categories (such as cell, receptor, kinase, inhibitor, and enzyme), we focused on identification of the groups associated with particular functions and pathways. After data mining, we found that the expression of genes in 30 ontology groups closely related to apoptosis, cell cycle, cell proliferation, and WNT responses (Table 2) were substantially altered in the H292 cell line when compared with NHTBE cells. These groups contained 594 genes representing 146 unique genes (approximately 5.1 unique genes per group), which were subsequently assigned to the four pathways. The overlapping genes were arbitrarily assigned to one or other of these pathways using published information from PubMed, EASEonline, and KEGG. In summary, 38, 56, 48, and 10 unique genes were assigned to the apoptosis, cell cycle, proliferation, and WNT pathways, respectively (data not shown). Differentially expressed genes that showed a more than three-fold change or are directly) related to the WNT, cell cycle, proliferation, and apoptosis pathways are listed in Table 3.
Table 2.
Gene ontology (GO) classification of differentially expressed genes related to the apoptosis, cell cycle, and proliferation pathways, identified via microarray analysis
| GO group | Number of genes |
|---|---|
| Apoptosis | 35 |
| Apoptosis inhibitor | 7 |
| Apoptosis regulator | 7 |
| Cell cycle | 77 |
| Cell cycle arrest | 8 |
| Cell cycle checkpoint | 8 |
| Cell cycle control | 50 |
| Cell cycle regulator | 8 |
| Cell death | 38 |
| Cell proliferation | 75 |
| Control of mitosis | 4 |
| DNA replication and chromosome cycle | 21 |
| G1/S transition in mitotic cell cycle | 8 |
| G2/M transition in mitotic cell cycle | 6 |
| Ligand-regulated transcription regulator | 11 |
| M phase | 13 |
| M phase of mitotic cell cycle | 13 |
| Mitosis | 13 |
| Mitotic cell cycle | 37 |
| Positive control of cell proliferation | 21 |
| Negative control of cell proliferation | 14 |
| Regulation of CDK activity | 6 |
| S phase of mitotic cell cycle | 16 |
| Transcription | 99 |
| Transcription factor | 20 |
| Transcription regulator | 48 |
| Translation elongation factor | 1 |
| Translation factor | 20 |
| Translation initiation factor | 5 |
| WNT signaling | 10 |
Table 3.
Differentially expressed genes related to WNT pathways, apoptosis, or cell proliferation-identified via microarray analysis
| Gene symbola | Gene (product) description | LBFCb | Relative change based on qRT-PCR | Western analysis |
|---|---|---|---|---|
| WNT pathway related | ||||
| Beta-catenin | Catenin (cadherin-associated protein), beta 1 (88 kDa) | 1.9 | NA | Confirmed |
| CBP | CREB-binding protein | 2.3 | NA | |
| CK1 | Casein kinase 1 | 1.7 | NA | |
| CK2 | Casein kinase 2 | 3.8 | NA | |
| Dvl | Human Disheveled protein | 2.1 | NA | |
| GAS6 | Growth arrest-specific 6 | 2.4 | 18.6 ± 2.0 | Confirmed |
| MYC | v-myc myelocytomatosis viral oncogene homolog | 3.3 | 6.2 ± 2.3 | |
| SFRP1 | Secreted Frizzled-related protein 1 | 24.3 | 12.8 ± 5.4 | |
| TCF | T-cell factor | 2.1 | NA | |
| Cell cycle related | ||||
| CCNB1 | Cyclin B1 | 3.0 | NA | Confirmed |
| CDK1 | Cyclin-dependent kinase 1 | 1.4 | 8.0 ± 1.4 | Confirmed |
| CITED2 | Cbp/p300-interacting transactivator | 5.2 | NA | |
| E2F3 | E2F transcription factor 3 | 3.2 | NA | |
| FEN1 | Flap structure-specific endonuclease 1 | 4.7 | NA | |
| MAD2L1 | MAD2 [mitotic arrest deficient-like 1 (yeast)] | 3.9 | NA | |
| PDGFA | Platelet-derived growth factor alpha polypeptide | 6.6 | NA | |
| SMC1L1 | SMC1 [structural maintenance of chromosomes 1-like 1 (yeast)] | 3.6 | NA | |
| SMC4L1 | SMC4 [structural maintenance of chromosomes 4-like 1 (yeast)] | 3.9 | NA | |
| TP53 | Tumor protein p53 (Li-Fraumeni syndrome) | 3.0 | 23.3 ± 11.4 | |
| Apoptosis related | ||||
| AATF | Apoptosis-antagonizing transcription factor | 2.4 | 43.5 ± 2.7 | |
| AKT | v-akt murine thymoma viral oncogene | 1.2 | 23.0 ± 2.5 | Confirmed |
| API5 | Apoptosis inhibitor 5 | 1.5 | 38.4 ± 2.3 | Confirmed |
| BCL2 | B-cell lymphoma/leukemia-2 | 2.3 | NA | |
| BCLX | BCL2-like 1 | 1.2 | 17.7 ± 2.1 | |
| CYCS | Cytochrome c | 2.9 | 27.8 ± 1.7 | |
| FANCG | Fanconi’s anemia, complementation group G | −9.0 | NA | |
| LOH11CR2A | Loss of heterozygosity, 11, chromosomal region 2, gene A | −6.2 | −33.9 ± 17.5 | |
| Cell proliferation | ||||
| AKR1C3 | Aldo-keto reductase family 1, member C3 | −3.6 | NA | |
| AXL | AXL receptor tyrosine kinase | 24.7 | 2.9 ± 1.4 | |
| CSE1L | CSE1 [chromosome segregation 1-like (yeast)] | 3.9 | NA | |
| EGFR | Epidermal growth factor receptor (v-erb-b oncogene) | 3.4 | NA | |
| FSCN1 | Singed-like (Drosophila) (fascin homolog, sea urchin) | 5.5 | NA | |
| GPNMB | Glycoprotein (transmembrane) Nmb | −4.5 | NA | |
| IGFBP4 | Insulin-like growth factor-binding protein 4 | 6.6 | 2.6 ± 0.7 | |
| MATK | Megakaryocyte-associated tyrosine kinase | 3.6 | NA | |
| RARRES3 | Retinoic acid receptor responder (tazarotene induced) 3 | −9.6 | NA | |
| SERPINF1 | Serine (or cysteine) proteinase inhibitor | −3.5 | NA | |
| TGFBI | Transforming growth factor beta-induced | 3.5 | NA | |
| Others | ||||
| KRT6E | Keratin 6 | −5.4 | −64.0 ± 29. 7 | |
| TF | Transferrin | −22.5 | −18.5 ± 6.6 | |
NA not available
Gene symbols obtained from EASEonline
The data shown indicate the relative changes in expression (LBFC. lower confidence bound of fold change) obtained from microarray analysis. Positive and negative numbers represent upregulation and downregulation, respectively, in H292 cells
The data shown indicate the relative changes in expression (± SE) obtained from QRT-PCR analysis. The values are averages of two to four QRT-PCR experiments.
Western analysis was used to confirm expression of some of the gene products
Validation of the differentially expressed genes
A subset of the differentially expressed genes was chosen for validation by qRT-PCR and Western analysis (Table 3). Fifteen genes, SFRP1, CDK1, MYC, AXL, GAS6, IGFBP4, AATF, AKT, API5, BCLX, CYCS, LOH11CR2A, TP53, KRT6E, and TF, were selected for qRT-PCR validation. SFRP1, which is related to the WNT pathway, was upregulated 12.8-fold in H292 cells compared to NHTBE cells. The cell cycle genes CDK1 and MYC were upregulated 8.0- and 6.2-fold, respectively; the proliferation genes AXL, GAS6, and IGFBP4 were upregulated 2.9-, 18.6-, and 2.6-fold, respectively. The antiapoptosis genes AATF, AKT, API5, and BCLX were upregulated by 43.5-, 23.0-, 38.4-, and 17.7-fold, respectively; the proapoptosis gene LOH11CR2A was downregulated by 33.9-fold, and the proapoptosis genes CYCS and TP53 were upregulated by 27.8- and 23.3-fold, respectively.
Seven genes, Beta-catenin, CDK1, CCNB1, GAS6, AKT, API5, and BCL2, were selected to validate gene expression at the translation level in the NSCLC cell lines H292, H1975, H226, H2170, H520, H1734, H1703, A549, H1536, and H2228 using Western analysis. The transcription levels of these genes in H292 cells were determined by microarray analysis or qRT-PCR. Western analysis revealed that the levels of their products were also elevated in H292 cells compared with those in NHTBE cells (Fig. 3). The expression levels of the proteins Beta-catenin, GAS6, AKT, API5, and BCL2 varied among the different lung cancer cell lines tested. Strikingly, CDK1 and CCNB1 were highly expressed in almost all of the lung cancer cell lines but not in NHTBE cells. The gene expression levels detected by qRT-PCR and Western analysis were in good agreement with those detected by microarray analysis (Table 3).
Fig. 3.
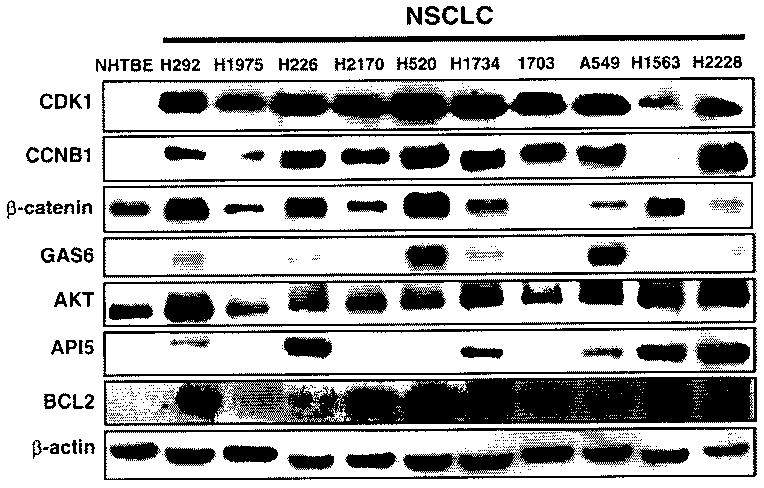
Western analysis of selected gene products in various cell lines to validate that the differential expression of genes detected in H292 cells is reflected at the translation level. All of the tested proteins were evaluated in H292 cells and in NHTBE cells (β-actin was used as an internal control)
Validation by FACS analysis of changes in apoptosis, cell cycle kinetics, and cell proliferation
As the expression of genes related to the apoptosis, cell cycle, and proliferation pathways was greatly altered in H292 cells relative to the NHTBE cells, we used FACS analysis to verify that the processes they are expected to mediate or control were altered in a similar manner. Cell cycle analysis using propidium iodide staining indicated that there were significant differences in the numbers of cells in the M4 (apoptotic or necrotic cells), G1/G0, S, and G2 phases between H292 and NHTBE cells (Fig. 4a–c). A significantly lower percentage of H292 cells was found to be in the M4, G1/G0, and G2 phases compared with NHTBE cells, but a significantly higher percentage was in S phase (Fig. 4c). These findings indicate that in H292 cells both the G1/S and G2/M transitions are altered. To confirm these findings and this interpretation, we used more specific methods to analyze apoptosis and cell proliferation in NHTBE and H292 cells (see Materials and methods). To analyze apoptosis. we used Annexin-V-FLUOS in combination with PI to distinguish apoptotic and necrotic cells from viable cells by characterizing the loss of plasma membrane asymmetry, and we performed mitochondrial membrane potential analysis with MTGreen and CMXRos to further elucidate the interaction between BCL2 and CYCS in the H292 cells. The Annexin-V-FLUOS experiment showed that 27.04% of the NHTBE cells underwent programmed cell death, but only 2.05% of the H292 cells did so (Fig. 4d). Analysis of the mitochondrial membrane potential also showed a statistically significant difference between NHTBE and H292 cells (Fig. 5). Specifically, H292 cells showed significantly less loss of membrane potential than NHTBE cells did. This may be due mainly to BCL2-dependent inhibition of the release of CYCS from the mitochondria in the H292 cells.
Fig. 4.
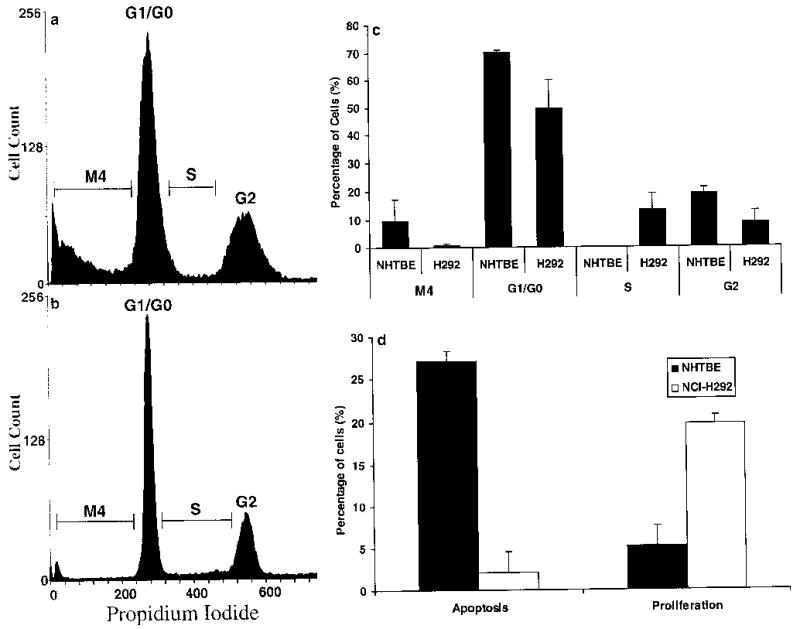
a–d FACS analysis of the cell cycle, apoptosis, and proliferation in NHTBE and H292 cells. Panels a and b show the results of repeated experiments, which indicate that there were significant differences between the two cell lines. a NHTBE cells. A significantly higher percentage of the NHTBE cells is in the M4 (apoptosis or necrosis) or G2 phase. b H292 cells. A significantly higher percentage of H292 cells is in S phase. c Summary of the statistical analysis. d Comparisons of rates of apoptosis and cell proliferation between the NHTBE and H292 cells indicate that the H292 cells are more active in proliferation and less active in apoptosis. Thus, about 19.75% of the H292 cells progressed from the G1 checkpoint to S phase, but only about 5.16% of the NHTBE cells were in S phase. Moreover, only 2.05% of the H292 cells, compared with 27.04% of the NHTBE cells, were found to be apoptotic
Fig. 5.
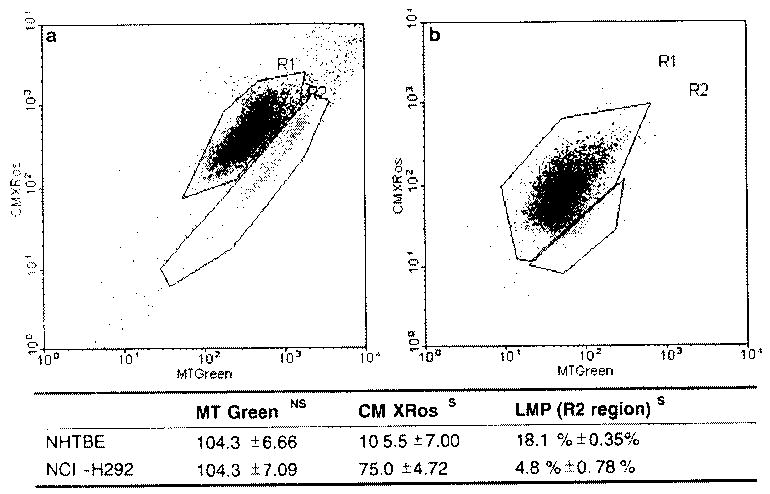
a, b Measurement of apoptosis based on the loss of mitochondrial membrane potential. Cells were treated with MTGreen (which stains all mitochondria) and CMXRos (which enters mitochondria that show a loss of membrane potential). Panels a and b show combination dot plots for total NHTBE (a) and H292 (b) cells stained with both agents. Areas marked R2 encompass the apoptotic cells, which show a loss of mitochondrial membrane potential. The Table below the graphs summarizes the data obtained from the membrane potential analysis. The values in the MTGreen and CMXRos columns represent the total events (numbers of cells) detected in the MTGreen and CMXRos channels. The MTGreen value is a measure of the number of mitochondria per cell, the CMXRos value is a measure of the induction of apoptosis, as indicated by a drop in mitochondrial membrane potential. The values in the LMP column indicate the percentages of apoptotic cells (those located in the R2 region) in the two dot plots. NS and S represent nonsignificant and significant differences between the NHTBE and H292 cells
In addition, to measure cell proliferation, we calculated the ratio of BrdU-stained nuclei to the total number of nuclei. Immunohistochemical staining using an anti-BrdU-FITC antibody indicated that 19.75% of the H292 cells but only 5.16% of the NHTBE cells were in the S phase (Fig. 4d). Thus, the H292 cells show a significantly higher rate of cell cycle progression and cell proliferation and a lower level of apoptosis than the NHTBE cells.
Discussion
It is generally accepted that NSCLC, adenocarcinoma and squamous cell carcinoma in the lung generally arise from airway and alveolar epithelial cells. Numerous previous microarray analyses of NSCLC tissues and cell lines focused on survival prediction, molecular characteristics, tumor classification, target identification, and tumor and cell line integration (Petty et al. 2004; Whitsett et al. 2004). However, the use of morphologically normal tissue taken from sites adjacent to tumor tissue as the normal control has provoked concern. In addition, it has been well documented that bronchial epithelia cells do not retain the normal mucociliary phenotype if they are grown and maintained submerged in culture medium on a two-dimensional plastic culture plate (Wu et al. 1990; Ostrowski and Nettesheim 1995). In this study we used organotypically cultured, fully differentiated, normal primary bronchial epithelial cells, which recapitulate the in vivo differentiation of bronchial epithelia as our normal control. The H292 NSCLC cell line was used as the tumor counterpart for microarray analysis and several NSCLC cell lines maintained under their optimal culture conditions were used to verify differential expression of selected genes.
In order to evaluate the usefulness of our model for the study of lung carcinogenesis, we compared our results with gene expression-profiling studies recently done by others using lung specimens and cell lines (Nacht et al. 2001; Amatschek et al. 2004; Kettunen et al. 2004). One should note that it is difficult to compare studies that use different array platforms or methods (cDNA array; cDNA subtraction; serial analysis of gene expression, SAGE), different types of specimens (tumor tissue vs. normal tissue; tumor tissue vs. tumor cell lines), and different analytical and statistical algorithms, as already pointed out by Kettunen et al. (2004). These differences could contribute to a certain degree of disagreement among studies. We found that our set of differentially expressed genes showed 86.7%, 68.4%, and 62.5% agreement with those presented by Kettunen et al. (2004), Amatschek et al. (2004) and Nacht et al. (2001), respectively (Table 4). Of the upregulated genes identified by Kettunen et al (2004) in a comparison of tumor tissue with normal tissue, 15 genes overlapped with our set, and 13 (86.7%) of these, including the genes for integrin beta 4 (ITGB4), retinoic acid receptor gamma (RARG), insulin-like growth factor-binding protein 5 (IGFBP5), and integrin alpha 6 (I TGA6)—those most highly upregulated in lung specimens—agreed with the expression changes detected in this study. These results indicate that the organotypically cultured primary bronchial epithelial cells could be a useful model for normal controls in the study of lung epithelial carcinogenesis.
Table 4.
Comparison of differentially expressed genes identified in the present study with data from previous studies
| Gene product (name) | LBFC | Compatible with previous findings |
|---|---|---|
| A kinase (PRKA) anchor protein (gravin) 12 (AKAP12) | 26.5 | Noa |
| Arachidonate 5-lipoxygenase (ALOX5) | −18.3 | Yesa |
| BENE | −3.1 | Yesa |
| Bone morphology protein 5 (BMP5) | −2.2 | Yesa |
| Caveolin 1 (CAV1) | 1.8 | Noa |
| Cyclin B1 (CCNB1) | 3.0 | Yesa,b |
| Collagen 4, alpha 2 (COL4A2) | 3.5 | Yesa |
| Desmoplakin I (DPI) | 6.4 | Yesa,b |
| High-mobility group protein (HMGI) | 2.2 | Yesa |
| Insulin-like growth factor-binding protein 5 (IGFBP5) | 2.5 | Yesa |
| Integrin beta 4 (ITGB4) | 1.9 | Yesa |
| Integrin group | 2.8 | Yesa |
| Integrin, alpha 6 (ITGA6) | 3.0 | Yesa |
| Retinoic acid receptor, gamma (RARG) | 2.3 | Yesa |
| STAT induced STAT inhibitor 3 (SOCS3) | −2.1 | Yesa |
| Aldo-keto reductase family 1, member C3 (AKR1C3) | −5.3 | Nob |
| Bullous pemphigoid antigen 1 (230/240kD) (BPAG1) | 7.3 | Yesb |
| Calumenin (CALU) | 2.6 | Yesb |
| Cytochrome P450, subfamily I (CYP1B1) | 2.2 | Yesb |
| Glycoprotein (transmembrane) nmb (GPNMB) | −7.9 | Nob |
| Glyoxalase 1 (GLOI) | 1.9 | Yesb |
| Keratin 6A (KRT6A) | −7.0 | Nob |
| Laminin, gamma 2 (LAMC2) | −2.8 | Nob |
| Ornithine decarboxylase 1 (ODC1) | 4.5 | Yesb |
| Parathyroid hormone-like hormone (PTHLH) | 2.1 | Yesb |
| Phosphoglycerate kinase 1 (PGK1) | 1.9 | Yesb |
| Prostaglandin-endoperoxide synthase 2 (PGES2) | 5.4 | Yesb |
| RAN, member RAS oncogene family (RAN) | 2.8 | Yesb |
| Reticulocalbin 1, EF-hand calcium-binding domain (RCN1) | 2.9 | Yesb |
| Transmembrane 4 super family member 1 (TM4SF1) | −2.7 | Nob |
| Trefoil factor 3 (intestinal) (TFF3) | −2.7 | Nob |
| Tripartite motif-containing 29 (TRIM29) | 2.9 | Yesb |
| Aldo-keto reductase family 1, member B10 (AKR1B10) | −2.4 | Noc |
| Keratin 14 (KRT14) | −2.3 | Yesc |
| Keratin 17 (KRT17) | 5.2 | Noc |
| Keratin 19 (KRT19) | −3.8 | Yesc |
| Keratin 6A (KRT6A) | −7.0 | Yesc |
| Mucin 1 (MUC1) | −6.3 | Noc |
| Small proline-rich protein 1B (Cornifin) | −5.5 | Yesc |
| Tubulin, beta polypeptide (TubulinB) | 2.5 | Yesc |
We also assigned the differentially expressed genes to biological pathways, and found that genes related to the WNT, apoptosis and cell cycle pathways, and to cell proliferation, were concurrently deregulated in the NSCLC cells. A scheme depicting the biological network consisting of three pathways [WNT, cell cycle and apoptosis, which include the mitochondrially and tumor necrosis factor (TNF)-regulated pathways], and the proliferation phenotype, that are deregulated in H292 cells was constructed based on our findings and data mining using public database PubMed and the KEGG (Fig. 6).
Fig. 6.
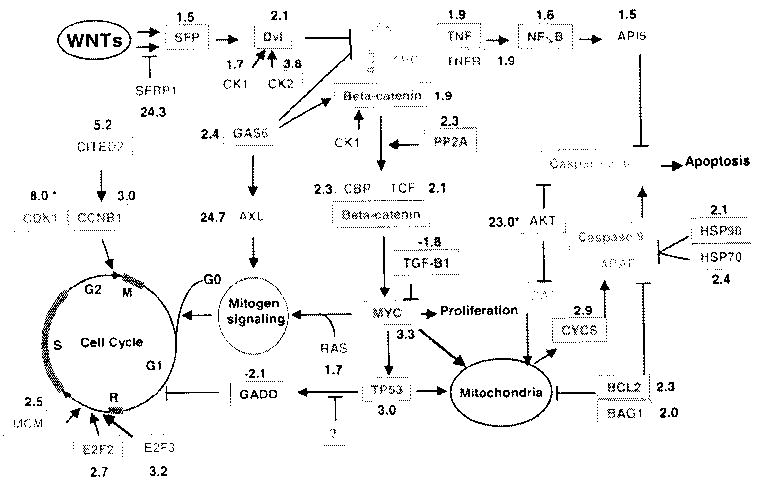
Schematic representation of the genetic networks that are altered in H292 cells. The network consists of the pathways mediating WNT responses, cell cycle regulation, apoptosis (which includes mitochondrially and TNF-regulated pathways), and cell proliferation. The genes in green showed no change, the genes in red were upregulated, and the genes in blue were downregulated in H292 cells. The numbers in black indicate the LBFC (see Materials and methods), while the numbers marked with asterisks were obtained from qRT-PCR results. DVL, human Disheveled protein; CK1 casein kinase 1; CK2, casein kinase 2; GSK, glycogen synthase kinase 3 beta; PP2A, protein phosphatase 2A; CBP, CREB-binding protein; TCF, T-cell factor; TGF-B1, transforming growth factor-beta 1; RAS, Ras; GADD, growth arrest and DNA-damage-inducible gene; E2F2, E2F transcription factor 2; MCM, minichromosome maintenance deficient; TNFR, TNF receptor; NF-κB, nuclear factor-κB; HSP70, heat shock protein 70 kD; HSP90, heat shock protein 90 kD; APAF1, apoptotic protease activating factor 1; BAD, Bcl-XL/Bcl-2-associated death gene; BAG1. BCL2-associated athanogene 1
The WNT pathway has been shown to be involved in approximately 90% of colorectal cancers (Giles et al. 2003), Although differential regulation of components of the the WNT pathway such as β-catenin and Disheveled (Dvl) was previously reported in lung cancer (Smythe et al. 1999), the role of the WNT pathway in lung epithelial carcinogenesis is much less clear. In the current study, we found that 10 WNT pathway-related genes (SFP, SFRP1, CK1, CK2, Dvl, GAS6, β-catenin, PP2A, CBP, and TCF) were upregulated in H292 cells. Formation of WNT-SFP complexes triggers activation of the WNT pathway by activating Dvl, which is also activated through phosphorylation by casein kinase (CK) (Willert et al. 1997). The activated Dvl inhibits formation of a complex comprising Beta-catenin, APC, Axin, and GSK. GAS6, a growth factor, inhibits GSK activity and induces upregulation of cytosolic Beta-catenin (Goruppi et al. 2001). The tumor suppressor genes coding for APC, Axin, and GSK did not show changes in expression in H292 cells, but those for CBP and TCF, which form a transcriptional regulatory complex with β-catenin, were significantly upregulated in H292 cells. Activation of the WNT pathway can account for the overexpression of MYC (which is one of the pathway’s critical targets) and an oncogene that has been demonstrated to be overexpressed in NSCLC (Broers et al. 1993).
Surprisingly, SFRP1 was also overexpressed in H292 cells. SFRPs have been reported to sequester WNTs by direct binding (Uren et al. 2000), thus inactivating the WNT pathway. WNTs are secreted growth-factor-like proteins that include at least 19 different isotypes. However, not every isotype induces the release of β-catenin and enhances expression of targets of the WNT pathway. Recent discoveries have demonstrated that WNT5a inhibits B cell proliferation and suppresses hematopoietic malignancies (Liang et al. 2003), and promotes degradation of β-catenin (Topol et al. 2003). WNT7a was also reported to be absent, or present in reduced amounts, in lung cancer cells and primary tumors (Calvo et al. 2000). WNT5a and WNT7a have both been implicated as potential tumor suppressor genes (Ohiro et al. 2003; Topol et al. 2003). Thus, further studies will be needed to clarify whether SFRP1 sequesters tumor-suppressing WNTs and prevents tumor-suppressing signals from reaching the WNT pathway. Taken together, our results strongly suggest that the WNT pathways play an important role in lung epithelial cell carcinogenesis.
Genes involved in cell cycle regulation and cell proliferation were also upregulated in H292. Cell cycle genes—specifically CCNB1 and CDK1, the key regulators of the G2/M transition—were ubiquitously overexpressed in all of the NSCLC cell lines tested, but their expression levels were significantly lower in the NHTBE cells (Fig. 3). CCNB1 and CDK1 form a complex that promotes the G2/M cell cycle transition (Pines 1999; Wasner et al. 2003). It has been reported that patients whose tumors expressed CCNB1 at a high level had a significantly shorter survival time than did patients whose tumors expressed CCNB1 at a low level (Soria et al. 2000), but the roles of the CCNB1-CDK1 complex in lung carcinogenesis is unclear. Further studies of these two genes in NSCLC may contribute to the identification of biomarkers or therapeutic targets. Expression of many cell-proliferation-related genes was substantially altered (at least threefold) in H292 cells. Specifically, the antiproliferation genes RARRES3, GPNMB, AKR1C3, and SERPINF1 were downregulated, and the pro-proliferation genes EGFR, TGFBI, MATK, CSE1, FSCN1, and IGFBP4 were upregulated in H292 cells. In addition, AXL is known to be involved in the neoplastic transformation of fibroblast and leukemia cells (O’Bryan et al. 1991; Neubauer et al. 1997) and GAS6 induces expression of AXL. Both GAS6 and AXL were substantially upregulated in H292 cells. Further characterization of these genes and their functions in normal epithelial cells and lung cancer cells may be helpful in understanding cell cycle regulation and cell proliferation in NSCLC.
Apoptosis was blocked in H292 cells. Apoptosis is regulated by two pathways involving mitochondrial components and TNF, respectively (Budihardjo et al. 1999; Datta et al. 1999). In H292 cells, BCL2, BAG1, AKT, and heat shock proteins may block the mitochondrial pathway that induces apoptosis. BCL2, which has been previously reported to be abnormally expressed in NSCLC (Han et al. 2002), blocks the release of CYCS by blocking the mitochondria voltage-dependent anion channel (Shimizu et al. 1999). HSP70 and HSP90 have been reported to be antiapoptotic proteins (Beere et al. 2000; Pandey et al. 2000). HSP70 is localized in both the cytoplasm and the nucleus in 90% of NSCLC cells (Malusecka et al. 2001). HSP70 binds to APAF1 and prevents the recruitment of caspases to the apoptosome complex (Beere et al. 2000), while HSP90 inhibits CYCS-mediated oligomerization of APAF1 and subsequent activation of procaspase 9 (Pandey et al. 2000). The TNF pathway may contribute to the inhibition of apoptosis in H292 cells, as genes for key members of the TNF pathway (TNF, TNF receptor, nuclear factor-κB, and API) were all substantially upregulated in H292 cells.
Although we maintained primary NHTBE, H292, and other NSCLC cells under conditions that are optimal for culture of the respective lines, as shown by us and others (Rose et al. 2001; Koo et al. 2002), and performed experiments when cultures had reached a stable plateau phase in order to minimize the effect of exponential cell growth on the expression profiles, a caveat to the interpretation of our current results is that the gene expression profiles were compared between NHTBE cells and pulmonary mucoepidermoid NCI-H292 cell line, and thus some of the profiles may only represent subsets of genes unique to the in vitro culture system. Further verification of the differentially expressed genes using clinical tumor samples is required. However, it is noteworthy that the organotypic bronchial epithelial cells in culture, which mimic in vivo airway epithelium, can provide a useful model system for understanding the progression of normal bronchial epithelial cells to premalignant and malignant transformation.
In summary, by comparing the gene expression profile of H292 NSCLC cells with that of NHTBE cells cultured in a three-dimensional organotypic culture system, we were able to identify genes (CCNB1 and CDK1, etc.) which could be potential biomarkers and therapeutic targets. Our results suggest that the abnormal growth and survival of the NSCLC cells results from concurrent deregulation of WNT, apoptosis and cell cycle pathways. These pathways were also found to be altered in many other types of cancer cells. Our findings help to elucidate parts of the intricate networks that are altered in NSCLC cells and provide a gene pool for the identification of biomarkers or therapeutic targets.
Acknowledgments
We thank Dr. Guillermina Lozano for her valuable suggestions regarding experiments and this manuscript. This work was supported by National Cancer Institute grant N01-CN-05023-39 (to L.S.), U.S. Department of Defense grant DAMD 17-02-1-0706 01 (to J.S.K.), and National Institute of Environmental Health Sciences grant 5K22-ES-000362 (to J.S.K.)
Footnotes
Communicated by G. Georgiev
References
- Amatschek S, Koenig U, Auer H, Steinlein P, Pacher M, Gruenfelder A, Dekan G, Vogl S, Kubista E, Heider KH, Stratowa C, Schreiber M, Sommergruber W. Tissue-wide expression profiling using cDNA subtraction and microarrays to identify tumor-specific genes. Cancer Res. 2004;64:844–856. doi: 10.1158/0008-5472.can-03-2361. [DOI] [PubMed] [Google Scholar]
- Beere HM, Wolf BB, Cain K, Mosser DD, Mahboubi A, Kuwana T, Tailor P, Morimoto RI, Cohen GM, Green DR. Heat-shock protein 70 inhibits apoptosis by preventing recruitment of procaspase-9 to the Apaf-1 apoptosome. Nat Cell Biol. 2000;2:469–475. doi: 10.1038/35019501. [DOI] [PubMed] [Google Scholar]
- Braakhuis BJ, Tabor MP, Kummer JA, Leemans CR, Brakenhoff RH. A genetic explanation of Slaughter’s concept of field cancerization: evidence and clinical implications. Cancer Res. 2003;63:1727–1730. [PubMed] [Google Scholar]
- Braakhuis BJ, Leemans CR, Brakenhoff RH. Using tissue adjacent to carcinoma as a normal control: an obvious but questionable practice. J Pathol. 2004;203:620–621. doi: 10.1002/path.1549. [DOI] [PubMed] [Google Scholar]
- Broers JL, Viallet J, Jensen SM, Pass H, Travis WD, Minna JD, Linnoila RI. Expression of c-myc in progenitor cells of the bronchopulmonary epithelium and in a large number of non-small cell lung cancers. Am J Respir Cell Mol Biol. 1993;9:33–43. doi: 10.1165/ajrcmb/9.1.33. [DOI] [PubMed] [Google Scholar]
- Budihardjo I, Oliver H, Lutter M, Luo X, Wang X. Biochemical pathways of caspase activation during apoptosis. Annu Rev Cell Dev Biol. 1999;15:269–290. doi: 10.1146/annurev.cellbio.15.1.269. [DOI] [PubMed] [Google Scholar]
- Calvo R, West J, Franklin W, Erickson P, Bemis L, Li E, Helfrich B, Bunn P, Roche J, Brambilla E, Resell R, Gemmill RM, Drabkin HA. Altered HOX and WNT7A expression in human lung cancer. Proc Natl Acad Sci USA. 2000;97:12776–12781. doi: 10.1073/pnas.97.23.12776. [DOI] [PMC free article] [PubMed] [Google Scholar]
- Datta SR, Brunet A, Greenberg ME. Cellular survival: a play in three Akts. Genes Dev. 1999;13:2905–2927. doi: 10.1101/gad.13.22.2905. [DOI] [PubMed] [Google Scholar]
- Fry WA, Phillips JL, Menck HR. Ten-year survey of lung cancer treatment and survival in hospitals in the United States: a national cancer data base report. Cancer. 1999;86:1867–1876. doi: 10.1002/(sici)1097-0142(19991101)86:9<1867::aid-cncr31>3.0.co;2-9. [DOI] [PubMed] [Google Scholar]
- Giles RH, van Es JH, Clevers H. Caught up in a Wnt storm: Wnt signaling in cancer. Biochim Biophys Acta. 2003;1653:1–24. doi: 10.1016/s0304-419x(03)00005-2. [DOI] [PubMed] [Google Scholar]
- Goruppi S, Chiaruttini C, Ruaro ME, Varnum B, Schneider C. Gas6 induces growth, beta-catenin stabilization, and T-cell factor transcriptional activation in contact-inhibited C57 mammary cells. Mol Cell Biol. 2001;21:902–915. doi: 10.1128/MCB.21.3.902-915.2001. [DOI] [PMC free article] [PubMed] [Google Scholar]
- Gray TE, Guzman K, Davis CW, Abdullah LH, Nettesheim P. Mucociliary differentiation of serially passaged normal human tracheobronchial epithelial cells. Am J Respir Cell Mol Biol. 1996;14:104–112. doi: 10.1165/ajrcmb.14.1.8534481. [DOI] [PubMed] [Google Scholar]
- Han H, Landreneau RJ, Santucci TS, Tung MY, Macherey RS, Shackney SE, Sturgis CD, Raab SS, Silverman JF. Prognostic value of immunohistochemical expressions of p53, HER-2/neu, and bcl-2 in stage I non-small-cell lung cancer. Hum Pathol. 2002;33:105–110. doi: 10.1053/hupa.2002.30183. [DOI] [PubMed] [Google Scholar]
- Jemal A, Murray T, Samuels A, Ghafoor A, Ward E, Thun MJ. Cancer statistics, 2003. CA Cancer J Clin. 2003;53:5–26. doi: 10.3322/canjclin.53.1.5. [DOI] [PubMed] [Google Scholar]
- Kettunen E, Anttila S, Seppanen JK, Karjalainen A, Edgren H, Lindstrom I, Salovaara R, Nissen AM, Salo J, Mattson K, Hollmen J, Knuutila S, Wikman H. Differentially expressed genes in nonsmall cell lung cancer: expression profiling of cancer-related genes in squamous cell lung cancer. Cancer Genet Cytogenet. 2004;149:98–106. doi: 10.1016/S0165-4608(03)00300-5. [DOI] [PubMed] [Google Scholar]
- Kolodziejski PJ, Musial A, Koo JS, Eissa NT. Ubiquitination of inducible nitric oxide synthase is required for its degradation. Proc Natl Acad Sci USA. 2002;99:12315–12320. doi: 10.1073/pnas.192345199. [DOI] [PMC free article] [PubMed] [Google Scholar]
- Koo JS, Jetten AM, Belloni P, Yoon JH, Kim YD, Nettesheim P. Role of retinoid receptors in the regulation of mucin gene expression by retinoic acid in human tracheobronchial epithelial cells. Biochem J. 1499a;338:351–357. [PMC free article] [PubMed] [Google Scholar]
- Koo JS, Yoon JH, Gray T, Norford D, Jetten AM, Nettesheim P. Restoration of the mucous phenotype by retinoic acid in retinoid-deficient human bronchial cell cultures: changes in mucin gene expression. Am J Respir Cell Mol Biol. 1999b;20:43–52. doi: 10.1165/ajrcmb.20.1.3310. [DOI] [PubMed] [Google Scholar]
- Koo JS, Kim YD, Jetten AM, Belloni P, Nettesheim P. Overexpression of mucin genes induced by interleukin-1 beta, tumor necrosis factor-alpha, lipopolysaccharide, and neutrophil elastase is inhibited by a retinoic acid receptor alpha antagonist. Exp Lung Res. 2002;28:315–332. doi: 10.1080/01902140252964393. [DOI] [PubMed] [Google Scholar]
- Lemjabbar H, Basbaum C. Platelet-activating factor receptor and ADAM 10 mediate responses to Staphylococcus aureus in epithelial cells. Nat Med. 2002;8:41–46. doi: 10.1038/nm0102-41. [DOI] [PubMed] [Google Scholar]
- Li C, Wong WH. Model-based analysis of oligonucleotide arrays: expression index computation and outlier detection. Proc Natl Acad Sci USA. 2001;98:31–36. doi: 10.1073/pnas.011404098. [DOI] [PMC free article] [PubMed] [Google Scholar]
- Liang H, Chen Q, Coles AH, Anderson SJ, Pihan G, Bradley A, Gerstein R, Jurecic R, Jones SN. Wnt5a inhibits B cell proliferation and functions as a tumor suppressor in hematopoietic tissue. Cancer Cell. 2003;4:349–360. doi: 10.1016/s1535-6108(03)00268-x. [DOI] [PubMed] [Google Scholar]
- Malusecka E, Zborek A, Krzyzowska-Gruca S, Krawczyk Z. Expression of heat shock proteins HSP70 and HSP27 in primary non-small cell lung carcinomas. An immunohistochemical study. Anticancer Res. 2001;21:1015–1021. [PubMed] [Google Scholar]
- Nacht M, et al. Molecular characteristics of non-small cell lung cancer. Proc Natl Acad Sci USA. 2001;98:15203–15208. doi: 10.1073/pnas.261414598. [DOI] [PMC free article] [PubMed] [Google Scholar]
- Neubauer A, Burchert A, Maiwald C, Gruss HJ, Serke S, Huhn D, Wittig B, Liu E. Recent progress on the role of Axl, a receptor tyrosine kinase, in malignant transformation of myeloid leukemias. Leuk Lymphoma. 1997;25:91–96. doi: 10.3109/10428199709042499. [DOI] [PubMed] [Google Scholar]
- O’Bryan JP, Frye RA, Cogswell PC, Neubauer A, Kitch B, Prokop C, Espinosa R, III, Le Beau MM, Earp HS, Liu ET. axl, a transforming gene isolated from primary human myeloid leukemia cells, encodes a novel receptor tyrosine kinase. Mol Cell Biol. 1991;11:5016–5031. doi: 10.1128/mcb.11.10.5016. [DOI] [PMC free article] [PubMed] [Google Scholar]
- Ohira T, et al. WNT7a induces E-cadherin in lung cancer cells. Proc Natl Acad Sci USA. 2003;100:10429–10434. doi: 10.1073/pnas.1734137100. [DOI] [PMC free article] [PubMed] [Google Scholar]
- Ostrowski LE, Nettesheim P. Inhibition of ciliated cell differentiation by fluid submersion. Exp Lung Res. 1995;21:957–970. doi: 10.3109/01902149509031773. [DOI] [PubMed] [Google Scholar]
- Pandey P, Salch A, Nakazawa A, Kumar S, Srinivasula SM, Kumar V, Weichselbaum R, Nalin C, Alnemri ES, Kufe D, Kharbanda S. Negative regulation of cytochrome c-mediated oligomerization of Apaf-1 and activation of procaspase-9 by heat shock protein 90. EMBO J. 2000;19:4310–4322. doi: 10.1093/emboj/19.16.4310. [DOI] [PMC free article] [PubMed] [Google Scholar]
- Petty RD, Nicolson MC, Kerr KM, Collie-Duguid E, Murray GI. Gene expression profiling in non-small cell lung cancer: from molecular mechanisms to clinical application. Clin Cancer Res. 2004;10:3237–3248. doi: 10.1158/1078-0432.CCR-03-0503. [DOI] [PubMed] [Google Scholar]
- Pines J. Four-dimensional control of the cell cycle. Nat Cell Biol. 1999;1:E73–E79. doi: 10.1038/11041. [DOI] [PubMed] [Google Scholar]
- Rose MC, Nickola TJ, Voynow JA. Airway mucus obstruction: mucin glycoproteins, MUC gene regulation and goblet cell hyperplasia. Am J Respir Cell Mol Biol. 2001;25:533–537. doi: 10.1165/ajrcmb.25.5.f218. [DOI] [PubMed] [Google Scholar]
- Shimizu S, Narita M, Tsujimoto Y. Bcl-2 family proteins regulate the release of apoptogenic cytochrome c by the mitochondrial channel VDAC. Nature. 1999;399:483–487. doi: 10.1038/20959. [DOI] [PubMed] [Google Scholar]
- Singer M, Martin LD, Vargaftig BB, Park J, Gruber AD, Li Y, Adler KB. A MARCKS-related peptide blocks mucus hypersecretion in a mouse model of asthma. Nat Med. 2004;10:193–196. doi: 10.1038/nm983. [DOI] [PubMed] [Google Scholar]
- Smythe WR, Williams JP, Wheelock MJ, Johnson KR, Kaiser LR, Albelda SM. Cadherin and catenin expression in normal human bronchial epithelium and non-small cell lung cancer. Lung Cancer. 1999;24:157–168. doi: 10.1016/s0169-5002(99)00032-x. [DOI] [PubMed] [Google Scholar]
- Soria JC, Jang SJ, Khuri FR, Hassan K, Liu D, Hong WK, Mao L. Overexpression of cyclin B1 in early-stage non-small cell lung cancer and its clinical implication. Cancer Res. 2000;60:4000–4004. [PubMed] [Google Scholar]
- Takeyama K, Dabbagh K, Lee HM, Agusti C, Lausier JA, Ueki IF, Grattan KM, Nadel JA. Epidermal growth factor system regulates mucin production in airways. Proc Natl Acad Sci USA. 1999;96:3081–3086. doi: 10.1073/pnas.96.6.3081. [DOI] [PMC free article] [PubMed] [Google Scholar]
- Topol L, Jiang X, Choi H, Garrett-Beal L, Carolan PJ, Yang Y. Wnt-5a inhibits the canonical Wnt pathway by promoting GSK-3-independent beta-catenin degradation. J Cell Biol. 2003;162:899–908. doi: 10.1083/jcb.200303158. [DOI] [PMC free article] [PubMed] [Google Scholar]
- Uren A, Reichsman F, Anest V, Taylor WG, Muraiso K, Bottaro DP, Cumberledge S, Rubin JS. Secreted Frizzled-related protein-1 binds directly to Wingless and is a biphasic modulator of Wnt signaling. J Biol Chem. 2000;275:4374–4382. doi: 10.1074/jbc.275.6.4374. [DOI] [PubMed] [Google Scholar]
- Wasner M, Tschop K, Spiesbach K, Haugwitz U, Johne C, Mossner J, Mantovani R, Engeland K. Cyclin B1 transcription is enhanced by the p300 coactivator and regulated during the cell cycle by a CHR-dependent repression mechanism. FEBS Lett. 2003;536:66–70. doi: 10.1016/s0014-5793(03)00028-0. [DOI] [PubMed] [Google Scholar]
- Whitsett JA, et al. Functional genomics of lung disease. Am J Respir Cell Mol Biol. 2004;31:S1–S81. doi: 10.1165/rcmb.2004-0071SU. [DOI] [PubMed] [Google Scholar]
- Willert K, Brink M, Wodarz A, Varmus H, Nusse R. Casein kinase 2 associates with and phosphorylates dishevelled. EMBO J. 1997;16:3089–3096. doi: 10.1093/emboj/16.11.3089. [DOI] [PMC free article] [PubMed] [Google Scholar]
- Wu R, Martin WR, Robinson CB, St George JA, Plopper CG, Kurland G, Last JA, Cross CE, McDonald RJ, Boucher R. Expression of mucin synthesis and secretion in human tracheobronchial epithelial cells grown in culture. Am J Respir Cell Mol Biol. 1990;3:467–478. doi: 10.1165/ajrcmb/3.5.467. [DOI] [PubMed] [Google Scholar]