Abstract
Protein targeting to glycogen (PTG) is a scaffolding protein that targets protein phosphatase 1α (PP1α) to glycogen, and links it to enzymes involved in glycogen synthesis and degradation. We generated mice that possess a heterozygous deletion of the PTG gene. These mice have reduced glycogen stores in adipose tissue, liver, heart, and skeletal muscle, corresponding with decreased glycogen synthase activity and glycogen synthesis rate. Although young PTG heterozygous mice initially demonstrate normal glucose tolerance, progressive glucose intolerance, hyperinsulinemia, and insulin resistance develop with aging. Insulin resistance in older PTG heterozygous mice correlates with a significant increase in muscle triglyceride content, with a corresponding attenuation of insulin receptor signaling. These data suggest that PTG plays a critical role in glycogen synthesis and is necessary to maintain the appropriate metabolic balance for the partitioning of fuel substrates between glycogen and lipid.
Introduction
Insulin stimulates glycogen synthesis and inhibits glycogen degradation by promoting the net dephosphorylation of glycogen synthase and phosphorylase (1–4). This net dephosphorylation is accomplished by the inhibition of protein kinases and the activation of protein phosphatases, such as protein phosphatase 1α (PP1α) (5–7). Insulin produces the dephosphorylation of only a small subset of proteins at discrete locations, whereas PP1 is ubiquitously expressed and is found in virtually all cellular compartments, suggesting that mechanisms exist for the targeted regulation of PP1 in insulin-responsive cells that selectively permit activation of the enzyme only at these sites. One clue to this dilemma has emerged from the identification of “targeting” subunits that allow for the compartmentalized activation of the phosphatase, resulting in the specific dephosphorylation of discrete pools of proteins within the cell.
Four glycogen-targeting subunits of PP1 have been reported: GM, GL, PPP1R6, and protein targeting to glycogen (PTG) (8–11). These targeting proteins actually serve as molecular scaffolds, juxtaposing the enzyme with its substrates in a macromolecular complex, and in the process exerting profound effects on PP1 activity and glycogen metabolism. GM is expressed specifically in skeletal muscle and heart. Mice possessing a homozygous deletion of the GM gene display reduced skeletal muscle glycogen stores and attenuated activation of glycogen synthesis in response to contraction, but no changes in glucose homeostasis or insulin sensitivity (12). The liver-specific targeting subunit GL lacks a discernible glycogen synthase binding site, but binds active phosphorylase with high affinity (13) and may negatively regulate glycogen synthesis under certain conditions. PTG binds to glycogen synthase, phosphorylase, and phosphorylase kinase in vitro (11) and dramatically increases basal and insulin-stimulated glycogen synthesis upon overexpression in cells (14, 15). Similarly, rats overexpressing PTG in liver by adenoviral infection demonstrate improved glucose tolerance (16).
Methods
Generation of PTG heterozygous knockout mice.
The PTG gene targeting vector was microinjected into 129/Sv embryonic stem cells. Positive chimeric male pups were identified by Southern blotting and were then crossed with female C57BL/6J mice to produce PTG heterozygous mice on a mixed 129/Sv, C57BL/6J genetic background. In order to analyze animals on a homogenous genetic background, male PTG heterozygous mice were backcrossed with female C57BL/6J mice for five successive generations. Animals were housed under controlled temperature (23°C) and lighting (12 hour light/dark cycle) with free access to water and standard mouse chow. The University of Michigan Animal Care and Use Committee approved all procedures.
Analysis of protein levels by Western blotting and immunoprecipitation.
Tissues were isolated from 1- to 2-month old PTG+/– and wild-type mice between 8 am and 10 am and then immediately frozen in liquid nitrogen. Tissue homogenates were prepared with buffer containing 50 mM HEPES (pH 7.8), 10 mM NaCl, 10% glycerol, 1% Triton X-100, and protease inhibitors using a ground glass dounce homogenizer. Homogenates were spun at 12,000 g for 20 minutes at 4°C, and the supernatants were quantified by the Bradford method. One hundred micrograms of total protein was resolved on 4–20% SDS-PAGE gels and subjected to Western blotting. The levels of PTG protein were analyzed using a rabbit polyclonal antibody raised against the murine PTG sequence. GM was detected using a polyclonal rabbit antibody kindly provided by the laboratory of D. Brautigan (University of Virginia, Charlottesville, Virginia, USA). Glycogen synthase was detected using a monoclonal antibody raised against the muscle isoform of glycogen synthase (Chemicon International Inc., Temecula, California, USA), and PP1 was detected using a monoclonal antibody against total PP1 (Santa Cruz Biotechnology Inc., Santa Cruz, California, USA). A rabbit polyclonal antibody raised against the basal transcription apparatus factor TFIIEα (Santa Cruz Biotechnology Inc.) was used as a loading control. Studies of muscle and liver insulin signaling used antibodies for total and phosphospecific Akt (Cell Signaling Technology Inc., Beverly, Massachusetts, USA). Quadriceps muscle and liver homogenates (4 mg total protein) were immunoprecipitated with 4 μg anti–IRS-1 or IRS-2 antibody (Upstate Biotechnology Inc., Lake Placid, New York, USA) overnight and immunoblotted for anti-phosphotyrosine (G410; Upstate Biotechnology Inc.) and total IRS-1 or IRS-2 (Santa Cruz Biotechnology Inc.).
Detection of GL expression levels by RT-PCR.
Total RNA was isolated from liver tissue of 1- to 2-month-old PTG heterozygous or wild-type mice by extraction with Trizol reagent (Invitrogen Corp., Carlsbad, California, USA) according to the manufacturer’s instructions. Total RNA (5 μg) was then used for RT-PCR using the cDNA Cycle kit from Invitrogen Corp. The primers used for cDNA synthesis and PCR amplification were: GL, 5′-CAAACTGAACAAGCCACTGAG-3′ and 5′-TCTGCTGTCGTCAGACTCAC-3′; PTG, 5′-AGGAAGCCAAATCGCAGAGT-3′ and 5′-AAGTTTTAAGCTGGAGGAGATA-3′; and α-tubulin, 5′-GCGTGAGTGTATCTCCATCCA-3′ and 5′-GGTAGGTGCCAGTGCGAACTT-3′. PCR fragments were resolved upon 3% Tris-acetate agarose gels containing 5 μg/ml ethidium bromide.
Analysis of tissue glycogen levels.
Nonfasting 1- to 2-month-old male or fasting 18-month-old male mice were sacrificed between 8 am and 10 am and tissues were frozen in liquid nitrogen. Frozen tissue samples (50–150 mg) were digested in a suitable volume of 30% KOH for 10 minutes at 100°C. Digestion was completed by the addition of one-fifth volume of 20% NaSO4. Macromolecules were precipitated by the addition of two volumes of absolute ethanol and overnight incubation at –20°C. Macromolecules were washed with 70% ethanol and dried, and then glycogen was hydrolyzed by digestion in 500 μl of 4 N H2SO4 for 10 minutes at 100°C. Samples were neutralized with the addition of an equivalent volume of 4 N NaOH and then deproteinized with the addition of equal volumes of BaOH and ZnSO4. An appropriate volume of supernatant was used in a glucose assay available from Sigma-Aldrich (St. Louis, Missouri, USA).
Assay for glycogen synthase activity.
Tissue samples were isolated from 1- to 2-month-old male animals in the nonfasting state between 8 am and 10 am and then frozen for later use or directly homogenized in glycogen synthase buffer containing 50 mM HEPES (pH 7.8), 100 mM NaF, 10 mM EDTA, and 1% Triton X-100. Glycogen synthase assays were performed as described previously (11). For insulin treatments, animals were lightly anesthetized with isoflurane and then injected via tail vein with 2 mU/g body weight of human recombinant insulin (Novolin R; Novo Nordisk A/S, Princeton, New Jersey, USA). Five minutes later the animals were euthanized and then muscles were excised and frozen immediately in liquid nitrogen for later analysis.
Intraperitoneal glucagon tolerance tests.
Male 18-month-old animals in the nonfasting state were injected with 50 ng/g body weight glucagon in PBS vehicle. Whole-blood samples were collected from the tail tip at the indicated timepoints and blood glucose concentration was determined using an Accu-Chek Instant Plus blood glucose monitor (Roche Diagnostics Corp., Indianapolis, Indiana, USA).
Intraperitoneal glucose and insulin tolerance tests.
Male animals of the indicated age were starved for 16 hours. The test was initiated by the intraperitoneal injection of 2 mg/g body weight dextrose in PBS vehicle. Whole-blood samples were collected from the tail tip at the indicated timepoints and blood glucose concentration was determined using an Accu-Chek Instant Plus blood glucose monitor (Roche Diagnostics Corp.). Intraperitoneal insulin tolerance tests were performed on 12-month-old male PTG+/– or wild-type animals. The test was initiated by the intraperitoneal injection of 2 mU/g body weight human recombinant insulin (Novolin R; Novo Nordisk A/S). Blood samples were collected and analyzed at the same timepoints as for the glucose tolerance test.
In vivo tissue glucose transport.
As a tracer, 2-deoxy-D-[U-14C] glucose (308 mCi/mmol; Amersham Pharmacia Biotech, Piscataway, New Jersey, USA) was combined with 0.5 g/ml dextrose and then injected intraperitoneally (2 mg/g body weight, 10 μCi per mouse) into overnight-fasted 3- to 4-month-old male mice. Mixed arterial/venous blood was collected from the tail tip at 0, 15, 30, 60, 90, and 120 minutes. Blood glucose concentration was measured using a Roche Accu-Chek Instant Plus blood glucose monitor. The specific activity of glucose in serum was determined as follows: a plasma sample was deproteinized with 67 volumes of 3.5% ice-cold perchloric acid, centrifuged, and neutralized with 15 volumes of 2.2 M KHCO3. The radioactivity of the supernatant was then measured by liquid scintillation counting. The specific activity of glucose in serum was calculated by dividing the sample radioactivity by the glucose concentration at that timepoint. This data was plotted for all points, and the area under the curve was calculated over the 120 minutes of the glucose tolerance test by integration. Animals were euthanized at the end of the glucose tolerance test by pentobarbital injection; tissues were excised rapidly and frozen immediately in liquid nitrogen. In order to determine tissue accumulation of 2-deoxy-glucose-6-phosphate, tissue was homogenized in 2 ml of distilled water, and a 1.6-ml aliquot was deproteinized with an equal volume of 7% ice-cold perchloric acid. The sample was centrifuged to collect precipitated protein, and 3 ml of the supernatant was collected and neutralized with 750 μl of 2.2 M KHCO3. Total radioactivity was determined from a 1-ml aliquot by liquid scintillation counting, while another 1-ml aliquot was passed through an AG 1-X8 resin anion exchange column (Bio-Rad Laboratories Inc., Hercules, California, USA) in order to remove 2-deoxy-glucose-6-phosphate. The column was eluted with 3 ml of distilled water and the radioactivity of the eluate was measured by liquid scintillation counting. The difference between total radioactivity and eluted radioactivity corresponded to accumulated 2-deoxy-D-[U-14C]-glucose-6-phosphate. Protein pellets were digested for 1 hour at 55°C in 30% KOH and the protein concentration was determined by Bradford assay (Bio-Rad Laboratories Inc.). To calculate tissue glucose uptake, the counts for accumulated 2-deoxy-glucose-6-phosphate were divided by the glucose specific activity in serum over the time course of the tolerance test and by the sample protein content.
Incorporation of 2-deoxy-glucose-6-phosphate into liver glycogen during a glucose tolerance test.
Frozen liver (100–200 mg) was digested in 750 μl of 30% KOH at 100°C for 10 minutes. Upon digestion, protein concentration of an aliquot was determined by Bradford assay (Bio-Rad Laboratories Inc.). The sample was neutralized with 200 μl of 20% NaSO4 and macromolecules were precipitated with 1 ml of absolute ethanol overnight at –20°C. Macromolecules were pelleted by centrifugation and washed twice with 70% ethanol. The pellet was dried and then glycogen was digested by heat and acid with 500 μl of 4 N H2SO4 for 10 minutes at 100°C. The sample was neutralized with an equal volume of 4 N NaOH and radioactivity was determined by liquid scintillation counting. In order to determine 2-deoxy-glucose-6-phosphate incorporation into glycogen, radioactivity of digested samples was divided by the glucose specific activity in serum over the time course of the tolerance test, and by the sample protein content.
Estimation of tissue triglyceride content.
Muscle or liver (50–100 mg) from 18-month-old PTG+/– or wild-type mice was homogenized in an organic extraction solution of chloroform and methanol (2:1) and then nutated at 4°C overnight. A solution of 0.6% NaCl was added to one-half volumes and an emulsification was formed by vortexing. Samples were then spun at 800 g for 20 minutes at 4°C. The organic layer was extracted and evaporated to dryness under a stream of argon. The dried samples were reconstituted in PBS containing 1% Triton X-100, and this preparation was then used in a triglyceride assay available from Sigma-Aldrich.
Analysis of serum constituents.
Sera were collected either after a 16-hour fast or in the nonfasting state between 8 am and 10 am. Serum insulin levels were analyzed using an ELISA for rat insulin (Ultra Sensitive Rat Insulin ELISA; Crystal Chem Inc., Chicago, Illinois, USA) and using mouse insulin standards (Crystal Chem Inc.). Blood glucose measurements were made using a Roche Accu-Chek Instant Plus blood glucose monitor. Fasting or nonfasting serum triglycerides, nonesterified FFAs, and lactate were determined using kits available from Sigma-Aldrich. Fasting serum leptin levels were determined using a mouse leptin ELISA kit (Crystal Chem Inc.). Fasting serum adiponectin levels were determined with a radioimmunoassay for mouse adiponectin (Linco Research Inc., St. Charles, Missouri, USA).
Statistical analysis.
Data were analyzed for statistical significance using the statistical package in Microsoft Excel. Differences between groups were considered to be statistically significant if values of P ≤ 0.05 were calculated from unpaired two-tailed Student t tests.
Results
Generation of PTG knockout mice.
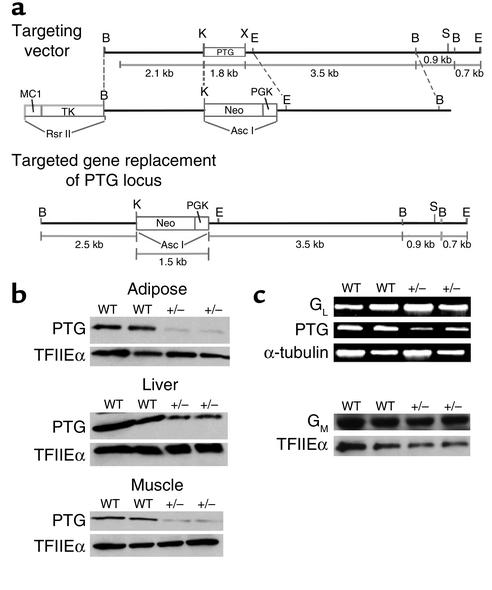
In order to investigate the physiological role of PTG in glycogen metabolism and glucose homeostasis, we generated mice possessing a heterozygous deletion of the PTG gene. Because the PTG gene is intronless, the entire coding sequence was targeted for deletion (Figure 1a). Two independent lines of chimeric male animals were crossed to C57BL/6J female mice to produce heterozygous founder animals; these were backcrossed to the inbred C57BL/6J strain for five generations. Homozygous deletion of the PTG gene was embryonic lethal, as the genotyping of more than 100 pups derived from heterozygous breeding pairs failed to produce viable homozygous animals. PTG heterozygous animals displayed decreased PTG protein levels in all tissues analyzed (Figure 1b), including liver, adipose, and skeletal muscle. The expression of GM and GL were not altered in the PTG heterozygous mice (Figure 1c).
Figure 1.
Mice possessing a heterozygous deletion of the PTG gene display reduced PTG protein levels while the expression of GL and GM are not altered. (a) The entire 1-kb coding region of the intronless PTG gene was targeted for disruption. PTG heterozygous mice were generated as outlined in Methods and then backcrossed for five generations to inbred C57BL/6J mice. (b) PTG protein levels are reduced in insulin-responsive tissues of PTG+/– mice. Tissue homogenates were prepared from nonfasted 1- to 2-month-old male animals and analyzed by Western blotting. Equivalent loading was insured by analysis of the levels of the basal transcription factor TFIIEα. (c) The expression levels of the tissue-specific glycogen-targeting subunits GM and GL are unchanged in PTG heterozygous mice. The expression level of GL at the mRNA level was analyzed by RT-PCR using liver total RNA isolated from nonfasting 1- to 2-month-old male animals. The expression of GM was analyzed by Western blotting and equivalent loading was insured by analysis of the levels of TFIIEα.
Glycogen accumulation is attenuated in PTG+/– mice.
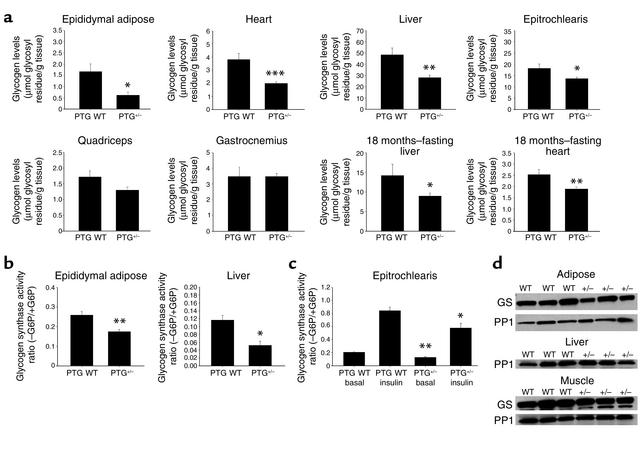
The levels of glycogen in the nonfasting state were reduced in all tissues analyzed from 1- to 2-month-old PTG heterozygous mice (PTG+/– mice) (Figure 2a). Epididymal adipose tissue displayed a significant decrease in nonfasting glycogen levels, with a 54% reduction in comparison with age-matched wild-type animals. The levels of heart and liver glycogen were also greatly reduced, with PTG+/– mice displaying approximately 48% less heart glycogen and 42% less liver glycogen than their age-matched wild-type counterparts. The smallest effects on nonfasting basal glycogen levels were seen in skeletal muscle, with forelimb white fiber epitrochlearis muscle decreased 26% in PTG+/– mice relative to wild-type animals. Hindlimb white fiber quadriceps glycogen content was decreased by 24% in PTG+/– mice, although this change did not meet statistical significance. Unlike white fiber muscle types, hindlimb mixed fiber gastrocnemius muscle displayed no differences in nonfasting glycogen content between PTG+/– and wild-type animals. Potential alterations in steady-state glycogen content in the fasting state were also assessed in 18-month-old male animals. The levels of hepatic and heart glycogen in 18-month-old PTG+/– animals were reduced by approximately 25% in the fasting state compared with controls with correspondingly lower set points.
Figure 2.
Reduction of PTG protein levels leads to reduced glycogen stores due to decreased basal and insulin-stimulated glycogen synthesis. (a) PTG+/– mice display reduced glycogen stores. Glycogen levels were analyzed from tissues isolated from nonfasted 1- to 2-month-old male animals (n = 6 per group: adipose and heart; n = 7–8 per group: liver, epitrochlearis, and quadriceps; n = 3–6 per group: gastrocnemius) or from fasted 18-month-old male animals (n = 4–10 per group, liver; n = 4–12 per group, heart). Results are reported as mean ± SEM. *P ≤ 0.05; **P ≤ 0.01; ***P ≤ 0.005. (b) Glycogen synthase activity ratio is decreased in insulin-responsive tissues of PTG+/– mice. Glycogen synthase activity was assayed in tissue homogenates prepared from 1- to 2-month-old male animals in the nonfasting state (n = 9 per group, adipose; n = 7–8 per group, liver). Results are reported as mean ± SEM (*P ≤ 0.002; **P ≤ 0.001). G6P, glucose-6-phosphate. (c) Basal and insulin-stimulated glycogen synthase activity ratio is decreased in skeletal muscle of PTG+/– mice. Glycogen synthase activity was assayed in homogenates of forelimb epitrochlearis muscle in the basal state and after stimulation with 2 mU/g body weight human recombinant insulin. Animals were 1- to 2-month-old males in the nonfasting state (n = 4–7 per group). Results are reported as mean ± SEM (*P ≤ 0.05; **P ≤ 0.002). (d) The levels of total cellular glycogen synthase (GS) and PP1 protein are unchanged in adipose, liver, and epitrochlearis muscle of PTG+/– mice. Total cellular levels of glycogen synthase or PP1 protein were analyzed by Western blotting of tissue homogenates prepared from 1- to 2-month-old male animals in the nonfasting state. It should be noted that the anti–skeletal muscle glycogen synthase antibody used cannot detect the liver isoform of glycogen synthase.
We also assayed for changes in glycogen synthase activity in the tissues of 1- to 2-month old PTG+/– mice (Figure 2b). The glycogen synthase activity ratio in epididymal adipose tissue was reduced from 0.27 in wild-type animals to 0.17 in PTG+/– mice, although the total amount of glycogen synthase activity was unchanged (data not shown). Consistent with these results, the hepatic glycogen synthase activity ratio was also reduced, whereas the total activity was not altered. The apparent larger decrease in glycogen synthase activity ratio in liver may be due to a decrease in the ratio of PTG to GL. The high affinity of GL for phosphorylase a can result in the allosteric inhibition of glycogen synthase phosphatase activity by phosphorylase (17).
Disruption of the PTG gene reduces insulin-stimulated glycogen synthesis.
In order to assess the effect of disruption of the PTG gene on the stimulation of glycogen synthase by insulin, we injected 1- to 2-month-old nonfasted animals via the tail vein with insulin, excised muscles 5 minutes later, and performed glycogen synthase assays. Insulin produced a fourfold increase in glycogen synthase activity in epitrochlearis muscle from wild-type mice. Although the absolute activity ratio in response to insulin was decreased in PTG heterozygous mice relative to wild-type animals, the fold response was nearly identical (Figure 2c). The levels of total cellular glycogen synthase and PP1 protein were not altered in adipose, liver, or epitrochlearis muscle (Figure 2d).
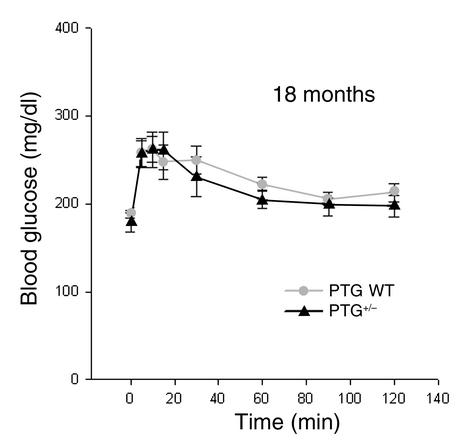
Although PTG has been shown to bind glycogen phosphorylase in vitro, the glycogen phosphorylase activity ratio and total activity was not impaired in any of the tissues analyzed from PTG+/– mice in the nonfasting state (data not shown). Furthermore, the phosphorylation state of glycogen phosphorylase in the basal nonfasting state, as assessed by Western blotting with a glycogen phosphorylase a–specific antibody, was not different between wild-type and PTG heterozygous mice. In addition, in 18-month-old PTG heterozygous animals, glucagon-stimulated hepatic glucose production during an intraperitoneal glucagon tolerance test was not significantly different from that in age-matched wild-type mice (Figure 3).
Figure 3.
Hepatic glucose release in response to glucagon is not altered in PTG+/– mice. Male animals at 18 months of age in the nonfasting state were used for glucagon tolerance tests (n = 4–6 per group). Results are reported as mean ± SEM.
Disruption of the PTG gene produces progressive, age-dependent glucose intolerance.
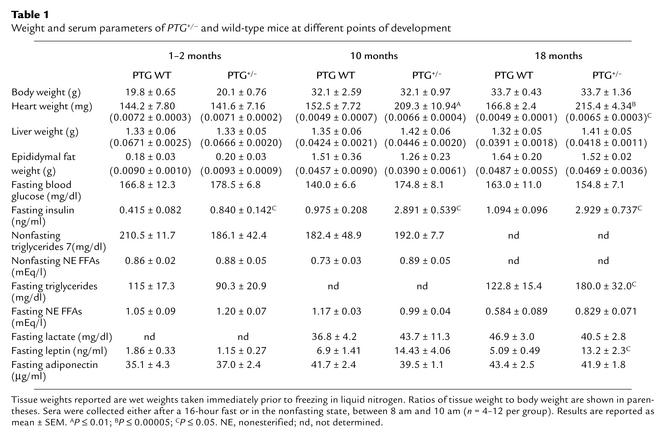
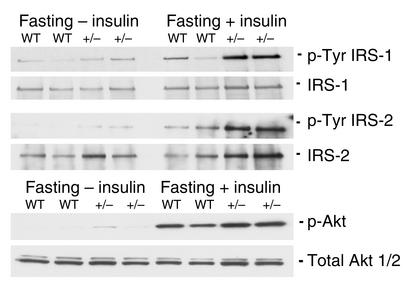
The reduction in glycogenic capacity of the PTG+/– mice prompted us to evaluate possible changes in glucose homeostasis (Table 1). The body weights of PTG+/– mice were comparable to those of wild-type animals throughout development, as were liver and epididymal fat pad weights. However, in aged PTG+/– mice, a significant 25% increase in heart weight and heart/body weight ratio was observed. Interestingly, cardiac hypertrophy has been observed in numerous animal models of insulin resistance and diabetic cardiomyopathy (18–20). Also of note, the levels of fasting serum leptin were elevated in older PTG+/– mice, suggestive of potential leptin resistance. Fasting blood glucose of PTG+/– mice was normal throughout development, suggesting that hepatic glucose production was not affected by the moderate reduction in liver glycogen stores. In order to test this hypothesis, 3-month-old fasting male animals were injected with insulin through the inferior vena cava and livers were collected for analysis. The effects of insulin administration on the phosphorylation of hepatic intermediate signaling proteins were assessed by Western blotting. The degree of Akt, IRS-1, and IRS-2 phosphorylation observed after insulin stimulation was not decreased in PTG+/– mice compared with age-matched controls. In fact, tyrosine phosphorylation of liver IRS-1 appeared to be enhanced (Figure 4). Although fasting blood glucose levels were unaltered in the PTG+/– mice at 1–2 months of age, fasting serum insulin levels were elevated by approximately twofold; by 10 months of age, these levels were increased by approximately threefold. Nonfasting serum triglycerides and nonesterified FFAs were unchanged in PTG+/– mice relative to wild-type mice at all ages analyzed; however, the serum levels of fasting triglycerides were elevated by approximately 32% at 18 months of age.
Table 1.
Weight and serum parameters of PTG+/– and wild-type mice at different points of development
Figure 4.
Liver insulin signaling is not impaired in PTG+/– mice. Protein lysates were prepared from liver of 3- to 4-month-old fasting male animals either in the basal state after intravenous injection with PBS or after intravenous injection with 2 mU/g body weight human recombinant insulin. Western blotting was performed for total and phosphospecific Akt. Liver homogenates were immunoprecipitated with an antibody against IRS-1 or IRS-2 and immunoblotting was performed to determine the levels of total IRS-1 and IRS-2 brought down in the immunoprecipitation and for levels of tyrosine-phosphorylated IRS-1 or IRS-2.
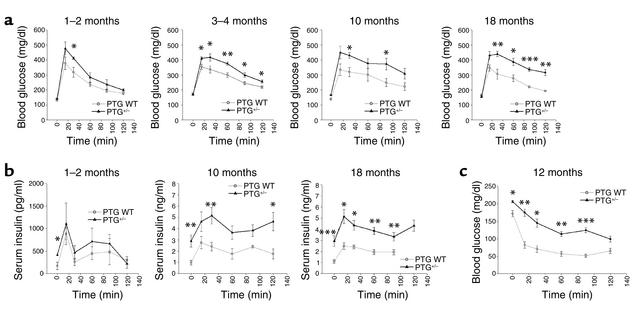
Progressive elevations in fasting insulin levels suggested that the heterozygous knockout mice might exhibit alterations in glucose homeostasis. Intraperitoneal glucose tolerance tests were performed on overnight-fasted animals (Figure 5a). Although 1- to 2-month-old PTG+/– mice showed no significant impairment in glucose tolerance in comparison with age-matched wild-type animals, progressive glucose intolerance developed with aging. Glucose intolerance was evident at 3 months and increased through 18 months of age. Evaluation of the levels of serum insulin throughout the timepoints of the glucose tolerance test revealed that insulin secretion was similar between wild-type and PTG+/– mice at 1–2 months of age (Figure 5b). However, the fasting basal levels of serum insulin were elevated twofold in the PTG+/– mice and increased with aging. Moreover, the area under the curve of serum insulin concentrations during the glucose tolerance test also increased progressively with age, suggesting compensatory hypersecretion due to peripheral insulin resistance (21, 22), without any loss of β cell function. To explore this possibility in more detail, we performed intraperitoneal insulin tolerance tests on nonfasted 12-month-old heterozygous knockout and control mice (Figure 5c). Insulin tolerance tests revealed insulin resistance in aged PTG+/– mice compared with control littermates, with significant impairment of the ability of exogenously delivered insulin to lower blood glucose levels.
Figure 5.
PTG+/– mice display glucose intolerance, moderate hyperinsulinemia, and insulin resistance with aging. (a) Fasting PTG+/– mice display the development of glucose intolerance with aging. Male animals fasted for 16 hours overnight were used for glucose tolerance experiments (n = 4–12 per group). Results are reported as mean ± SEM. (*P ≤ 0.05; **P ≤ 0.005; ***P ≤ 0.0002). Age of animals is shown at upper right of each graph. (b) Serum insulin levels of PTG+/– mice are elevated in the fasting state and in response to a glucose bolus during the intraperitoneal glucose tolerance test. Insulin levels were measured from additional sera collected at the time of the intraperitoneal glucose tolerance tests (n = 4–12 group). Results are reported as mean ± SEM (*P ≤ 0.05; **P ≤ 0.02; ***P ≤ 0.005). (c) Nonfasting PTG+/– mice display moderate insulin resistance at 12 months of age. Male animals in the nonfasting state were used for insulin tolerance experiments (n = 4–12 per group). Results are reported as mean ± SEM (*P ≤ 0.002; **P ≤ 0.001; ***P ≤ 0.0005).
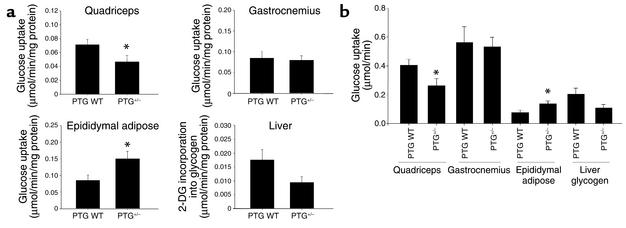
In order to better assess the mechanisms responsible for the observed glucose intolerance in PTG+/– mice, we performed in vivo glucose uptake measurements during an intraperitoneal glucose tolerance test (Figure 6a). Glucose uptake by white fiber quadriceps muscle was reduced by 35% in 3- to 4-month-old PTG+/– mice relative to controls. However, the uptake of glucose into mixed fiber gastrocnemius muscle was unaltered. Glucose incorporation into liver glycogen during the intraperitoneal glucose tolerance test was also reduced by 46%, although this observation did not meet the threshold of statistical significance (P = 0.057). Interestingly, a 180% increase in glucose transport into the epididymal adipose depot of PTG+/– mice relative to age-matched controls was observed. This effect may occur as a compensatory mechanism to offset the effects of decreased glucose transport into white fiber muscle and liver. Increases in adipose tissue glucose uptake during states of hyperinsulinemia coinciding with selective skeletal muscle insulin resistance have been reported in a number of different animal models (23–25). However, upon consideration of glucose uptake rates after correction for differences in relative total tissue protein mass, the increased glucose uptake into PTG+/– epididymal adipose likely cannot fully compensate for the relative decreases in quadriceps glucose uptake and glucose incorporation into liver glycogen (Figure 6b). It is also conceivable that the increased glucose uptake into adipose tissue of the PTG+/– mice is merely a reflection of the significant increase in insulin levels over wild-type animals during the intraperitoneal glucose tolerance test.
Figure 6.
PTG+/– mice have decreased glucose transport into white fiber muscle and decreased liver glycogen synthesis with a compensatory increase in epididymal adipose glucose transport during an intraperitoneal glucose tolerance test. (a) Male animals 3–4 months of age were fasted overnight for 16 hours and used for in vivo glucose uptake experiments (n = 8 wild-type and 9 PTG+/– animals). Results are reported as mean ± SEM (*P ≤ 0.05). 2-DG, 2-deoxyglucose. (b) The increase in epididymal adipose glucose transport in PTG+/– mice cannot fully compensate for the decreases in quadriceps glucose transport and liver glycogen synthesis. Results from part a are corrected for the average protein mass of each tissue to give relative values of glucose uptake during the intraperitoneal glucose tolerance test. Results are reported as mean ± SEM (*P ≤ 0.05).
Insulin resistance in PTG+/– mice results from fuel repartitioning into lipid.
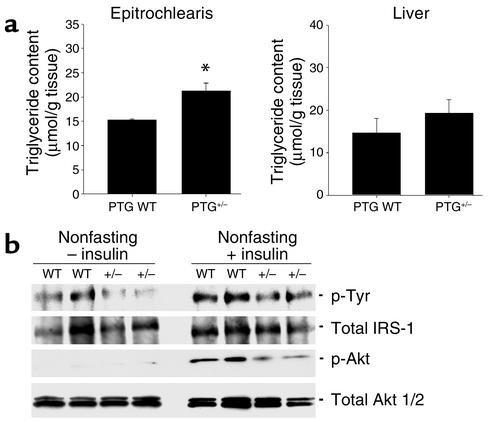
The accumulation of intramyocellular lipid has been implicated as a cause of peripheral insulin resistance (26). We thus hypothesized that inappropriate storage of glycogen might lead to a repartitioning of fuel substrates as lipid. The levels of lipid in the muscle of aged PTG+/– mice were measured by estimating triglyceride content in organic solvent–extracted muscle. The levels of triglyceride in the forelimb epitrochlearis muscle derived from 18-month-old PTG heterozygous mice were approximately 30% higher than those observed in age-matched wild-type animals (Figure 7a).
Figure 7.
Skeletal muscle of 18-month-old PTG+/– mice displays increased triglyceride content and inhibition of insulin signaling pathways involved in glucose transport and glycogen synthesis. (a) Skeletal muscle triglyceride content is increased in 18-month-old PTG+/– mice. Skeletal muscle triglyceride content was estimated from organic solvent–extracted epitrochlearis muscle isolated from fasting 18-month-old animals (n = 4–12 per group). Results are reported as mean ± SEM (*P ≤ 0.05). (b) Insulin signaling is affected in the skeletal muscle of aged PTG+/– mice. Protein lysates were prepared from muscle of 9- to 10-month-old nonfasting male animals either in the basal state or after injection with 2 mU/g body weight human recombinant insulin. Western blotting was performed for total and phosphospecific Akt. Muscle homogenates were immunoprecipitated with an antibody against IRS-1 and immunoblotting was performed to determine the levels of total IRS-1 and tyrosine-phosphorylated IRS-1.
It has been proposed that the accumulation of intracellular long-chain FFAs may activate protein kinases that catalyze the serine phosphorylation of insulin receptor substrates, thereby attenuating tyrosine phosphorylation and the insulin signal (27). Protein lysates were prepared from muscle of insulin-injected nonfasting animals, and the phosphorylation states of insulin signaling intermediates were analyzed by immunoprecipitation and Western blotting. The levels of phospho-Akt were reduced in muscle of PTG+/– mice in response to insulin relative to control animals (Figure 7b), although the levels of total Akt were unchanged. Insulin-stimulated muscle IRS-1 tyrosine phosphorylation was also reduced in PTG+/– mice, with no alteration observed in IRS-1 expression. These data suggest that the increases in PTG+/– muscle triglyceride content correlate with attenuation of insulin signaling pathways involved in the regulation of glucose transport.
Discussion
The stimulation of glycogen synthesis by insulin involves the compartmentalized activation of PP1 due to glycogen targeting subunits that act as molecular scaffolds, bringing together the enzyme with its substrates in a macromolecular complex. The heterozygous deletion of the PTG gene indicates that this protein plays a vital role in glycogen metabolism. The steady-state glycogen levels, as well as glycogen synthase activity ratios in PTG+/– animals, were reduced by approximately 40–50% relative to wild-type counterparts in fat, liver, and heart. The levels of white fiber muscle glycogen were also significantly reduced, as was the activation of glycogen synthase by insulin. Moreover, PTG+/– mice become progressively insensitive to insulin with age. In contrast, mice possessing a homozygous deletion of the GM gene display no obvious alterations in whole-body glucose homeostasis or insulin sensitivity despite a significant depletion of muscle glycogen (12). This suggests that the development of progressive glucose intolerance in the PTG+/– mice may result from a reduction of glycogen in multiple tissues. Interestingly, the overexpression of PTG in rat primary hepatocytes, rat liver, or cultured human muscle cells by adenoviral infection produces dramatic increases in steady-state glycogen accumulation and the glycogen synthase activity ratio (14–16). Moreover, cells overexpressing PTG did not respond to glycogenolytic stimuli, and thus locked into a glycogenic mode. Taken together, these data demonstrate that PTG plays a crucial role in regulating glycogen synthesis in vivo.
The development of insulin resistance with aging in the PTG+/– mice suggests that the attenuation of glycogen synthesis may produce a progressive repartitioning of energy into lipid in muscle. The accumulation of intramyocellular lipid has been implicated as a causal factor in the development of insulin resistance in both rodents and humans (28–31). Indeed, both mouse models (32) and humans (33) with lipodystrophy undergo lipid accumulation in muscle that can be reversed by treatment with hormones such as leptin that increase lipid oxidation. In this regard, the levels of serum leptin are elevated in aged PTG+/– mice, perhaps suggesting peripheral leptin resistance, although this hyperleptinemia occurs without increases in body weight or epididymal fat pad mass. Although hyperleptinemia and leptin resistance usually correlate with obesity, it can occur independently of increased fat mass during aging (34, 35). The increases in muscle triglyceride content, fasting serum triglycerides, and fasting FFAs observed in PTG+/– mice correlate well with the insulin resistance, as seen in other mouse models (29, 36–40). Although the mechanisms by which increases in intramyocellular lipid contribute to insulin resistance remain unknown, correlations have been observed between these states and decreased tyrosine phosphorylation of insulin receptor substrates (26, 27, 41–43). In this regard, the tyrosine phosphorylation of IRS-1 and the downstream activation of Akt were decreased in muscle of aged PTG+/– mice. These observations provide a mechanistic link between decreased whole-body glycogen stores and an attenuation of insulin signaling, leading to the development of insulin resistance with aging.
The hyperleptinemia in aged PTG+/– mice may also contribute to the observed increase in heart mass. Leptin is also known to affect sympathetic nerve activity and arterial pressure (44–46). It has been demonstrated that the sympathetic actions of leptin can be maintained or even elevated during the compensatory hyperleptinemia of leptin resistance (47, 48). This selective leptin resistance may allow for the development of hypertension and cardiac hypertrophy during hyperleptinemia, while the metabolic effects of leptin are impaired.
Alterations in lipid metabolism during states of glycogen depletion have been observed in several clinical models. Severe liver glycogen depletion brought about by rare mutations in the glycogen synthase gene can result in elevations in fasting ketone bodies and FFAs, a condition known as glycogen storage disease type 0 (49–52). Additionally, post-marathon runners, who exhibit moderately decreased muscle glycogen stores, become transiently insulin resistant and display decreased whole-body glucose uptake. This is likely due to an adaptive response in fuel homeostasis in which lipid oxidation is increased under conditions of the euglycemic-hyperinsulinemic clamp (53).
Studies in cases of early-onset insulin resistance revealed that the first detectable abnormality in insulin action lies in the storage of glucose as glycogen (54–56). Although it is likely that these observations were reflective of decreased glucose uptake in insulin-resistant subjects, glycogen synthesis is typically diminished in patients with type 2 diabetes and may represent a critical event in the pathophysiology of the disease. The PTG+/– mouse represents an interesting variation and a new model of this syndrome, in which the attenuation of glycogen synthesis per se does not directly produce insulin resistance, but rather generates a gradual attenuation of insulin signaling, probably through the redirection of fuel substrates into lipid. Moreover, the data presented here demonstrate that scaffolding proteins play a key permissive role in insulin action in a physiological setting. Future studies will focus on the molecular mechanisms underlying the dephosphorylation of glycogen synthase in response to insulin and on the role of PTG in this important metabolic event.
Acknowledgments
We thank Matthew J. Brady, Polly Hansen, Jon Winnay, and Ken Coker for technical advice and helpful discussions. We also thank Yoko Okamoto, Mei Zhang, Daniel Romain, Amanda Kalen, Emily Lampe, and Janet Hwang for excellent technical assistance. Sean M. Crosson is the recipient of Canadian Institutes of Health Research postdoctoral fellowship MFE-47644. This work has been funded by NIH grant DK-60597 to Alan R. Saltiel.
Footnotes
See the related Commentary beginning on page 1282.
John Printen’s present address is: EST-BIO UK, AstraZeneca Pharmaceuticals, Macclesfield, Cheshire, England, United Kingdom.
Jeffrey E. Pessin’s present address is: Department of Pharmacological Sciences, State University of New York—Stony Brook, Stony Brook, New York, USA.
Conflict of interest: The authors have declared that no conflict of interest exists.
Nonstandard abbreviations used: protein phosphatase 1α (PP1α); protein targeting to glycogen (PTG).
References
- 1.Lawrence JC, Roach PJ. New insights into the role and mechanism of glycogen synthase activation by insulin. Diabetes. 1997;46:541–547. doi: 10.2337/diab.46.4.541. [DOI] [PubMed] [Google Scholar]
- 2.Shulman RG, Rothman DL. Enzymatic phosphorylation of muscle glycogen synthase: a mechanism for maintenance of metabolic homeostasis. Proc. Natl. Acad. Sci. U. S. A. 1996;93:7491–7495. doi: 10.1073/pnas.93.15.7491. [DOI] [PMC free article] [PubMed] [Google Scholar]
- 3.Ingebritsen TS, Foulkes JG, Cohen P. The protein phosphatases involved in cellular regulation. 2. Glycogen metabolism. Eur. J. Biochem. 1983;132:263–274. doi: 10.1111/j.1432-1033.1983.tb07358.x. [DOI] [PubMed] [Google Scholar]
- 4.Krebs EG. Phosphorylation and dephosphorylation of glycogen phosphorylase: a prototype for reversible covalent enzyme modification. Curr. Top. Cell. Regul. 1981;18:401–419. doi: 10.1016/b978-0-12-152818-8.50030-x. [DOI] [PubMed] [Google Scholar]
- 5.Dent P, et al. The molecular mechanism by which insulin stimulates glycogen synthesis in mammalian skeletal muscle. Nature. 1990;348:302–308. doi: 10.1038/348302a0. [DOI] [PubMed] [Google Scholar]
- 6.Ueki K, et al. Potential role of protein kinase B in insulin-induced glucose transport, glycogen synthesis, and protein synthesis. J. Biol. Chem. 1998;273:5315–5322. doi: 10.1074/jbc.273.9.5315. [DOI] [PubMed] [Google Scholar]
- 7.Halse R, et al. Control of glycogen synthesis in cultured human muscle cells. J. Biol. Chem. 1999;274:776–780. doi: 10.1074/jbc.274.2.776. [DOI] [PubMed] [Google Scholar]
- 8.Hubbard MJ, Cohen P. The glycogen-binding subunit of protein phosphatase-1G from rabbit skeletal muscle. Further characterisation of its structure and glycogen-binding properties. Eur. J. Biochem. 1989;180:457–465. doi: 10.1111/j.1432-1033.1989.tb14668.x. [DOI] [PubMed] [Google Scholar]
- 9.Moorhead G, MacKintosh C, Morrice N, Cohen P. Purification of the hepatic glycogen-associated form of protein phosphatase-1 by microcystin-Sepharose affinity chromatography. FEBS Lett. 1995;362:101–105. doi: 10.1016/0014-5793(95)00197-h. [DOI] [PubMed] [Google Scholar]
- 10.Armstrong CG, Browne GJ, Cohen P, Cohen PT. P1R6, a novel member of the family of glycogen-targetting subunits of protein phosphatase 1. FEBS Lett. 1997;418:210–214. doi: 10.1016/s0014-5793(97)01385-9. [DOI] [PubMed] [Google Scholar]
- 11.Printen JA, Brady MJ, Saltiel AR. PTG, a protein phosphatase 1-binding protein with a role in glycogen metabolism. Science. 1997;275:1475–1478. doi: 10.1126/science.275.5305.1475. [DOI] [PubMed] [Google Scholar]
- 12.Suzuki Y, et al. Insulin control of glycogen metabolism in knockout mice lacking the muscle-specific protein phosphatase PP1G/RGL. Mol. Biol. Cell. 2001;21:2683–2694. doi: 10.1128/MCB.21.8.2683-2694.2001. [DOI] [PMC free article] [PubMed] [Google Scholar]
- 13.Armstrong CG, Doherty MJ, Cohen PT. Identification of the separate domains in the hepatic glycogen-targeting subunit of protein phosphatase 1 that interact with phosphorylase a, glycogen and protein phosphatase 1. Biochem. J. 1998;336:699–704. doi: 10.1042/bj3360699. [DOI] [PMC free article] [PubMed] [Google Scholar]
- 14.Berman HK, O’Doherty RM, Anderson P, Newgard CB. Overexpression of protein targeting to glycogen (PTG) in rat hepatocytes causes profound activation of glycogen synthesis independent of normal hormone- and substrate-mediated regulatory mechanisms. J. Biol. Chem. 1998;273:26421–26425. doi: 10.1074/jbc.273.41.26421. [DOI] [PubMed] [Google Scholar]
- 15.Lerin C, Montell E, Berman HK, Newgard CB, Gomez-Foix AM. PTG overexpression in cultured human muscle cells stimulates glycogen and glucose 6-P levels. J. Biol. Chem. 2000;275:39991–39995. doi: 10.1074/jbc.M006251200. [DOI] [PubMed] [Google Scholar]
- 16.O’Doherty RM, et al. Activation of direct and indirect pathways of glycogen synthesis by hepatic overexpression of protein targeting to glycogen. J. Clin. Invest. 2000;105:479–488. doi: 10.1172/JCI8673. [DOI] [PMC free article] [PubMed] [Google Scholar]
- 17.Doherty MJ, Moorhead G, Morrice N, Cohen P, Cohen PT. Amino acid sequence and expression of the hepatic glycogen-binding (GL)-subunit of protein phosphatase-1. FEBS Lett. 1995;375:294–298. doi: 10.1016/0014-5793(95)01184-g. [DOI] [PubMed] [Google Scholar]
- 18.Belke DB, et al. Insulin signaling coordinately regulates cardiac size, metabolism, and contractile protein isoform expression. J. Clin. Invest. 2002;109:629–639. doi:10.1172/JCI200213946. doi: 10.1172/JCI13946. [DOI] [PMC free article] [PubMed] [Google Scholar]
- 19.Belke DB, Larsen TS, Gibbs EM, Severson DL. Altered metabolism causes cardiac dysfunction in perfused hearts from diabetic (db/db) mice. Am. J. Physiol. Endocrinol. Metab. 2000;279:E1104–E1113. doi: 10.1152/ajpendo.2000.279.5.E1104. [DOI] [PubMed] [Google Scholar]
- 20.Abel ED, et al. Cardiac hypertrophy with preserved contractile function after selective deletion of GLUT4 from the heart. J. Clin. Invest. 1999;104:1703–1714. doi: 10.1172/JCI7605. [DOI] [PMC free article] [PubMed] [Google Scholar]
- 21.Zhou YP, Cockburn BN, Pugh W, Polonsky KS. Basal insulin hypersecretion in insulin-resistant Zucker diabetic and Zucker fatty rats: role of enhanced fuel metabolism. Metabolism. 1999;48:857–864. doi: 10.1016/s0026-0495(99)90219-6. [DOI] [PubMed] [Google Scholar]
- 22.Polonsky KS, et al. Quantitative study of insulin secretion and clearance in normal and obese subjects. J. Clin. Invest. 1999;81:435–441. doi: 10.1172/JCI113338. [DOI] [PMC free article] [PubMed] [Google Scholar]
- 23.Cusin I, Terrettaz J, Rohner-Jeanrenaud F, Jeanrenaud B. Metabolic consequences of hyperinsulinemia imposed on normal rats on glucose handling by white adipose tissue, muscles and liver. Biochem. J. 1990;267:99–103. doi: 10.1042/bj2670099. [DOI] [PMC free article] [PubMed] [Google Scholar]
- 24.Cusin I, et al. Hyperinsulinemia increases the amount of GLUT4 mRNA in white adipose tissue and decreases that of muscles: a clue for increased fat depot and insulin resistance. Endocrinology. 1990;127:3246–3248. doi: 10.1210/endo-127-6-3246. [DOI] [PubMed] [Google Scholar]
- 25.Kim JK, et al. Redistribution of substrates to adipose tissue promotes obesity in mice with selective insulin resistance in muscle. J. Clin. Invest. 2000;105:1791–1797. doi: 10.1172/JCI8305. [DOI] [PMC free article] [PubMed] [Google Scholar]
- 26.Dresner A, et al. Effects of free fatty acids on glucose transport and IRS-1–associated phosphatidylinositol 3-kinase activity. J. Clin. Invest. 1999;103:253–259. doi: 10.1172/JCI5001. [DOI] [PMC free article] [PubMed] [Google Scholar]
- 27.Griffin ME, et al. Free fatty acid-induced insulin resistance is associated with activation of protein kinase C theta and alterations in the insulin signaling cascade. Diabetes. 1999;48:1270–1274. doi: 10.2337/diabetes.48.6.1270. [DOI] [PubMed] [Google Scholar]
- 28.Kim J, Gavrilova O, Chen Y, Reitman M, Shulman GI. Mechanisms of insulin resistance in fatless mice. J. Biol. Chem. 2000;275:8456–8460. doi: 10.1074/jbc.275.12.8456. [DOI] [PubMed] [Google Scholar]
- 29.Kim JK, et al. Tissue-specific overexpression of lipoprotein lipase causes tissue-specific insulin resistance. Proc. Natl. Acad. Sci. U. S. A. 2001;98:7522–7527. doi: 10.1073/pnas.121164498. [DOI] [PMC free article] [PubMed] [Google Scholar]
- 30.Pan D, et al. Skeletal muscle triglyceride levels are inversely related to insulin action. Diabetes. 1997;46:983–988. doi: 10.2337/diab.46.6.983. [DOI] [PubMed] [Google Scholar]
- 31.Perseghin G, et al. Intramyocellular triglyceride content is a determinant of in vivo insulin resistance in humans: a 1H-13C nuclear magnetic resonance spectroscopy assessment in offspring of type 2 diabetic parents. Diabetes. 1999;48:1600–1606. doi: 10.2337/diabetes.48.8.1600. [DOI] [PubMed] [Google Scholar]
- 32.Yamauchi T, et al. The fat-derived hormone adiponectin reverses insulin resistance associated with both lipoatrophy and obesity. Nat. Med. 2001;7:941–946. doi: 10.1038/90984. [DOI] [PubMed] [Google Scholar]
- 33.Peterson KF, et al. Leptin reverses insulin resistance and hepatic steatosis in patients with severe lipodystrophy. J. Clin. Invest. 2002;109:1345–1350. doi:10.1172/JCI200215001. doi: 10.1172/JCI15001. [DOI] [PMC free article] [PubMed] [Google Scholar]
- 34.Li H, Matheny M, Nicolson M, Turner N, Scarpace PJ. Leptin gene expression increases with age independent of increasing adiposity in rats. Diabetes. 1997;46:2035–2039. doi: 10.2337/diab.46.12.2035. [DOI] [PubMed] [Google Scholar]
- 35.Gabriely I, Ma X, Yang X, Rossetti L, Barzilai N. Leptin resistance during aging is independent of fat mass. Diabetes. 2002;51:1016–1021. doi: 10.2337/diabetes.51.4.1016. [DOI] [PubMed] [Google Scholar]
- 36.Moitra J, et al. Life without white fat: a transgenic mouse. Genes Dev. 1998;12:3168–3181. doi: 10.1101/gad.12.20.3168. [DOI] [PMC free article] [PubMed] [Google Scholar]
- 37.Shimomura I, et al. Insulin resistance and diabetes mellitus in transgenic mice expressing nuclear SREBP-1c in adipose tissue: model for congenital generalized lipodystrophy. Genes Dev. 1998;12:3182–3194. doi: 10.1101/gad.12.20.3182. [DOI] [PMC free article] [PubMed] [Google Scholar]
- 38.Bruning JC, et al. A muscle-specific insulin receptor knockout exhibits features of the metabolic syndrome of NIDDM without altering glucose tolerance. Mol. Cell. 1998;2:559–569. doi: 10.1016/s1097-2765(00)80155-0. [DOI] [PubMed] [Google Scholar]
- 39.Hasty AH, et al. Severe hypercholesterolemia, hypertriglyceridemia, and atherosclerosis in mice lacking both leptin and the low density lipoprotein receptor. J. Biol. Chem. 2001;276:37402–37408. doi: 10.1074/jbc.M010176200. [DOI] [PubMed] [Google Scholar]
- 40.Langner CA, et al. The fatty liver dystrophy (fld) mutation. A new mutant mouse with a developmental abnormality in triglyceride metabolism and associated tissue-specific defects in lipoprotein lipase and hepatic lipase activities. J. Biol. Chem. 1989;264:7994–8003. [PubMed] [Google Scholar]
- 41.Bjornholm M, Kawano Y, Lehtihet M, Zierath JR. Insulin receptor substrate 1 phosphorylation and phosphatidylinositol 3-kinase activity in skeletal muscle from NIDDM subjects after in vivo insulin stimulation. Diabetes. 1997;46:524–527. doi: 10.2337/diab.46.3.524. [DOI] [PubMed] [Google Scholar]
- 42.Goodyear LJ, et al. Insulin receptor phosphorylation and phosphatidylinositol 3-kinase activity are decreased in intact muscle strips from obese subjects. J. Clin. Invest. 1995;95:2195–2204. doi: 10.1172/JCI117909. [DOI] [PMC free article] [PubMed] [Google Scholar]
- 43.Anai M, et al. Altered expression levels and impaired steps in the pathway to phosphatidylinositol 3-kinase activation via insulin receptor substrates 1 and 2 in Zucker fatty rats. Diabetes. 1998;47:13–23. doi: 10.2337/diab.47.1.13. [DOI] [PubMed] [Google Scholar]
- 44.Shek EW, Bronds MW, Hall JE. Chronic leptin infusion increases arterial pressure. Hypertension. 1998;31:409–414. doi: 10.1161/01.hyp.31.1.409. [DOI] [PubMed] [Google Scholar]
- 45.Aizawa-Abe M, et al. Pathophysiological role of leptin in obesity-related hypertension. J. Clin. Invest. 2000;105:1243–1252. doi: 10.1172/JCI8341. [DOI] [PMC free article] [PubMed] [Google Scholar]
- 46.Lembo G, et al. Leptin induces direct vasodilation through distinct endothelial mechanisms. Diabetes. 2000;49:293–297. doi: 10.2337/diabetes.49.2.293. [DOI] [PubMed] [Google Scholar]
- 47.Mark AL, Correia MLG, Rahmouni K, Haynes WA. Selective insulin resistance: a new concept in leptin physiology with cardiovascular implications. J. Hypertens. 2002;20:1245–1250. doi: 10.1097/00004872-200207000-00001. [DOI] [PubMed] [Google Scholar]
- 48.Correia MLG, et al. The concept of selective leptin resistance. Evidence from agouti yellow obese mice. Diabetes. 2002;51:439–442. doi: 10.2337/diabetes.51.2.439. [DOI] [PubMed] [Google Scholar]
- 49.Gitzelmann R, et al. Liver glycogen synthase deficiency: a rarely diagnosed entity. Eur. J. Pediatr. 1996;155:561–567. doi: 10.1007/BF01957905. [DOI] [PubMed] [Google Scholar]
- 50.Bachrach BE, Weinstein DA, Orho-Melander M, Burgess A, Wolfsdorf JI. Glycogen synthase deficiency (glycogen storage disease type 0) presenting with hyperglycemia and glucosuria: report of three new mutations. J. Pediatr. 2002;140:781–783. doi: 10.1067/mpd.2002.124317. [DOI] [PubMed] [Google Scholar]
- 51.Byrne BM, Gillmer MD, Turner RC, Alnsley-Green A. Glucose homeostasis in adulthood and in pregnancy in a patient with hepatic glycogen synthetase deficiency. Br. J. Obstet. Gynaecol. 1995;102:931–933. doi: 10.1111/j.1471-0528.1995.tb10886.x. [DOI] [PubMed] [Google Scholar]
- 52.Orho M, et al. Mutations in the liver glycogen synthase gene in children with hypoglycemia due to glycogen storage disease type 0. J. Clin. Invest. 1998;102:507–515. doi: 10.1172/JCI2890. [DOI] [PMC free article] [PubMed] [Google Scholar]
- 53.Tuominen JA, et al. Post-marathon paradox: insulin resistance in the face of glycogen depletion. Am. J. Physiol. Endocrinol. Metab. 1996;270:E336–E343. doi: 10.1152/ajpendo.1996.270.2.E336. [DOI] [PubMed] [Google Scholar]
- 54.Warram JH, Martin BC, Krolewski AS, Soeldner JS, Kahn CR. Slow glucose removal rate and hyperinsulinemia precede the development of type II diabetes in the offspring of diabetic patients. Ann. Intern. Med. 1990;113:909–915. doi: 10.7326/0003-4819-113-12-909. [DOI] [PubMed] [Google Scholar]
- 55.Velho G, et al. Impaired hepatic glycogen synthesis in glucokinase-deficient (MODY-2) subjects. J. Clin. Invest. 1996;98:1755–1761. doi: 10.1172/JCI118974. [DOI] [PMC free article] [PubMed] [Google Scholar]
- 56.Levin K, Schroeder HD, Alford FP, Beck-Nielsen H. Morphometric documentation of abnormal intramyocellular fat storage and reduced glycogen in obese patients with type II diabetes. Diabetologia. 2001;44:824–833. doi: 10.1007/s001250100545. [DOI] [PubMed] [Google Scholar]


