Abstract
We describe here an automated system for the counting of multiple samples of double-stained microbial cells on sections of membrane filters. The application integrates an epifluorescence microscope equipped with motorized z-axis drive, shutters, and filter wheels with a scanning stage, a digital camera, and image analysis software. The relative abundances of specific microbial taxa are quantified in samples of marine picoplankton, as detected by fluorescence in situ hybridization (FISH) and catalyzed reporter deposition. Pairs of microscopic images are automatically acquired from numerous positions at two wavelengths, and microbial cells with both general DNA and FISH staining are counted after object edge detection and signal-to-background ratio thresholding. Microscopic fields that are inappropriate for cell counting are automatically excluded prior to measurements. Two nested walk paths guide the device across a series of triangular preparations until a user-defined number of total cells has been analyzed per sample. A backup autofocusing routine at incident light allows automated refocusing between individual samples and can reestablish the focal plane after fatal focusing errors at epifluorescence illumination. The system was calibrated to produce relative abundances of FISH-stained cells in North Sea samples that were comparable to results obtained by manual evaluation. Up to 28 preparations could be analyzed within 4 h without operator interference. The device was subsequently applied for the counting of different microbial populations in incubation series of North Sea waters. Automated digital microscopy greatly facilitates the processing of numerous FISH-stained samples and might thus open new perspectives for bacterioplankton population ecology.
During the last decade digital imaging devices have developed at an unsurpassed pace. Inexpensive digital cameras for hobby photographers have evolved to quality levels that reach or even exceed the typical instrumentation of professional microscopists in many respects, e.g., in pixel resolution of charge-coupled device chips. It is likely that there will soon be major changes in the use of digital imaging as a tool in microbial ecology. Digital cameras have already almost completely replaced traditional microphotography for documentation and publication purposes. Digital images are, moreover, the primary data of some modern microscopic techniques, such as confocal laser-scanning microscopy.
The analysis of such images by edge-enhancing and background-reducing mathematical algorithms is a well-established strategy for object morphometry, feature classification, or particle counting and sizing in disciplines as unrelated as histology, landscape ecology, or the material sciences (35). In aquatic microbiology, image analysis has been applied, e.g., for the shape recognition (6, 22, 27), sizing, and biomass quantification of the total bacterioplankton community (4, 38) or the respiratory active fraction (31), for motion tracking (5, 41), for densitometric or fluorescence intensity measurement on single cells (21, 25, 32), or to determine cell orientation in complex communities (33). The major advantages of computer-assisted image analysis in microbiology are the potential for high-throughput evaluation, the objectivation of image-derived data (e.g., object size distributions, fluorescence intensities), and the extraction of object features that cannot be detected intutitively (e.g., complex dimensions describing object shape).
The rapid advance of confocal laser-scanning microscopy is reflected in a new generation of epifluorescence microscopes that are equipped with a high-precision software-controlled motorized z-axis drive. As a spinoff of this development, many other internal devices of confocal laser-scanning microscopes, such as fluorescence shutters, field stops, objective revolvers, and bright-field illumination, can also be electronically controlled. This effectively transforms motorized microscopes into potential front ends for robotic systems, provided that the combined device allows a software controlled acquisition of images, a subsequent evaluation of their content by means of image analysis, and a feedback between the outcome of such measurements and the actions of the microscope components.
Recently, whole-cell fluorescence in situ hybridization (FISH) with rRNA-targeted oligonucleotide probes (1), followed by catalyzed reporter deposition (CARD) (8) has been described for the study of microbial population dynamics in the marine picoplankton (24). Since the CARD-FISH staining protocol requires fixation of cells on a surface, these preparations cannot be readily evaluated by flow cytometry, which is a common choice for the rapid enumeration of picoplankton (13, 19). Automated digital microscopy could provide an alternative strategy for high-throughput analysis of such samples.
However, despite the technological potential for complete automation, current approaches for the computer-assisted microscopic quantification of microbial abundances or biomasses in aquatic ecology are based on interactive steps (6, 12, 37). The development of fully operator-independent systems is mainly hampered by the difficulties related to reliable automated image acquisition. Quantification of cells from suspensions such as the picoplankton requires concentration on membrane filters, and this impedes the regular autofocusing at phase-contrast illumination. In contrast, automated high-throughput counting microscopes are already an emerging technique in medical microbiology, e.g., for the analysis of oral biofilm communities (17, 39). We describe here a prototype for the automated multisample counting of different microbial taxa of marine picoplankton after CARD-FISH staining.
MATERIALS AND METHODS
Sample collection and preparation.
Environmental samples for calibration and manual counting were collected at a depth of 1 m off the island of Helgoland in October 1999 and May 2002. Samples for experimental enrichments were obtained in August 2002 at the same location. For these incubations, 500 ml of unfiltered seawater was filled in acid-prewashed, sterile 1-liter glass bottles and then incubated in the dark for 9 h. One set of triplicate bottles was amended with a mix of amino acids of a composition as described by Eilers et al. (14) (final concentration, 200 μM), and a second set was amended with the same amino acids mixture (final concentration, 200 μM) and cAMP (final concentration, 10 μM) (9). The third set was left unaltered. Subsamples were collected at three time points (0, 4, and 9 h of incubation). All incubations were performed in the dark at the in situ temperature (19°C).
Portions of 10 to 30 ml were fixed with buffered paraformaldehyde solution (2% [vol/vol]), filtered onto white membrane filters (type GTTP4700 [Millipore, Bedford, Mass.]; diameter, 47 mm; pore size, 0.2 μm), and rinsed with distilled water. Samples were stored at −20°C until further processing. CARD-FISH and counterstaining of environmental samples was performed as described previously (24) by using tyramides labeled with the fluorescent dye Cy3 for signal amplification (TSAdirect; NEN Life Science Products, Boston, Mass.). The horseradish peroxidase-labeled oligonucleotide probes (ThermoHybaid, Ulm, Germany) EUB338, NON338 (negative control), CF319a, ROS537, and NOR5-730 (2, 16) were applied for whole-cell hybridizations for calibration purposes. Samples from the incubation experiment were hybridized with the probes EUB338, ROS537, SAR86-1249 (15), and NOR5-730. Samples hybridized with probe CF319a were a set of 10 parallel preparations from a single filter to specifically test for differences in the intrinsic variability of counting replicate hybridizations. The samples were enbedded in a custom mix of mountant amended with DAPI (4′,6′-diamidino-2-phenylindole; final concentration, 1 μg ml−1) (24) and were arranged on microscopic slides. Manual evaluation was carried out as described previously (28), and at least 1,000 DAPI-stained cells were counted per sample. Altogether, 57 hybridized samples were counted manually. The same samples were subsequently also counted with the automated system, and the results of both types of evaluation were compared by regression analysis (see below).
Microscopic equipment.
The counting apparatus is based on a Zeiss Axioplan II Imaging epifluorescence microscope (Carl Zeiss, Jena, Germany) equipped with motorized and/or remote-controlled components (fluorescence filter wheel, fluorescence shutter, Halogen lamp, field stop, and z-axis drive) and a scanning stage that holds four microscopic slides (SCAN 100×100 [Märzhäuser, Wetzlar, Germany]; stage controller MCP4 [Carl Zeiss]). Image pairs were acquired at a ×64 magnification (Plan Apochromat; Carl Zeiss) with a cooled slow-scan black-and-white charge-coupled device camera (ORCA [Hamamatsu, Herrsching, Germany]; 1,280 × 1,024 pixel resolution, with 1 pixel ≅ 0.106 μm in the microscopic image) at 2 excitation wavelengths for DAPI and Cy3. Fluorescence filter sets were Zeiss 01 for DAPI (Carl Zeiss) and a custom-made filter set for Cy3 (excitation, 530 ± 40 nm; BeamSplitter setting, 555 nm; emission, 620 ± 120 nm [Chroma, Brattleborough, Vt.]). All microscope functions, as well as image acquisition and storage (after JPG compression), were controlled by a personal computer equipped with an Intel Pentium III processor.
Software and image analysis.
The application was realized by using the interpreter language of the image analysis package KS400 (Carl Zeiss Vision, Hallbergmoos, Germany) in the Microsoft Windows NT4.0 operating system. The KS400 software not only gives full control of all hardware functions (microscope, stage, and camera) and provides numerous high-level image analysis and measurement strategies but also includes a rich list of common programming features such as the looping and nesting of subroutines, several variable types, shell commands, and the design of a simple user interface.
The KS400 package also features a proprietary autofocusing routine. This routine was very reliable at incident light but had a high failure rate in fluorescence illumination (displacement from true focal position in 58.5% of cases [n = 470]). To analyze this difference, we quantified the focal information contained in triplicate z-stacks of 60 images acquired either in brightfield or fluorescence illumination. Focal information was operationally defined as the standard deviation of all pixel intensities in a single image (18) because this parameter formed a distinct maximum at the optimal focal position of the DAPI-stained cells.
Object detection in images of DAPI-stained cells (“DAPI gray image”) was performed basically as described previously (31). Images were first standardized by determining the mean background gray level and remapping the image gray values to the total gray value range by using this value. Edge detection was performed by gradient transformation, i.e., approximating a second derivative within a 5×5 neighborhood with a “Mexican hat” filter (27). The resulting image was smoothed by a 3×3 neighborhood median filter and automatically thresholded at a fixed gray value to achieve a DAPI binary image. Objects above and below a preset pixel area (12 to 500) were discarded from the binary images. Colocalization was determined by calculating a minimum of the negative DAPI binary image and the image of FISH-stained cells (“FISH gray image”). The threshold in the resulting image was set at a fixed gray value. This ensured that only objects in the FISH gray image were detected that also showed DAPI fluorescence. The threshold gray value was calculated from the average background gray value of the FISH gray image multiplied by a signal-to-noise-ratio factor. The value of this factor was empirically determined in a threshold series ranging from 110 to 200% of the FISH gray image background as the detection limit for probe-positive cells.
The relative abundances of hybridized bacteria in 57 samples at different signal-to-noise-ratio thresholds were compared statistically to the results of manually counting the percentages of FISH-stained cells in these samples. The evaluation criteria were (i) a maximum of the regression coefficient of a linear regression of manual versus machine counting, (ii) a minimal deviation of the slope of this regression from 1, and (iii) a y intercept of the regression close to 0. In addition, the detection level of false-positive cells at each thresholding level was determined on 10 samples hybridized with the EUB338 antisense probe NON338.
RESULTS
Application development.
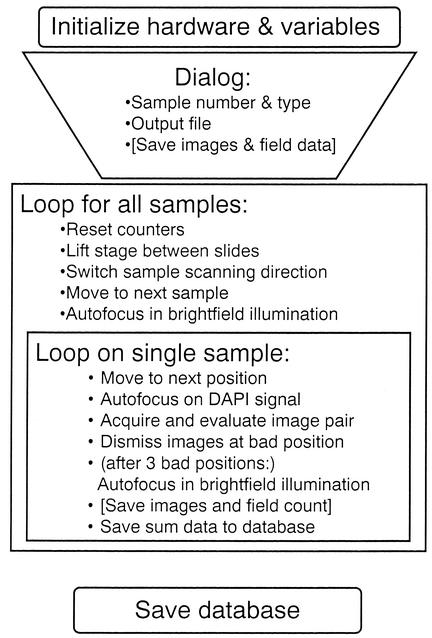
Because the overall application is fairly complex and required the optimization of several critical subsystems, a modular approach was chosen during software development. Individual modules were coded and tested separately for (i) autofocusing at incident and fluorescence illumination; (ii) image acquisition, quality control, and storage; (iii) stage movement across a single sample and between samples; (iv) image processing and evaluation; and (v) counting data acquisition and storage. Figure 1 schematically depicts the integration of the individual actions into the complete duty cycle of automated counting. In addition, an offline analysis routine for the evaluation of series of stored image pairs at several conditions of image processing was produced. This extra tool was used to develop the object detection and colocalization algorithms, and optimize their precision compared to manual counting. A complete listing of the KS400 macros can be obtained upon request from the corresponding author.
FIG. 1.
Schematic representation of the integration of individual actions in the enumeration cycle for fully automated cell counting.
Control of stage movement.
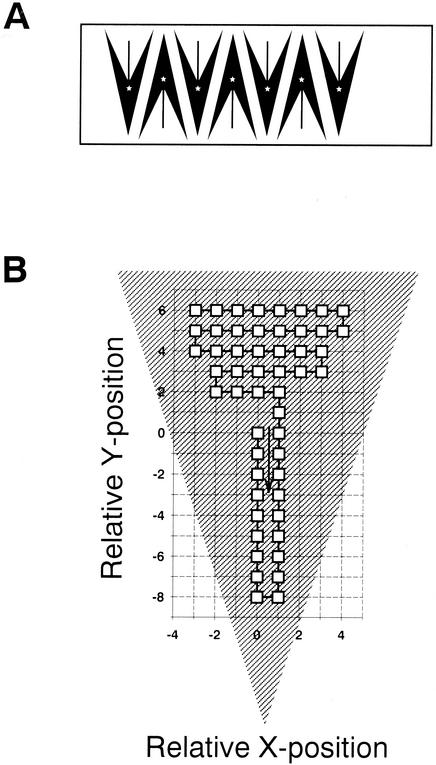
The reliability of the counting machine was greatly improved by ensuring that the system acquired images exclusively within the borders of individual samples. This was achieved (i) by producing a blueprint for approximating the required minimal size of filter sections and their exact positioning on individual microscopic slides and then storing these sample positions in a list of absolute stage coordinates (the absolute position list) (Fig. 2A) and (ii) by encoding a triangular walk path of the motorized stage across a single sample in two simple variable lists that give the relative x and y movements for reaching each subsequent position (relative position list) (Fig. 2B). The maximum number of potentially inspected fields per sample was set to 50, with an interspace of 394 μm between individual fields. By nesting the relative position list within the absolute position list, a reliable fully automated scanning of several filter sections could be achieved. In addition, a higher sample density per slide was made possible by alternating the orientation of the triangular filter pieces (Fig. 2A) and switching the sign (i.e., direction) of the relative position list between samples.
FIG. 2.
(A) Arrangement of filter section on microscopic slide. Asterisks indicate the starting positions of the filter scanning routine. (B) Walk path of scanning stage across a single filter section. The coordinates of subsequent positions are encoded in two lists of relative x and y movements.
Fluorescence and bright-field focusing.
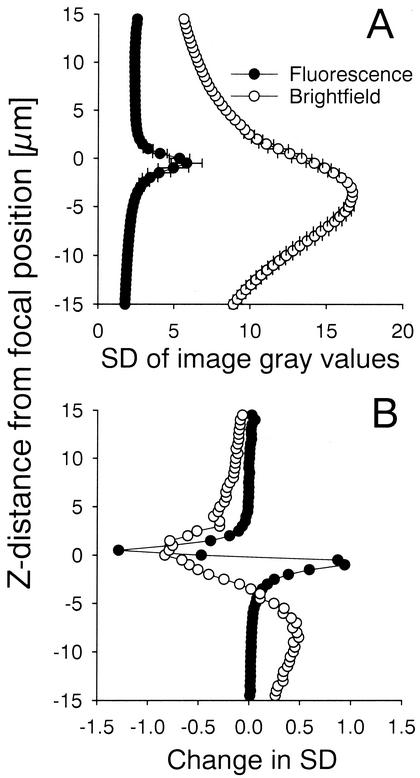
Autofocusing at incident light on pores of the membrane filters was found to operate more reliably from greater distances (albeit at reduced vertical resolution) than autofocusing on fluorescence signals. Since the focal maximum in bright-field images was displaced from the target focal plane of the DAPI-stained cells by an almost constant factor (Fig. 3A), bright-field autofocusing could be utilized as a reliable backup routine. At distances between 2 and 15 μm above and below the actual focal plane, the focal information in successive images (i.e., the absolute changes in the standard deviations of image gray values between successive images) was higher in bright-field images than in fluorescence images (Fig. 3B). In contrast, at distances close to the focal plane the focal information in the fluorescence image was more precise. Therefore, we established a double autofocusing strategy. A first coarse autofocusing routine at incident light was performed between individual filter pieces, followed by a second autofocusing step at epifluorescence illumination. Regular autofocusing at different positions within a single sample was carried out at fluorescence illumination only. The bright-field autofocusing routine was, however, automatically called if three badly focused positions were encountered in a row at fluorescence illumination. This effectively restored the focusing plane.
FIG. 3.
(A) Standard deviation of image gray values at fluorescence and bright-field illumination across a vertical transect of 15 μm above and below the focal plane of cells concentrated on membrane filters. The error bars depict the standard error of triplicate series. (B) Magnitude of changes in the standard deviation of image gray values between subsequent images in the z-stacks.
An optimal autofocusing procedure at fluorescence illumination was established as follows: first, an unfocused image was captured at UV illumination. The camera shutter speed was then adjusted in a feedback loop until the average gray value of the captured image ranged between 50 and 75. Next, the internal software autofocusing routine was evoked. A stack of five images was captured within a range of ±2 μm above and below the suggested focal plane. The “true” focal plane was then determined as the point of inflection of the standard deviation of gray values within the image stack (Fig. 3). This strategy allowed the independent testing of focal quality: a microscopic field was rejected as out of focus if no such inflection point could be established, i.e., if the maximal absolute changes in the differences of the standard deviations of subsequent images were below an empirically determined threshold value. In 57 test samples, an average of 27% (range, 2 to 71%) of image pairs were excluded after such focus quality testing.
Counting precision, system performance, and application.
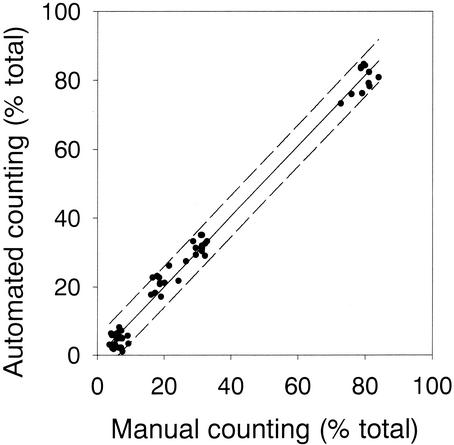
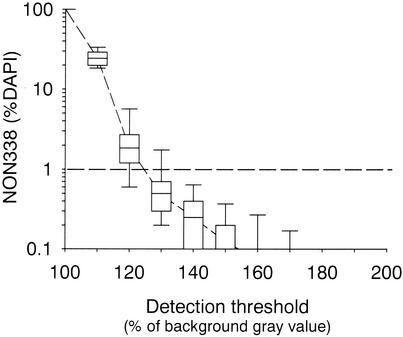
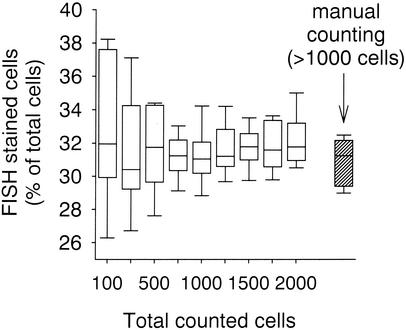
The coefficients and the slopes of linear regressions at different thresholds of the FISH gray image indicated that detection at a signal-to-noise ratio of only 1.3 (i.e., 130% of average background gray value in the probe image) was appropriate for obtaining high counting precision across a range of 3 to 85% of the hybridized cells (Fig. 4). This was reflected in a regression with a slope close to 1 and a y intercept close to 0. This regression explained the maximal amount of the observed variability (Table 1). In 10 samples hybridized with probe NON338 a threshold level of 130% resulted in false-positive detection that was, on average, <1% of the total counts (total of 238 false-positive results in 33,747 counted cells) (Fig. 5). The variability of automated counting of 10 parallel samples hybridized with probe CF319a was comparable to the variability of manual counting if 750 or more DAPI-stained cells per sample were quantified (Fig. 6). The mean acquisition and evaluation time of one well-focused image pair was 20 ± 5 s. The automated counting of all hybridized cells in a total of 2,000 DAPI-stained objects on a single filter section required between 5 and 10 min (depending on the quality of the sample, i.e., total number of acquisition attempts). The system allowed the evaluation of >50 individual samples per day without operator interference other than reloading the stage with new microscopic slides.
FIG. 4.
Correspondence beween manual counting and fully automated evaluation of samples hybridized with various probes. The lower signal-to-noise ratio for detection of probe-positive cells was 1.3 (130% of background gray value). Broken indicate the prediction interval of a linear regression (solid line) of manual versus automated counting.
TABLE 1.
Parameters of linear regressions of manual versus automated counting at different thresholds of the FISH image
| FISH threshold (% avg gray value) | Slope | Regression parameter y intercept | r2 |
|---|---|---|---|
| 110 | 0.825 | 22.61 | 0.939 |
| 120 | 1.020 | 2.91 | 0.987 |
| 130 | 1.025 | −0.39 | 0.989 |
| 140 | 1.012 | −1.44 | 0.988 |
| 150 | 0.994 | −1.78 | 0.987 |
| 160 | 0.978 | −1.87 | 0.986 |
| 170 | 0.963 | −1.88 | 0.984 |
| 180 | 0.947 | −1.80 | 0.983 |
| 190 | 0.934 | −1.73 | 0.982 |
| 200 | 0.929 | −2.28 | 0.984 |
FIG. 5.
Ranges of false-positve detection when thresholding at various signal-to-noise ratios. The boxes represent the median and the 25 and 75% percentiles. The error bars indicate the 90% percentiles. To enable log transformation values of 0 were replaced by values of 0.01.
FIG. 6.
Error ranges of 10 parallel samples at increasing numbers of total cells evaluated by automated counting. The box and error bar limits are as described for Fig. 5. The hatched box depicts the results of manual counting.
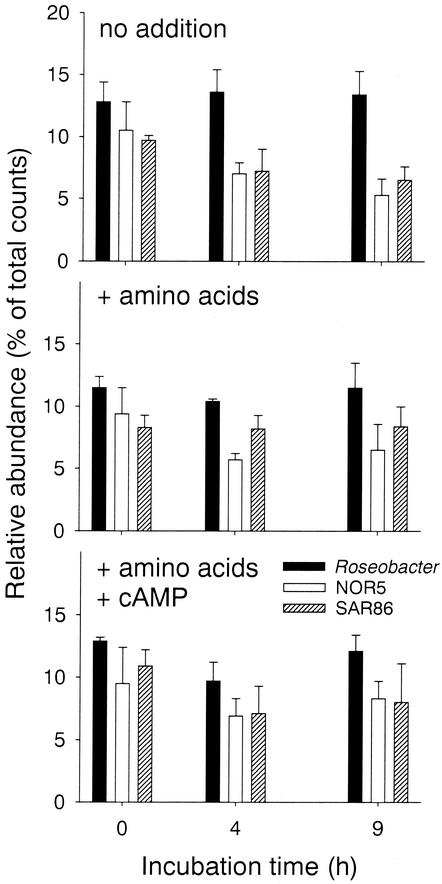
In bottle incubations of unfiltered North Sea water, little change in the relative proportions of cells hybridizing with probes ROS537 was observed (Fig. 7). The relative abundances of NOR5-730 and SAR86-1249 significantly decreased during the study period (there was no overlap in the ranges of triplicates after 9 h of incubation). In contrast, the addition of either a mix of amino acids or amino acids plus cyclic AMP (cAMP) did not visibly affect the proportions of cells hybridizing with probe ROS537, NOR5-730, or SAR86-1249. The mean proportions of cells that hybridized with the general bacterial probe EUB338 were high in all treatments (no addition, 87% [range, 84 to 89%]; with amino acids, 82% [range, 77 to 85%]; with amino acids and cAMP, 86% [range, 75 to 89%]).
FIG. 7.
Relative contributions of three bacterioplankton populations in samples of coastal North Seawater during 9 h of incubation at various conditions. The error bars indicate the total ranges of triplicates.
DISCUSSION
Automated counting of aquatic bacteria.
Fully automated digital microscopy for the operator-independent counting of multiple samples has been described for oral biofilms and human gut microflora (17, 18, 39), but no such system has been specifically developed for environmental microbiology. We set up a prototype counting machine from four standardized components (microscope, stage, camera, and computer) for the automated evaluation of >25 picoplankton samples. This represented a financial investment comparable to the acquisition of a benchtop flow cytometer. Unlike flow cytometry, presently there are no off-the-shelf systems for microscope automation, so substantial effort had to be put in the seamless integration of the individual modules for operator-independent cell counting (Fig. 1).
In combination with the recently described CARD-FISH staining (24), our application allowed a reliable high-throughput enumeration of microbial populations in plankton samples or in other highly diluted bacterial suspensions (Fig. 4). The central innovation of our design is its adaptation for counting bacteria on membrane filter sections (Fig. 2) rather than cells that are directly spotted on multiwell slides. Since phase-contrast images of bacterial cells could not be produced in our type of preparations, we needed to develop a direct focusing strategy for fluorescently labeled objects. The introduction of a second “backup” focusing mode substantially improved system performance. This actually mimicks the behavior of a human expert, since focusing in bright field onto the pores of a membrane filter would also be the typical strategy of a microscopist who has lost the focal plane at epifluorescence illumination. Clearly, the focal information of a membrane filter surface at incident light is less precise but ranges much further in the z dimension than the signal from the fluorescent cells on the filter surface (Fig. 3).
One obvious future improvement of the counting machine would be the automated determination of the biovolumes of different taxa (7, 27, 36). We deliberately did not include cell sizing options in the prototype application, although the software realization would be rather simple (i.e., adding measurement parameters to the database). For one, the accuracy of cell sizing at a ×64 magnification might not be sufficient for bacterioplankton samples. At this magnification the size of a single pixel is ca. 0.1 μm. The majority of planktonic cells are <0.4 μm in length (38). Such objects would thus be sampled by less than 20 pixels in total. This decreases the precision of biomass determinations to inacceptable levels, considering the high resolution of present-day digital cameras. On the other hand, the counting at a higher magnification would slow down the evaluation considerably, and abundance determination was the primary task of the automated system. Moreover, we did not produce binarized images of the FISH-stained cells but only detected FISH-positive cells by their fluorescence intensities. Since bacterial cell sizes derived from DAPI staining may underestimate their real dimensions (30, 40), it was not considered appropriate to calculate biomasses of different bacteria from the object sizes in the DAPI image.
Counting precision.
The central aim of the study was to determine whether and how the error level of an expert assessor can be reached by an automated system. For this purpose, we developed a strategy to quickly adapt the overall sensitivity and precision of the instrument to a specific sample type, based on a “learning set” of manually evaluated samples. Regression analysis was used to adjust the performance of automated counting (Table 1). By choosing signal-to-background thresholding conditions that resulted in a regression slope of ca. 1 and a y intercept close to 0, we could obtain unbiased estimates in samples containing very different percentages of hybridized cells (Fig. 4). At the selected detection conditions, the average level of false-positive signals was acceptable (<1%) (Fig. 5). This adaptive calibration approach greatly increases the flexibility of the system, since only one central parameter (the difference between probe signal and background) needs to be adjusted for other sample types.
Figure 6 depicts the limits of increasing the precision of population size estimates after CARD-FISH by raising the counting effort per individual sample. The automated counting of more than 750 to 1,000 DAPI-stained cells per individual preparation did not further reduce the variability of parallel preparations. At relative abundances of 30% of the total counts, the 95% confidence intervals of 10 replicate FISH counts were below ±1.5% both for automated evaluation (of >750 cells) and manual counting (>1,000 cells per sample) (Fig. 6). This indicates that it was not the automation of cell counting that was limiting the precision of the parallel counts but rather the total variability related to the FISH assay (preparation, staining, distribution of cells on filter, etc.).
Limitations and potential of automation.
There are at least two strategies for the automated microscopic counting of bacterial cells in environmental samples. Daims et al. (12) presented a highly sophisticated (semiautomated) quantification technique for complex samples that is based on confocal microscopy and equivalent area measurements. Arguing from the viewpoint of biofilm research, the authors state that any counting technique “suitable for microbial ecology should provide precise results for environmental samples containing bacteria that are not homogeneously distributed.” However, in many cases it might be less technically demanding to invest in the development of adaequate extraction and homogenization techniques and to produce preparations of cells that are randomly distributed in a monolayer on a surface for subsequent counting. This latter approach has been successfully adopted for the manual counting and identification of bacteria in marine sediments and freshwater biofilms (3, 20) or for the fully automated quantification of bacterial populations from complex dental biofilms or human feces (17, 18). Nevertheless, in its present form our counting system is not designed for such difficult samples, and more sophisticated cell recognition algorithms need to be implemented to distinguish various bacterial morphotypes from particles or to effectively separate aggregated cells (37).
A counting machine will, of course, never be able to completely replace manual evaluation of microscopic preparations. Automated systems are not very versatile with respect to sample quality, and recalibration is required for sample sets from different habitats (Table 1). The potential of microscope automation rather lies in the rapid evaluation of high numbers of samples that are monotonously similar with respect to cell density and/or morphology. Examples are the counting of numerous microbial populations in horizontal transects and depth profiles from open ocean cruises or the evaluation of parallel treatments during short-term incubations in bottles or dialysis bags. Figure 7 illustrates such a typical application for automated counting: it has been reported that the addition of cAMP to cultivation medium significantly increases the cultivation efficiency of marine bacteria on agar plates (9). We thus investigated whether an immediate stimulating effect of cAMP on particular bacterioplankton groups can be established in North Sea surface waters in the presence of a particular class of substrates (amino acids). An incubation period of 9 h was considered adaequate because activation and enrichment of other opportunistic bacterial groups is usually observed within this period (14, 26). No pronounced effects of cAMP addition on the relative abundances of the studied populations was found (Fig. 7) compared to the addition of amino acids only. This indicates that cAMP addition does not favor the enrichment of members from these groups in seawater amended with amino acids. The rapid evaluation of population changes in liquid culture by automated counting could thus help to test the effects of a wider range of treatments and eventually facilitate the directed isolation of novel bacterioplankton groups (16, 34).
At present, investigations into microbial community structure by FISH analyze fewer than 10 different taxa in fewer than 25 stations, time points, or depth layers (11, 20, 29). The scale of such studies is mainly limited by the amount of hours a skilled expert is prepared to spend on the tedium of enumerating cells. Automated microscopic FISH counting may thus eventually become as valuable for the study of the heterotrophic marine picoplankton as flow cytometry has been for the autotrophic picoplankton (10, 23) and help to elucidate the occurrence and distribution of different microbial populations in the sea.
Acknowledgments
We thank Martha Schattenhofer for assistance in the laboratory and D. R. Watson for fruitful discussions.
This study was supported by the European Union (EVK3-2001-00194 BASICS) and the Max Planck Society.
REFERENCES
- 1.Amann, R. I., L. Krumholz, and D. A. Stahl. 1990. Fluorescent-oligonucleotide probing of whole cells for determinative, phylogenetic, and environmental studies in microbiology. J. Bacteriol. 172:762-770. [DOI] [PMC free article] [PubMed] [Google Scholar]
- 2.Amann, R. I., W. Ludwig, and K. H. Schleifer. 1995. Phylogenetic identification and in situ detection of individual microbial cells without cultivation. Microbiol. Rev. 59:143-169. [DOI] [PMC free article] [PubMed] [Google Scholar]
- 3.Battin, T. J., A. Wille, B. Sattler, and R. Psenner. 2001. Phylogenetic and functional heterogeneity of sediment biofilms along environmental gradients in a glacial stream. Appl. Environ. Microbiol. 67:799-807. [DOI] [PMC free article] [PubMed] [Google Scholar]
- 4.Björnsen, P. K., and J. Kuparinen. 1991. Determination of bacterioplankton biomass, net production and growth efficiency in the Southern Ocean. Mar. Ecol. Prog. Ser. 71:185-194. [Google Scholar]
- 5.Blackburn, N., T. Fenchel, and J. Mitchell. 1998. Microscale nutrient patches in planktonic habitats shown by chemotactic bacteria. Science 282:2254-2256. [DOI] [PubMed] [Google Scholar]
- 6.Blackburn, N., A. Hagstrom, J. Wikner, R. Cuadroshansson, and P. K. Bjornsen. 1998. Rapid determination of bacterial abundance, biovolume, morphology, and growth by neural network-based image analysis. Appl. Environ. Microbiol. 64:3246-3255. [DOI] [PMC free article] [PubMed] [Google Scholar]
- 7.Bloem, J., M. Veninga, and J. Shepherd. 1995. Fully automatic determination of soil bacterium numbers, cell volumes, and frequencies of dividing cells by confocal laser-scanning microscopy and image-analysis. Appl. Environ. Microbiol. 61:926-936. [DOI] [PMC free article] [PubMed] [Google Scholar]
- 8.Bobrow, M. N., T. D. Harris, K. J. Shaughnessy, and G. J. Litt. 1989. Catalyzed reporter deposition, a novel method of signal amplification: application to immunoassays. J. Immunol. Methods 125:279-285. [DOI] [PubMed] [Google Scholar]
- 9.Bruns, A., H. Cypionka, and J. Overmann. 2002. Cyclic AMP and acyl homoserine lactones increase the cultivation efficiency of heterotrophic bacteria from the central Baltic Sea. Appl. Environ. Microbiol. 68:3978-3987. [DOI] [PMC free article] [PubMed] [Google Scholar]
- 10.Chisholm, S. W., R. J. Olson, E. R. Zettler, R. Goericke, J. B. Waterbury, and N. A. Welschmeyer. 1988. A novel free-living prochlorophyte abundant in the oceanic euphotic zone. Nature 334:340-343. [Google Scholar]
- 11.Cottrell, M. T., and D. L. Kirchman. 2000. Community composition of marine bacterioplankton determined by 16S rRNA gene clone libraries and fluorescence in situ hybridization. Appl. Environ. Microbiol. 66:5116-5122. [DOI] [PMC free article] [PubMed] [Google Scholar]
- 12.Daims, H., N. B. Ramsing, K. H. Schleifer, and M. Wagner. 2001. Cultivation-independent, semiautomatic determination of absolute bacterial cell numbers in environmental samples by fluorescence in situ hybridization. Appl. Environ. Microbiol. 67:5810-5818. [DOI] [PMC free article] [PubMed] [Google Scholar]
- 13.Del Giorgio, P. A., D. F. Bird, Y. T. Prairie, and D. Planas. 1996. Flow cytometric determination of bacterial abundance in lake plankton with the green nucleic acid stain SYTO 13. Limnol. Oceanogr. 41:783-789. [Google Scholar]
- 14.Eilers, H., J. Pernthaler, and R. Amann. 2000. Succession of pelagic marine bacteria during enrichment: a close look on cultivation-induced shifts. Appl. Environ. Microbiol. 66:4634-4640. [DOI] [PMC free article] [PubMed] [Google Scholar]
- 15.Eilers, H., J. Pernthaler, F. O. Glöckner, and R. Amann. 2000. Culturability and in situ abundance of pelagic bacteria from the North Sea. Appl. Environ. Microbiol. 66:3044-3051. [DOI] [PMC free article] [PubMed] [Google Scholar]
- 16.Eilers, H., J. Pernthaler, J. Peplies, F. O. Glöckner, G. Gerdts, and R. Amann. 2001. Isolation of novel pelagic bacteria from the German Bight and their seasonal contribution to surface picoplankton. Appl. Environ. Microbiol. 67:5134-5142. [DOI] [PMC free article] [PubMed] [Google Scholar]
- 17.Gmür, R., B. Guggenheim, E. Giertsen, and T. Thurnheer. 2000. Automated immunofluorescence for enumeration of selected taxa in supragingival dental plaque. Eur. J. Oral Sci. 108:393-402. [DOI] [PubMed] [Google Scholar]
- 18.Jansen, G. J., A. C. M. Wildeboer-Veloo, R. H. J. Tonk, A. H. Franks, and G. Welling. 1999. Development and validation of an automated, microscopy-based method for enumeration of groups of intestinal bacteria. J. Microbiol. Methods 37:215-221. [DOI] [PubMed] [Google Scholar]
- 19.Li, W. 1998. Annual average abundance of heterotrophic bacteria and Synechococcus in surface ocean waters. Limnol. Oceanogr. 43:1746-1753. [Google Scholar]
- 20.Llobet-Brossa, E., R. Rossellò-Mora, and R. Amann. 1998. Microbial community composition of Wadden Sea sediments as revealed by fluorescence in situ hybridization. Appl. Environ. Microbiol. 64:2691-2696. [DOI] [PMC free article] [PubMed] [Google Scholar]
- 21.Loferer-Krössbacher, M., J. Klima, and R. Psenner. 1998. Determination of bacterial cell dry mass by transmission electron microscopy and densitometric image analysis. Appl. Environ. Microbiol. 64:688-694. [DOI] [PMC free article] [PubMed] [Google Scholar]
- 22.Nedoma, J., J. Vrba, T. Hanzl, and L. Nedbalova. 2001. Quantification of pelagic filamentous microorganisms in aquatic environments using the line-intercept method. FEMS Microbiol. Ecol. 38:81-85. [Google Scholar]
- 23.Partensky, F., W. R. Hess, and D. Vaulot. 1999. Prochlorococcus, a marine photosynthetic prokaryote of global significance. Microbiol. Mol. Biol. Rev. 63:106-127. [DOI] [PMC free article] [PubMed] [Google Scholar]
- 24.Pernthaler, A., J. Pernthaler, and R. Amann. 2002. Fluorescence in situ hybridization and catalyzed reporter deposition for the identification of marine bacteria. Appl. Environ. Microbiol. 68:3094-3101. [DOI] [PMC free article] [PubMed] [Google Scholar]
- 25.Pernthaler, A., J. Pernthaler, H. Eilers, and R. Amann. 2001. Growth patterns of two marine isolates: adaptations to substrate patchiness? Appl. Environ. Microbiol. 67:4077-4083. [DOI] [PMC free article] [PubMed] [Google Scholar]
- 26.Pernthaler, A., J. Pernthaler, M. Schattenhofer, and R. Amann. 2002. Identification of DNA-synthesizing bacterial cells in coastal North Sea plankton. Appl. Environ. Microbiol. 68:5728-5736. [DOI] [PMC free article] [PubMed] [Google Scholar]
- 27.Pernthaler, J., A. Alfreider, T. Posch, S. Andreatta, and R. Psenner. 1997. In situ classification and image cytometry of pelagic bacteria from a high mountain lake (Gossenköllesee, Austria). Appl. Environ. Microbiol. 63:4778-4783. [DOI] [PMC free article] [PubMed] [Google Scholar]
- 28.Pernthaler, J., F. O. Glöckner, W. Schönhuber, and R. Amann. 2001. Fluorescence in situ hybridization (FISH) with rRNA-targeted oligonucleotide probes. Methods Microbiol. 30:207-226. [Google Scholar]
- 29.Pernthaler, J., F. O. Glöckner, S. Unterholzner, A. Alfreider, R. Psenner, and R. Amann. 1998. Seasonal community and population dynamics of pelagic Bacteria and Archaea in a high mountain lake. Appl. Environ. Microbiol. 64:4299-4306. [DOI] [PMC free article] [PubMed] [Google Scholar]
- 30.Posch, T., M. Loferer-Krossbacher, G. Gao, A. Alfreider, J. Pernthaler, and R. Psenner. 2001. Precision of bacterioplankton biomass determination: a comparison of two fluorescent dyes, and of allometric and linear volume-to-carbon conversion factors. Aquat. Microb. Ecol. 25:55-63. [Google Scholar]
- 31.Posch, T., J. Pernthaler, A. Alfreider, and R. Psenner. 1997. Cell-specific respiratory activity of aquatic bacteria studied with the tetrazolium reduction method, cyto-clear slides and image analysis. Appl. Environ. Microbiol. 63:867-873. [DOI] [PMC free article] [PubMed] [Google Scholar]
- 32.Poulsen, L. K., G. Ballard, and D. A. Stahl. 1993. Use of rRNA fluorescence in situ hybridization for measuring the activity of single cells in young and established biofilms. Appl. Environ. Microbiol. 59:1354-1360. [DOI] [PMC free article] [PubMed] [Google Scholar]
- 33.Ramsing, N. B., M. J. Ferris, and D. M. Ward. 2000. Highly ordered vertical structure of Synechococcus populations within the one-millimeter-thick photic zone of a hot spring cyanobacterial mat. Appl. Environ. Microbiol. 66:1038-1049. [DOI] [PMC free article] [PubMed] [Google Scholar]
- 34.Rappe, M. S., S. A. Connon, K. L. Vergin, and S. J. Giovannoni. 2002. Cultivation of the ubiquitous SAR11 marine bacterioplankton clade. Nature 418:630-633. [DOI] [PubMed] [Google Scholar]
- 35.Russ, J. C. 1990. Computer-assisted microscopy. Plenum Press, Inc., New York, N.Y.
- 36.Schönholzer, F., D. Hahn, B. Zarda, and J. Zeyer. 2002. Automated image analysis and in situ hybridization as tools to study bacterial populations in food resources, gut and cast of Lumbricus terrestris L. J. Microbiol. Methods 48:53-68. [DOI] [PubMed] [Google Scholar]
- 37.Shopov, A., S. C. Williams, and P. G. Verity. 2000. Improvements in image analysis and fluorescence microscopy to discriminate and enumerate bacteria and viruses in aquatic samples. Aquat. Microb. Ecol. 22:103-110. [Google Scholar]
- 38.Sieracki, M. E., P. W. Johnson, and J. M. Sieburth. 1985. Detection, enumeration, and sizing of planktonic bacteria by image-analyzed epifluorescence microscopy. Appl. Environ. Microbiol. 49:799-810. [DOI] [PMC free article] [PubMed] [Google Scholar]
- 39.Singleton, S., J. G. Cahill, G. K. Watson, C. Allison, D. Cummins, T. Thurnheer, B. Guggenheim, and R. Gmur. 2001. A fully automated microscope bacterial enumeration system for studies of oral microbial ecology. J. Immunoassay Immunochem. 22:253-274. [DOI] [PubMed] [Google Scholar]
- 40.Suzuki, M. T., B. Sherr Evelyn, and F. Sherr Barry. 1993. DAPI direct counting underestimates bacterial abundances and average cell size compared to AO direct counting. Limnol. Oceanogr. 38:1566-1570. [Google Scholar]
- 41.Thar, R., N. Blackburn, and M. Kühl. 2000. A new system for three-dimensional tracking of motile microorganisms. Appl. Environ. Microbiol. 66:2238-2242. [DOI] [PMC free article] [PubMed] [Google Scholar]


