Abstract
Little is known concerning environmental factors that may control the distribution of virioplankton on large spatial scales. In previous studies workers reported high viral levels in eutrophic systems and suggested that the trophic state is a possible driving force controlling the spatial distribution of viruses. In order to test this hypothesis, we determined the distribution of viral abundance and bacterial abundance and the virus-to-bacterium ratio in a wide area covering the entire Adriatic basin (Mediterranean Sea). To gather additional information on factors controlling viral distribution on a large scale, functional microbial parameters (exoenzymatic activities, bacterial production and turnover) were related to trophic gradients. At large spatial scales, viral distribution was independent of autotrophic biomass and all other environmental parameters. We concluded that in contrast to what was previously hypothesized, changing trophic conditions do not directly affect virioplankton distribution. Since virus distribution was coupled with bacterial turnover times, our results suggest that viral abundance depends on bacterial activity and on host cell abundance.
Viruses are the most abundant dynamic component among the microorganisms in the surface waters of the world's oceans. The distribution of virus abundance has been examined in many locations and habitats worldwide. Viral counts from all sorts of environments (coastal, offshore, deep sea, and tropical to polar latitudes) have been found to range from 104 particles ml−1 in oligotrophic systems to over 108 particles ml−1 in eutrophic systems (30).
Over the past decade, much effort has been devoted to improving virus quantification and to obtaining a better understanding of the ecological role of this component in the biogeochemical cycling of carbon (10, 18) and nutrients in marine systems (28). However, most studies have been focused on phage-host cell interactions and have been confined to experimental studies or small-scale field investigations. Information on viral and bacterial distribution on a large (i.e., basin or regional) scale based on synoptical samples is practically nonexistent.
The problem of the spatial scale is crucial for understanding which environmental factors influence viral distribution (6). The available data indicate that viral abundance decreases with water depth (2, 6, 13), and there is increasing evidence that physical and chemical changes (water temperature or salinity gradients) can also play a role in viral abundance and distribution (27). As a consequence, information on the relationship between hydrological features and viral distribution is needed for a predictive understanding of viral development in response to environmental changes. A reexamination of bacterial abundance data and viral abundance data collected synoptically over small spatial scales indicated that these two components are significantly correlated (30). However, studies examining larger data sets (e.g., studies based on regression analysis of reported values) have revealed that viral abundance and bacterial abundance are also significantly correlated with the concentration of chlorophyll a (which was not the case in small-scale studies [12]), suggesting that ultimately all biological parameters are correlated with levels of primary production (30). If this is confirmed by synoptic studies on large spatial scales, then chlorophyll a concentration could represent a predictive variable of bacterial and viral trends. Investigation of this possibility is also important for elucidating the link between trophic conditions and viral distribution. In fact, since in general the number of viruses is greater in productive and nutrient-rich environments, the trophic state has been proposed as a possible driving force controlling the spatial distribution of viruses along onshore-to-offshore transects (27). The rationale behind this hypothesis is that eutrophic environments support a higher standing stock of bacteria (and consequently viruses) than oligotrophic systems (25, 27), but it has also been hypothesized that eutrophication can directly stimulate viral development (17, 27).
In this study, we carried out a large-spatial-scale study on the distribution of virioplankton, bacterioplankton, exoenzymatic activities, and bacterial carbon production. These variables were related to hydrological conditions, nutrient concentrations, and in situ fluorescence (as a proxy of chlorophyll a concentration [21]) in order to test the hypothesis that the distribution of viruses in aquatic systems and the role of viruses in microbial loop functioning differ under different trophic conditions. To do this, we selected the Adriatic Sea as a model, since this body of water displays the most evident trophic gradients in the entire Mediterranean basin.
MATERIALS AND METHODS
Study site in the Adriatic Sea.
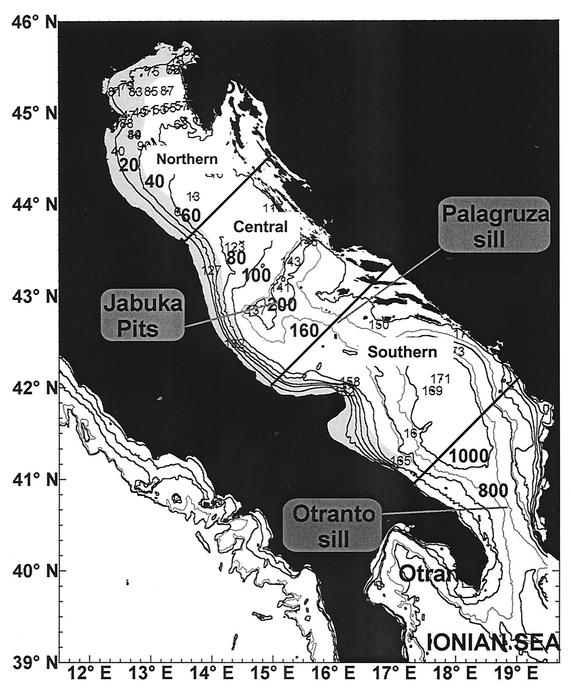
On the basis of its hydrological, oceanographic, and bathymetric features, the Adriatic Sea is usually divided into three distinct subbasins (Fig. 1): the northern, central, and southern Adriatic basins. The northern area is one of the most eutrophic areas of the Mediterranean, in part due to its shallowness (average depth, ca. 35 m). The southern basin is characterized by a wide depression (more than 1,200 m deep), which connects, through the Otranto Channel, the Adriatic basin with the Mediterranean Sea (1). In this study, the data set was basically subdivided into two groups: coastal waters (eutrophic, along the Italian coast) and neritic offshore waters (oligotrophic). The latter group also included stations close to the Slovenian, Croatian, and Albanian coasts, which due to their hydrological (salinity, transparency, density) and trophic characteristics can be considered offshore stations (1). Due to the presence of high freshwater outflows (2,900 m3 s−1, including the Po River [16]) in the western part of the northern sector, the Adriatic basin typically displays trophic gradients that decrease east- and southward and are associated with increases in salinity (1).
FIG. 1.
Sampling area and station locations in the Adriatic Sea. The grey area includes only the coastal (eutrophic) stations.
Sampling strategy and hydrological parameters.
Sampling was carried out along eight inshore-offshore transects (at a total of 44 stations) in the Adriatic Sea (from 27 January to 10 February 2001) by using the R/V Alliance. The locations of the sampling stations are shown in Fig. 1. At each station, water samples were collected at standard depths (1, 10, 20, 40, 50, 100, 150, 200, 500, 700, and 1,000 m and 1 to 2 m above the bottom) according to bottom morphology by using a Carousel water sampler carrying 12 Niskin bottles (12 liters). A CTD Sea Bird Electronics SBE 911 was used to obtain pressure, temperature, salinity, fluorescence, transmittance, and turbidity vertical profiles at all stations. Oxygen concentrations were determined by manual oceanographic methods (Winkler titration). Fluorescence values were intercalibrated with chlorophyll a concentrations determined spectrophotometrically in discrete samples (n = 59) after 90% acetone extraction (23). The chlorophyll a concentrations ranged from 0.04 to 2.57 μg liter−1 (average, 0.3 μg liter−1) and were closely related to fluorescence values. Since fluorescence values were available for all sampling depths analyzed in the present study, we used fluorescence units as a proxy for chlorophyll a concentrations. Virioplankton and bacterioplankton samples were preserved immediately after collection with prefiltered (pore size, 0.02 μm) formalin (final concentration, 2%) and stored at 4°C until analysis (30). Measurements of bacterial carbon production and extracellular enzymatic activities were carried out onboard.
Inorganic nutrients.
Analyses of dissolved nutrients (nitrate, nitrite, and orthophosphate) were performed with seawater samples that were prefiltered through Whatman GF/F filters (pore size, 0.7 μm) by using a Technicon autoanalyzer (Traacs 800) as described by Strickland and Parsons (23).
Viral and bacterial parameters.
Direct counts of bacteria and viruses were obtained by the method described by Noble and Fuhrman (19), with a few modifications. Subsamples (100 μl) were diluted 1:10 in Milli-Q-prefiltered, sterile water and then concentrated on 0.02-μm-pore-size filters (Anodisc; diameter, 25 mm; Al2O3) and stained with 20 μl of SYBR Green I (stock solution diluted 1:20). The filters were incubated in the dark for 15 min and mounted on glass slides with a drop of 50% phosphate buffer (6.7 mM, pH 7.8) and 50% glycerol containing 0.5% ascorbic acid. Viral and bacterial counts were obtained by epifluorescence microscopy (Zeiss Axioplan) by examining at least 10 fields per slide, in order to count at least 200 cells per replicate. After appropriate calibration with transmission electron microscopy and image analysis, the bacterial biovolume was estimated by assigning each fluorescent bacterial cell to a dimensional size class on the basis of cell length and shape. There was good agreement between the transmission electron microscopy and epifluorescence results, and the coefficient of variation was always <20%. Therefore, for routine analysis, biovolumes were determined by epifluorescence microscopy. Bacterial biovolume was converted to bacterial biomass by assuming that the organic carbon content was 310 fg μm−3 (8).
Bacterial carbon production.
Bacterial carbon production was determined by [3H]leucine incorporation (22). Triplicate subsamples and two blanks (1.7 ml) were added with tritiated leucine (final concentration, 20 nM) and incubated for 1 h at the in situ temperature. Incubation was stopped with 100% trichloroacetic acid (TCA) (blanks were stopped with TCA immediately). After each pellet was washed with 5% TCA and 80% ethanol, it was supplemented with 1 ml of liquid scintillation cocktail (Ultima Gold MV; Packard). The incorporated radioactivity was measured by determining the counts per minute with a liquid scintillation counter (Packard Tri-Carb 300).
Enzymatic activities.
Extracellular enzyme activities (l-aminopeptidase, β-d-glucosidase, and phosphatase) were determined by cleavage of artificial fluorogenic substrates (5, 14). For determination of β-d-glucosidase, l-aminopeptidase, and phosphatase activities, methylumbelliferone-β-glucopyranoside (final concentration, 200 μM), l-leucine-4-methylcoumarinile-7-amide (final concentration, 200 μM), and 4-methylumbelliferone phosphate (final concentration, 50 μM), respectively, were utilized. Incubation was performed in the dark at the in situ temperature for 1 h. The fluorescence released by enzymatic cleavage of the artificial substrates was measured fluorometrically (excitation at 365 nm and emission at 455 nm for methylumbelliferone-β-glucopyranoside and 4-methylumbelliferone phosphate analyses and excitation at 440 nm and emission at 380 nm for l-leucine-4-methylcoumarinile-7-amide analyses). Three replicates were used for all analyses.
Statistical analyses.
A type II regression analysis was performed for the variables investigated. Analysis of variance (ANOVA) and t test analyses were utilized to investigate differences in microbiological parameters among water layers and between the coast and the open sea.
RESULTS
Since station depth increased notably from the northern sector to the southern sector, the analysis of the spatial distribution of inorganic nutrients and other hydrological parameters (unless specifically discussed below, as in the case of the vertical profile analysis) was limited to surface values to avoid bias due to data averaging and/or integration.
Environmental parameters.
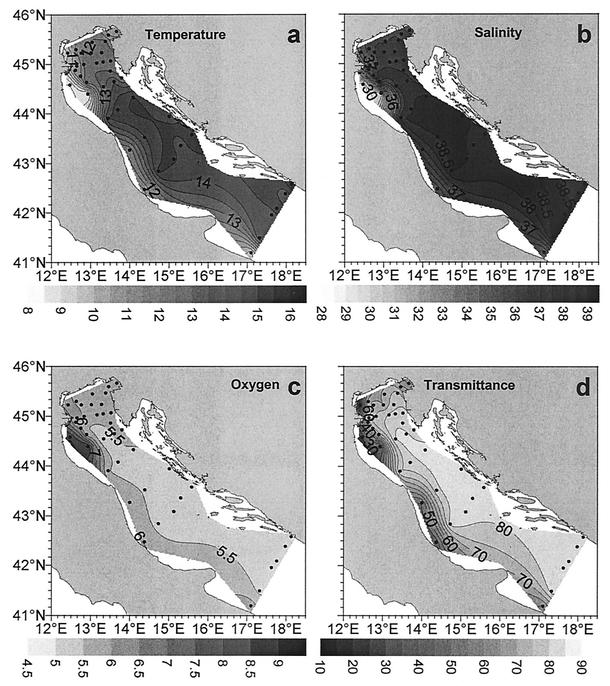
The distribution of hydrological parameters in the Adriatic basin is shown in Fig. 2. The temperature ranged from 8.37 to 15.06°C and increased southward and from coastal to open sea stations (Table 1; Fig. 1 shows the difference between coastal and offshore stations). Also, salinity (range, 28.56 to 38.74‰) and transmittance (range, 20.11 to 83.65%) increased southward and from the coast to the open sea due to the decreasing influence of the Po River outflow. The vertical structure of the water column was rather homogeneous in terms of temperature (i.e., there was a lack of water column stratification), and higher salinity and nutrient concentrations were generally observed in deeper water layers. Finally, the surface oxygen content (range, 4.65 to 8.46 ml liter−1) displayed a slightly decreasing trend from south to north.
FIG. 2.
Distribution of hydrological parameters in surface waters of the Adriatic Sea. (a) Temperature; (b) salinity; (c) oxygen concentration; (d) transmittance.
TABLE 1.
Hydrological parameters for coastal and offshore surface watersa
| Stations | Depth (m) | Salinity (‰) | Temp (°C) | Density (sigma-th kg m−3) | Fluorescence (autofluor- escence units) | Oxygen concn (ml per liter−1) | Transmittance (%) | Turbidity (U) | Nitrite concn (μM) | Nitrate concn (μM) | Phosphate concn (μM) |
|---|---|---|---|---|---|---|---|---|---|---|---|
| Coastal | 14.70 ± 1.43 | 37.05 ± 0.17 | 11.81 ± 0.12 | 28.21 ± 0.12 | 3.25 ± 0.54 | 5.89 ± 0.06 | 58.19 ± 1.39 | 4.12 ± 0.18 | 0.73 ± 0.04 | 4.45 ± 0.38 | 0.27 ± 0.0 |
| Open sea | 18.79 ± 1.90 | 38.22 ± 0.03 | 13.43 ± 0.09 | 28.80 ± 0.01 | 0.94 ± 0.04 | 5.53 ± 0.02 | 76.89 ± 0.65 | 0.55 ± 0.07 | 0.50 ± 0.03 | 2.45 ± 0.67 | 0.16 ± 0.0 |
The values are means ± standard errors.
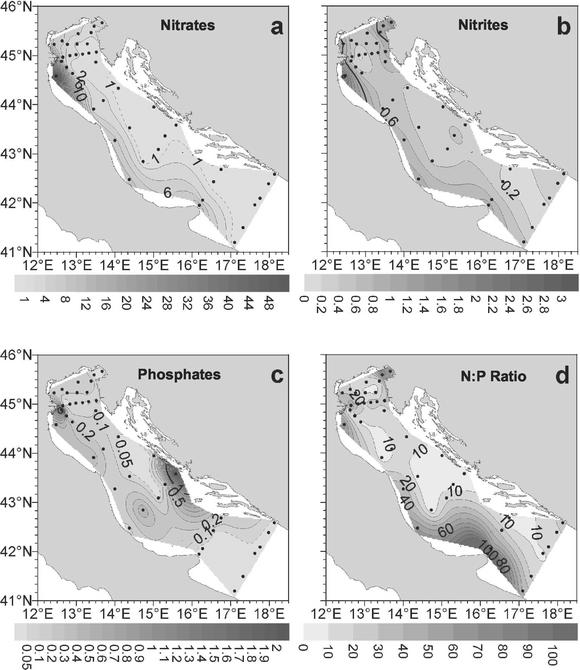
The distribution of surface inorganic nutrients is illustrated in Fig. 3. The concentrations of inorganic nutrients (nitrite, nitrate, and orthophosphate) displayed wide spatial variability, with the values ranging within 2 orders of magnitude, and decreased from the coast to the open sea (Table 1). The nitrate concentrations ranged from 0.02 to 49.22 μM, while the nitrite concentrations ranged from 0.07 to 2.51 μM. For both of these nutrients the highest values were obtained in the northern sector and the lowest values were obtained in the southern sector. Conversely, the orthophosphate concentrations (range, 0.00 to 3.20 μM) were not significantly different in different sectors. The nitrate and nitrite concentrations were negatively correlated with salinity (P < 0.01 for both; n = 93), temperature (P < 0.01 for both; n = 93), and transmittance (P < 0.01; n = 93) and positively correlated with oxygen content (P < 0.01; n = 86).
FIG. 3.
Distribution of nutrient concentrations in surface waters of the Adriatic Sea. (a) Nitrates; (b) nitrites; (c) phosphates; (d) N/P ratio.
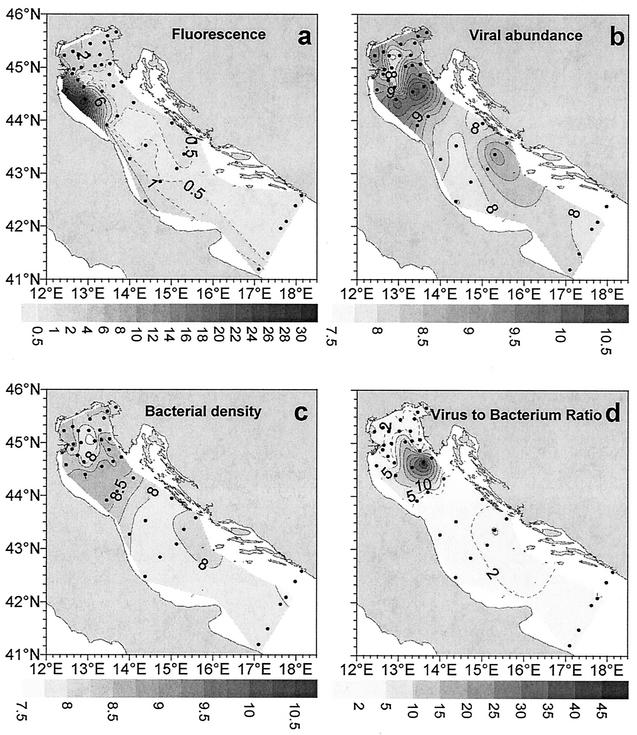
The fluorescence ranged from 0.45 to 30.00 arbitrary units, and there was a coast-open sea gradient (Fig. 4a); the highest values were obtained in the north central Adriatic and in surface coastal waters. Fluorescence was negatively correlated with salinity and temperature (P < 0.01 for both; n = 93), with transmittance (P < 0.01; n = 92), and with nitrate and nitrite concentrations (P < 0.01 for both; n = 86).
FIG. 4.
Distribution of microbial densities in surface waters of the Adriatic Sea. (a) Fluorescence; (b) viral abundance (log transformed); (c) bacterial density (log transformed); (d) virus-to-bacterium ratio.
Viruses and bacteria.
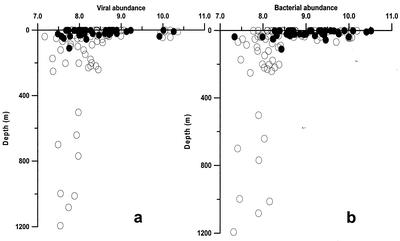
The distribution of virioplankton and bacterioplankton is shown in Fig. 4b and c. Viral abundance (Table 2) displayed wide spatial variability, and the values for surface waters ranged from 0.2 × 10⁸ to 230.0 × 10⁸ particles liter−1 (average for surface waters, 15.3 × 10⁸ particles liter−1). The highest values were observed in surface offshore waters along a north-central Adriatic transect, and these values were largely influenced by the Po River outflow (Fig. 4b). Vertical profiles of viral abundance are illustrated in Fig. 5a. Viral abundance decreased significantly in deeper water layers (F= 5.9 and P < 0.01, as determined by ANOVA) and was also significantly correlated with water depth (P < 0.01; n = 85). Viral abundance was also significantly correlated with nitrate concentration (P < 0.01; n = 85) and alkaline phosphatase activity (P < 0.01; n = 85).
TABLE 2.
Viral abundance, bacterial abundance, virus-to-bacterium abundance ratio, bacterial biomass, exoenzymatic activities (glucosidase, aminopeptidase, and alkaline phosphatase activities and ratio of aminopeptidase activity to phosphatase activity), and bacterial C production in surface coastal and offshore waters of the Adriatic Seaa
| Stations | No. of bacteria (108 cells liter−1) | No. of viruses (108 particles liter−1) | Virus-to- bacterium ratio | Bacterial biomass (μg of C liter−1) | β-Glucosidase activity (nmol liter−1 h−1) | Aminopeptidase activity (nmol liter−1 h−1) | Phosphatase activity (nmol liter−1 h−1) | Ratio of aminopeptidase activity to phosphatase activity | Bacterial C production (mg of C liter−1 h−1) |
|---|---|---|---|---|---|---|---|---|---|
| Coastal | 1.61 ± 0.00 | 2.97 ± 3.28 | 3.26 ± 0.42 | 20.65 ± 1.75 | 0.45 ± 0.05 | 40.29 ± 4.81 | 12.50 ± 1.06 | 4.66 ± 0.48 | 0.07 ± 0.00 |
| Open sea | 1.31 ± 0.17 | 3.35 ± 4.9 | 6.44 ± 1.07 | 18.65 ± 1.58 | 0.63 ± 0.11 | 9.17 ± 0.90 | 7.12 ± 0.71 | 2.53 ± 0.33 | 0.03 ± 0.00 |
The values are means ± standard errors.
FIG. 5.
Vertical profile of viral and bacterial densities [log (x + 1) transformed] in coastal (solid circles) and offshore (open circles) waters in the Adriatic Sea. (a) Viral abundance; (b) bacterial abundance.
The bacterial direct counts (BDC) (Table 2) ranged from 0.23 × 10⁸ to 9.09 × 10⁸ cells liter−1, and the average was 1.84 × 10⁸ cells liter−1. BDC vertical profiles are illustrated in Fig. 5b. Also, the bacterial density decreased significantly in deeper water layers (F = 5.7 and P < 0.01, as determined by ANOVA) and was significantly correlated with water depth (P < 0.01; n = 89). The highest values were again observed in the north central sector of the Adriatic Sea. Bacterial abundance displayed a coast-open sea gradient, and the values were ca. 30% higher in surface coastal waters. BDC were positively correlated with fluorescence and oxygen content (P < 0.05 and P < 0.01, respectively; n = 89) and negatively correlated with salinity and temperature (P < 0.01 for both). BDC were also significantly correlated with nitrite and nitrate concentrations (P < 0.01 for both; n = 89). The virus-to-bacterium ratio ranged from 0.31 to 49.22 (average, 4.50), and the highest values were obtained in the north central Adriatic sector.
Bacterial C production and exoenzymatic activities.
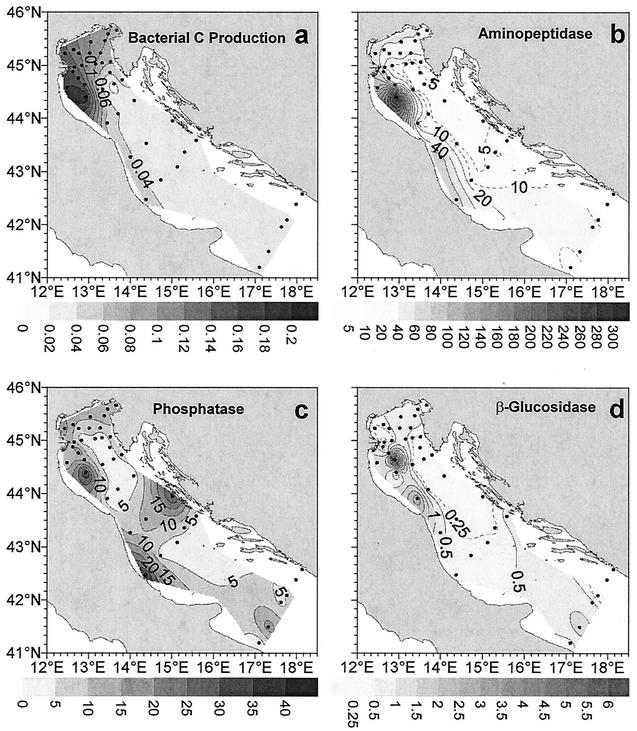
The distribution of bacterial carbon production in the Adriatic basin is shown in Fig. 6a. The bacterial carbon production ranged from 0.01 to 0.20 μg of C liter−1 h−1 (average, 0.04 μg of C liter−1 h−1). Bacterial carbon production clearly decreased from the northern and central Adriatic Sea to the southern Adriatic Sea, and the values were approximately twofold greater in coastal waters than at the open sea surface. Bacterial carbon production was negatively correlated with temperature (P < 0.01; n = 34) and positively correlated with fluorescence (P < 0.001; n = 34) and inorganic N concentrations (both nitrates and nitrites; P < 0.01; n = 34). Moreover, bacterial carbon production was negatively correlated with surface phosphate concentrations (P < 0.01; n = 34) and positively correlated with phosphate concentrations in offshore waters (P < 0.01; n = 34). The bacterial turnover times (calculated by determining the ratio of bacterial biomass to bacterial carbon production) ranged from 0.1 to 7.1 days (average, 2 days) and were positively correlated with total viral abundance (P < 0.01; n = 34). The distributions of enzymatic activities (aminopeptidase, phosphatase, and β-glucosidase) are shown in Fig. 6b to d. The levels of aminopeptidase activity (Table 2) were the highest levels among all of the enzymatic activities investigated, ranging from 0.02 to 296.7 nM h−1 (average, 18.80 nM h−1), and were characterized by a strongly decreasing coast-open sea gradient (on average, the values were fourfold higher in coastal waters than in surface offshore waters). Aminopeptidase activity was correlated positively with fluorescence and nitrate concentration (P < 0.01 for both; n = 80), as well as bacterial density and carbon production (P < 0.05 and P < 0.01, respectively), and was correlated negatively with temperature and salinity (P < 0.01 for both; n = 80). The alkaline phosphatase activity (Table 2) ranged from 0.22 to 44.17 nM h−1 (average, 9.06 nM h−1); the highest values were obtained in the northern sector, and the lowest values (on average approximately threefold lower) were obtained in the central part of the basin. The alkaline phosphatase activity was approximately twofold higher in coastal waters than in the open sea and was correlated negatively with viral abundance and with the ratio of virus abundance to bacterial abundance (P < 0.01 and P < 0.05, respectively; n = 80) and positively with fluorescence and bacterial carbon production (P < 0.01 for both; n = 80). The ratio of aminopeptidase activity to phosphatase activity ranged from 0.01 to 294.46 (average, 5.9). Finally, the β-d-glucosidase activity (Table 2) exhibited the lowest values (range, 0.01 to 6.14 nM h−1; average, 0.47 nM h−1) and did not show any clear spatial pattern.
FIG. 6.
Distribution of microbial functional parameters in surface waters of the Adriatic Sea. (a) Bacterial C production; (b) aminopeptidase activity; (c) alkaline phosphatase activity; (d) β-glucosidase activity.
DISCUSSION
Environmental characteristics of the Adriatic Sea.
The Adriatic basin displayed clear gradients of both hydrological parameters and physical and chemical parameters, thus representing a model for investigating the effects of changing trophic conditions on viral distribution and on microbial loop functioning on a large spatial scale. The Po River outflow had a clear effect on salinity, transmittance, and fluorescence values, creating evident decreasing gradients south- and eastward, and significantly lower values (except for salinity) were obtained offshore and in the eastern sector of the Adriatic basin (Table 1). Accordingly, the concentrations of nitrates and phosphates were characterized by clearly decreasing coast-open sea gradients, and the values were approximately twofold higher in coastal waters than in offshore surface waters. The surface temperatures increased southward, and on average, the values were ca. 2°C higher in the southern basin.
Large-scale spatial distribution of viral abundance.
The viral abundance observed in this study falls within the range of previously published values for coastal and estuarine environments worldwide (30), and the values match values observed in the autumn and winter in the Adriatic Sea (25, 27), thus providing a model for investigating the viral response to changing trophic conditions. In the Adriatic basin, the bacterial densities varied within a relatively narrow range (the ratio of the highest value to the lowest value was 27:1), whereas the viral abundance displayed much greater variability. The range of viral abundance values observed in this large-scale study (107 to 1010 particles liter−1) indicates that the variability of virus abundance can be much greater than the variability predicted from small-scale studies. This fact, coupled with the wide range of the virus-to-bacterium ratio, suggests that the virus-host cell system in the Adriatic Sea is highly dynamic and that viral densities might play an important role in microbial loop functioning.
In previous studies (3, 6, 25), workers found that both viral abundance and bacterial abundance decreased significantly with depth in the water column. Investigations carried out in nonstratified conditions revealed homogeneous viral counts with depth (12, 31). Conversely, results of our study, carried out in nonstratified conditions and based on a larger data set, revealed that viral abundance decreased with increasing depth in the water column, including in shallow waters. Previous investigators reported an inverse correlation between viral abundance and salinity and hypothesized that there was input of viruses from freshwater (27). This was not confirmed in the present study, in which bacterial abundance was negatively correlated with salinity, but viral distribution was independent of salinity gradients. This result contrasts with the results of other studies (27) which reported the relationship between viral abundance and salinity, and it suggests that virus distribution does not reflect the input of allochthonous freshwater viruses. All these data indicate that virus distribution and abundance were not controlled by hydrodynamic conditions.
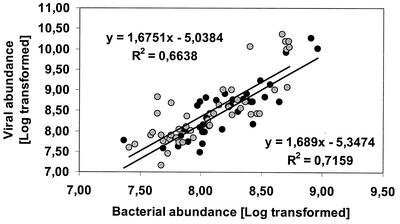
The spatial distributions of viruses and bacteria in surface waters of the Adriatic Sea were significantly and positively correlated. A significant relationship between bacterial abundance and viral abundance has been reported in several studies dealing with both allopatric and sympatric samples (9, 11, 26). In our study, the slope coefficient of the regression between bacterial abundance and viral abundance was 1.64 (log viral direct counts = 1.64 · log BDC − 4.85; r = 0.85), and similar slope coefficients were observed for coastal and offshore samples (1.69 and 1.68, respectively) (Fig. 7). These slopes match perfectly the coefficient previously reported for the northern Adriatic between 1991 and 1993 (24), suggesting that the relationship between viral abundance and bacterial abundance has not changed in the last decade.
FIG. 7.
Type II regression analysis of bacterial and viral abundance [log (x + 1) transformed] in surface waters of the Adriatic Sea. The slopes of the regressions of the coastal and open sea data sets are shown.
However, our results contrast with the results of previous studies in which researchers investigated the relationship between trophic state and virus distribution (3, 4, 9, 27). The general conclusion drawn from previous correlative studies (based on data collected from a variety of environments) is that chlorophyll a is a slightly better predictor of virioplankton abundance than bacterial density is (17, 30). In the present study viral abundance was not correlated with fluorescence (which was used in this study as a measure of phytoplankton biomass [21]). Although correlation analyses do not allow inferences concerning cause-effect relationships, our results suggest that at large spatial scales virus distribution is independent of trophic gradients.
Viral distribution is expected to be influenced by river input, which, because it enhances primary production and stimulates heterotrophic processes, and can be responsible for increased viral abundance. However, this was not confirmed in the present study since the highest viral abundance values were observed in offshore waters not influenced by the Po River input, which (as shown in Fig. 3 and 4) had a direct effect only on a narrow water corridor along the Italian coast.
Since there is evidence that dissolved inorganic nutrients stimulate bacterial development (7), inorganic nutrient concentrations can also indirectly influence viral distribution. It has also been suggested that viruses may be directly influenced by inorganic nutrients and that, due to their high ratios of nucleic acids to proteins, they could be more sensitive to phosphorus than to nitrate limitation (29). In our study, we found that a high input of nutrients (less evident for P than for N) resulted in higher bacterial density in coastal waters (Table 2), but viral abundance and distribution were not affected.
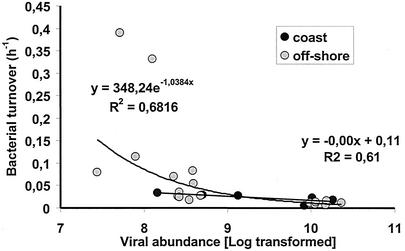
Not only is information on viral distribution on large spatial scales extremely limited, but there have also been no attempts to relate viral abundance to bacterial metabolic variables (3, 15, 31). We found that viral abundance was coupled with bacterial turnover times, indicating that bacterial activity played a primary role in the development of viral abundance (Fig. 8). Recently, it has also been suggested that viral infection of bacterioplankton (and/or phytoplankton) may be an important route for phosphate recycling (10, 20), but in our study phosphatase activity and viral abundance were inversely correlated. In particular, phosphatase activity was approximately twofold greater in coastal waters than in offshore waters, while the viral abundance and the virus-to-bacterium ratio decreased by ca. 50%. This result is opposite what was predicted from conceptual viral and microbial loop interactions (10) and indicates that the release of cell debris derived from viral infection cannot enhance the rate of P recycling if cell lysis is coupled with a reduction in alkaline phosphatase activity.
FIG. 8.
Relationship between viral abundance and bacterial turnover time (expressed in hours and calculated by determining the ratio of bacterial biomass to bacterial carbon production) in surface waters of the Adriatic Sea.
The results of this large-scale study indicate the lack of dependence of virioplankton on biotic variables (chlorophyll a) or abiotic variables (hydrology, salinity, inorganic nutrients) commonly utilized in field studies to explain viral distribution. This also suggests that the correlation between virus abundance and eutrophication reported in previous studies might have been biased by the smaller scale of the investigations. We concluded that in contrast to what was previously hypothesized, at large spatial scales in highly eutrophic systems viral abundance depends only on bacterial activity and on host cell abundance.
Acknowledgments
We thank the crew of the R/V Alliance and the NATO SACLANT Undersea Research Centre for collaboration. The critical reading and suggestions of A. Dell'Anno, A. Pusceddu, and two anonymous reviewers concerning an early draft of the manuscript are greatly appreciated.
This research was supported by the Ministry for Environment (Program MAT: Mucilage in Adriatic and Tyrrhenian Sea) and by EU project MEDVEG.
REFERENCES
- 1.Artegiani, A., D. Bregant, E. Paschini, N. Pinardi, F. Raicich, and A. Russo. 1997. The Adriatic Sea general circulation. J. Phys. Oceanogr. 27:1497-1514. [Google Scholar]
- 2.Bird, D. F., and R. Maranger. 1993. Palmer LTER: aquatic virus abundances near the Antarctic Peninsula. Antarct. J. U. S. 28:234-235. [Google Scholar]
- 3.Boehme, J., M. E. Frischer, S. C. Jang, C. A. Kellogg, S. Pichard, J. B. Rose, C. Steinway, and J. H. Paul. 1993. Viruses, bacterioplankton in the south-eastern Gulf of Mexico: distribution and contribution to oceanic DNA pools. Mar. Ecol. Prog. Ser. 97:1-10. [Google Scholar]
- 4.Cho, B. C., and F. Azam. 1990. Biogeochemical significance of bacterial biomass in the ocean's euphotic zone. Mar. Ecol. Prog. Ser. 63:253-259. [Google Scholar]
- 5.Chrost, R. J. 1991. Measurement of enzyme kinetics in water samples: effect of freezing and soluble stabilizer. Mar. Ecol. Prog. Ser. 70:93-100. [Google Scholar]
- 6.Cochlan, W. P., J. Wikner, G. F. Steward, D. C. Smith, and F. Azam. 1993. Spatial distribution of viruses, bacteria, and chlorophyll a in neritic, oceanic and estuarine environments. Mar. Ecol. Prog. Ser. 92:77-87. [Google Scholar]
- 7.Danovaro, R. 1998. Do bacteria compete with phytoplankton for inorganic nutrients? Possible ecological implications. Chem. Ecol. 14:83-96. [Google Scholar]
- 8.Fry, J. A. 1990. Direct methods and biomass estimation. Methods Microbiol. 22:41-85. [Google Scholar]
- 9.Fuhrman, J. A., T. D. Sleeter, C. A. Carlson, and L. M. Proctor. 1989. Dominance of bacterial biomass in the Sargasso Sea and its ecological implication. Mar. Ecol. Prog. Ser. 57:207-217. [Google Scholar]
- 10.Fuhrmann, J. A. 1999. Marine viruses and their biogeochemical and ecological effects. Nature (London) 399:541-548. [DOI] [PubMed] [Google Scholar]
- 11.Gasol, J. M., and C. M. Duarte. 2000. Comparative analyses in aquatic microbial ecology: how far do they go? FEMS Microbiol. Ecol. 31:99-106. [DOI] [PubMed] [Google Scholar]
- 12.Guixa-Boixereu, N., D. Vasquè, J. P. Gasol, and C. Pedrós-Alió. 1999. Distribution of viruses and their potential effect on bacterioplankton in a oligotrophic marine system. Aquat. Microb. Ecol. 19:205-213. [Google Scholar]
- 13.Hara, S., I. Koike, K. Terauchi, H. Kamiya, and E. Tanoue. 1996. Abundance of viruses in deep oceanic waters. Mar. Ecol. Prog. Ser. 145:269-277. [Google Scholar]
- 14.Hoppe, H. G. 1993. Use of fluorogenic model substrates for extracellular enzyme activity (EEA) of bacteria, p. 423-431. In P. F. Kemp, E. B. Sherr, and J. J. Cole (ed.), Handbook of methods in aquatic ecology. Lewis Publishers, Boca Raton, Fla.
- 15.Kirchman, D. L. 1990. Limitation of bacterial growth by dissolved organic matter in the subarctic Pacific. Mar. Ecol. Prog. Ser. 62:47-54. [Google Scholar]
- 16.Malone, T. C., A. Malej, L. W. Harding, Jr., and N. Smodlaka (ed.). 1999. Coastal and estuarine studies. Ecosystems at the land-sea margin. Drainage basin to coastal sea, vol. 55. American Geophysical Union Press, Washington, D.C.
- 17.Maranger, R., and D. F. Bird. 1995. Viral abundance in aquatic systems: a comparison between marine and fresh waters. Mar. Ecol. Prog. Ser. 121:1-3. [Google Scholar]
- 18.Noble, R. T., and J. A. Fuhrman. 1997. Virus decay and its causes in coastal waters. Appl. Environ. Microbiol. 63:77-83. [DOI] [PMC free article] [PubMed] [Google Scholar]
- 19.Noble, R. T., and J. A. Fuhrman. 1998. Use of SYBR Green I for rapid epifluorescence counts of marine viruses and bacteria. Aquat. Microb. Ecol. 14:113-118. [Google Scholar]
- 20.Noble, R. T., and J. A. Fuhrman. 1999. Breakdown and microbial uptake of marine viruses and other lysis products. Aquat. Microb. Ecol. 20:1-11. [Google Scholar]
- 21.Seuront, L., F Schmitt, Y. Lagadeuc, D. Schertzer, and S. Lovejoy. 1999. Universal multi-fractal analysis as a tool to characterize multiscale intermittent patterns: example of phytoplankton distribution in turbulent coastal waters. J. Plankton Res. 21:877-922. [Google Scholar]
- 22.Simon, M., and F. Azam. 1989. Protein content and protein synthesis rates of planktonic marine bacteria. Mar. Ecol. Prog. Ser. 51:201-203. [Google Scholar]
- 23.Strickland, J. D., and T. R. Parsons. 1968. A practical handbook of seawater analysis. Bull. Fish. Res. Board Can. 167:1-312. [Google Scholar]
- 24.Weinbauer, M. G., and C. A. Suttle. 1996. Potential significance of lysogeny to bacteriophage production and bacterial mortality in coastal waters of the Gulf of Mexico. Appl. Environ. Microbiol. 62:4374-4380. [DOI] [PMC free article] [PubMed] [Google Scholar]
- 25.Weinbauer, M. G., D. Fuks, S. Puskaric, and P. Peduzzi. 1995. Diel, seasonal, and depth-related variability of viruses and dissolved DNA in the Northern Adriatic Sea. Microb. Ecol. 30:25-41. [DOI] [PubMed] [Google Scholar]
- 26.Weinbauer, M. G., and P. Peduzzi. 1995. Significance of viruses versus heterotrophic nanoflagellates for controlling bacterial abundance in the northern Adriatic Sea. J. Plankton Res. 17:1851-1856. [Google Scholar]
- 27.Weinbauer, M. G., D. Fuks, and, P. Peduzzi. 1993. Distribution of viruses and dissolved DNA along a coastal trophic gradient in the northern Adriatic Sea. Appl. Environ. Microbiol. 59:4074-4082. [DOI] [PMC free article] [PubMed] [Google Scholar]
- 28.Wilhelm, S. W., and C. A. Suttle. 2000. Viruses as regulators of nutrient cycles in aquatic environments, p. 551-556. In C. R. Bell, M. Brylinsky, and P. Johnson-Green (ed.), Microbial biosystems: new frontiers. Proceedings of the VIII International Symposium on Microbial Ecology. Atlantic Canada Society for Microbial Ecology, Halifax, Nova Scotia.
- 29.Wilson, W. H., and N. H. Mann. 1996. The effect of phosphate status on virus populations during a mesocosm study, p. 77. In G. Bratbak and F. Thingstad (ed.), V European Microbial Ecology Symposium, Bergen, Norway.
- 30.Wommack, K. E., and R. R. Colwell. 2000. Virioplankton in aquatic ecosystems. Microbiol. Mol. Biol. Rev. 64:69-114. [DOI] [PMC free article] [PubMed] [Google Scholar]
- 31.Wommack, K. E., R. T. Hill, M. Kessel, E. Russek-Cohen, and R. R. Colwell. 1992. Distribution of viruses in the Chesapeake Bay. Appl. Environ. Microbiol. 58:2965-2970. [DOI] [PMC free article] [PubMed] [Google Scholar]


