Abstract
A novel NAD-dependent dehydrogenase highly specific for 1,5-anhydro-d-glucitol (1,5-AG) was found in the cell extract of an imperfect fungus, Trichoderma longibrachiatum strain 11-3. This fungus used 1,5-AG as a sole carbon source for growth and transformed 1,5-AG into glucose. 1,5-AG dehydrogenase (AGH) was purified to homogeneity, as determined by sodium dodecyl sulfate-polyacrylamide gel electrophoresis (SDS-PAGE). The molecular mass of the purified enzyme was estimated to be 36 and 141 kDa by SDS-PAGE and by gel filtration, respectively, suggesting that the enzyme was homotetrameric. The enzyme was highly specific for 1,5-AG and did not exhibit activity with any sugar or sugar alcohol tested in this study other than 1,5-AG. A linear relationship between the initial rate of the enzyme reaction and the concentration of 1,5-AG at the physiological level was observed. The presence of glucose in abundance did not interfere with the relationship. The optimum temperature for the enzyme reaction was 50°C, and the enzyme was stable at temperatures up to 70°C. These results suggested that AGH is a novel enzyme and is useful for specifically diagnosing diabetes mellitus.
A polyol, 1,5-anhydro-d-glucitol (1,5-AG), is a six-carbon monosaccharide that is the 1-deoxy form of glucopyranose. It has been pointed out that 1,5-AG is a sensitive marker of glycemic control in diabetic patients, because the plasma level of this compound decreases dramatically in diabetes patients (1, 10, 17). The plasma concentration of 1,5-AG in diabetes mellitus patients was 1.9 ± 1.8 μg/ml (mean ± standard deviation), which was remarkably lower than the value in healthy subjects and patients with other diseases, including some metabolic and hormonal diseases (mean value range, 13.4 to 28.3 μg/ml) (18). The lower levels of 1,5-AG in diabetic patients are thought to be due to competitive inhibition of the reabsorption of the compound at the renal proximal tubuli by a glucose transporter in the presence of excess glucose in the glomerular filtrate (5, 18, 19).
The 1,5-AG concentration in serum has been determined by high-performance liquid chromatography (9, 13, 14) and gas-liquid chromatography (10, 17, 21), but the specificities for 1,5-AG of these methods are relatively low and the procedure, which involves assaying large number of samples, is too tedious. There have been some reports about the enzymes which exhibit activity with 1,5-AG. Pyranose oxidase from Polyporus obtusus is used for enzymatic determination of 1,5-AG. This method requires removal of glucose from samples with a column (16) or conversion of glucose in samples to glucose 6-phosphate, which is not the substrate for pyranose oxidase (4). Other oxidases and dehydrogenases that oxidize 1,5-AG have been found in several microorganisms (3, 7, 8, 15). Oxidases derived from Pseudomonas sp. strain NK-8500, Pycnoporus coccineus, and Coriolus consors exhibit activity with some other sugars and sugar alcohols, such as glucose, galactose, mannitol, and xylitol, in addition to 1,5-AG (7). Dehydrogenases that react with 1,5-AG have been found in Agrobacterium sp. (3), Eupenicillium crustaceum, Hansenula california (8), and Cytophaga marinoflava (15). These enzymes, however, oxidize some other sugars and sugar alcohols, such as fructose, galactose, mannitol, and xylitol. The specificities are crucial for diagnostic use, because sugars and sugar alcohols which are substrates for the enzymes described above are present in abundance in blood.
In this study, we screened microorganisms from the soil for 1,5-AG-degrading activity that is highly specific for 1,5-AG to isolate a fungus, Trichoderma longibrachiatum strain 11-3.
MATERIALS AND METHODS
Chemicals.
1,5-AG was kindly provided by Arkray Co., Kyoto, Japan. Yeast extract and peptone were products of Nihon Pharmaceutical Co., Tokyo, Japan. Horseradish peroxidase was purchased from Sigma-Aldrich Japan K. K., Tokyo, Japan. Glucose oxidase was obtained from Toyobo Co., Osaka, Japan. DEAE-Toyopearl was a product of Tosoh Co., Tokyo, Japan. Phenyl-Sepharose and HiLoad 16/60 Superdex 200 pg were obtained from Amersham Biosciences K.K., Tokyo, Japan. All other chemicals were of analytical grade.
Screening for 1,5-AG-utilizing microorganisms.
The enrichment culture technique was used with a medium composed of 3 g of (NH4)2SO4, 1 g of K2HPO4, 1 g of NaH2PO4, 0.5 g of MgSO4 · 7H2O, 0.1 g of CaCl2 · 2H2O, 5 g of 1,5-AG, 1 ml of a vitamin mixture (see below), and 10 ml of a metal solution (see below) in 1,000 ml of distilled water (pH 5.5). The vitamin mixture contained 1 mg of thiamine-HCl, 2 mg of riboflavin, 2 mg of Ca pantothenate, 2 mg of pyridoxine-HCl, 0.1 mg of biotin, 1 mg of p-aminobenzoic acid, 2 mg of nicotinic acid, and 0.1 mg of folic acid in 100 ml of distilled water. The metal solution contained 11.7 g of MnSO4 · 3H2O, 2.2 g of ZnSO4 · 7H2O, 0.4 g of CuSO4 · 5H2O, 0.28 g of CoCl2 · 2H2O, 0.26 g of NaMoO4 · 2H2O, 0.4 g of H3BO3, and 0.06 g of KI in 1,000 ml of distilled water. A soil sample was added to 5 ml of the medium in a test tube and shaken (300 strokes per min) at 30°C for 2 days. Then 0.01 ml of the culture was transferred to fresh medium, and cultivation was continued under the same conditions. Pure cultures were obtained by the streak-plate technique with agar plates containing the same medium.
Detection of glucose in culture filtrate.
Glucose in the culture filtrate was detected by the glucose oxidase method. The assay mixture (total volume, 3 ml) contained 100 μmol of 2-(N-morpholino)ethanesulfonic acid, 4.5 μmol of 4-aminoantipyrine, 6.0 μmol of phenol, 6.0 U of horseradish peroxidase, 100 U of glucose oxidase, and 50 μl of sample (pH 5.7). The reaction mixture was incubated at 30°C for 30 min, and the absorbance was measured at 505 nm.
Resting cell reaction with 1,5-AG.
The reaction mixture for the resting cell reaction (total volume, 1 ml) contained 100 μmol of Tris-HCl (pH 8.0), 2 μmol of 1,5-AG, and 0.1 g (wet weight) of resting cells. The reaction was carried out at 30°C for 1 to 4 h with reciprocal shaking. The reaction mixture was put on a silica gel plate (20 by 20 cm; Merck KGaA, Darmstadt, Germany), and thin-layer chromatography (TLC) was carried out by using phenol-water (4:1, vol/vol) as the developing solvent. The spots were detected by spraying with 20% sulfuric acid.
Cultivation of the isolate.
The isolated fungus was cultivated at 28°C for 2 days in 7 liters of medium (pH 5.5) containing 40 g of glucose, 40 g of yeast extract, 24 g of NaNO3, 8 g of K2HPO4, 4 g of MgSO4 · 7H2O, and 0.8 g of CaCl2 · 2H2O (pH 5.5) by using a 10-liter jar fermentor (agitation, 500 rpm; aeration, 5.0 liters/min). Growth of the fungus was monitored by measuring wet mycelial weight after filtration on a glass filter.
Enzyme purification.
Of the SH reagents tested, dithiothreitol was the most effective in preventing enzyme inactivation and was always used in the buffer (50 mM Tris-HCl buffer [pH 8.0]) at a concentration of 2 mM unless otherwise stated. All purification procedures were carried out at 4°C.
(i) Step 1: preparation of cell extract.
Washed mycelia (100 g, wet weight) were suspended in 130 ml of 0.1 M Tris-HCl (pH 8.0) and disrupted in a glass bead mill (model 11079-S Biospec bead beater; Japan Lambda). The homogenate was centrifuged at 9,000 × g for 30 min at 4°C to remove unbroken cells and debris. The supernatant solution was used as the cell extract.
(ii) Step 2: ammonium sulfate fractionation.
To the cell extract, solid (NH4)2SO4 was added to 35% saturation with stirring, and the pH was adjusted to 7.0 with a 35% NH4OH solution. After the preparation stood for 1 h, the precipitate was separated by centrifugation at 16,000 × g for 30 min and discarded. Further (NH4)2SO4 fractionation was carried out in the similar way, and the precipitate obtained at 55% (NH4)2SO4 saturation was dissolved in the buffer. The enzyme solution was then dialyzed with the buffer for 18 h.
(iii) Step 3: DEAE-Toyopearl column chromatography.
The dialyzed solution was applied to a DEAE-Toyopearl column (diameter, 2.2 cm; length, 20 cm) equilibrated with the buffer. The absorbed protein was eluted with a linear gradient of KCl (0 to 0.5 M). Active fractions were collected and dialyzed with the buffer containing (NH4)2SO4 at 55% saturation.
(iv) Step 4: phenyl-Sepharose column chromatography.
The dialyzed solution was loaded on a phenyl-Sepharose column (diameter, 1.0 cm; length, 10 cm) equilibrated with the same buffer. After washing with the same buffer, the enzyme solution was eluted with a linear gradient of (NH4)2SO4 (55 to 0% saturation) at a flow rate of 1 ml/min.
Protein assay.
The molecular mass of the purified enzyme was determined by gel filtration on a HiLoad 16/60 Superdex 200 pg column equilibrated with 0.1 M Tris-HCl buffer (pH 8.0) containing 2 mM dithiothreitol and 0.1 M NaCl. The molecular mass of the subunits was determined by sodium dodecyl sulfate (SDS)-polyacrylamide gel electrophoresis (PAGE) by the method of Laemmli (6) with a 10% polyacrylamide gel (8 by 9 cm; thickness, 1 mm). Protein was stained with Coomassie brilliant blue R-250. The amount of protein was determined by the method of Bradford (2) with a protein assay kit (Bio-Rad Laboratories, Tokyo, Japan) by using bovine serum albumin as the standard.
Enzyme assay.
NAD-dependent dehydrogenase activity was measured at 30°C by determining the increase in absorbance at 340 nm with a spectrophotometer (model U-3300; Hitachi Ltd., Tokyo, Japan). The reaction mixture (total volume, 3 ml) contained 100 μmol of Tris-HCl (pH 8.0), 15 μmol of substrate, and 5.0 μmol of NAD+. The activity was calculated by using an extinction coefficient of 6,220 M−1 · cm−1 for NADH. One unit of enzyme activity was defined as the amount of enzyme that catalyzed the formation of 1 μmol of NADH per min. Specific activity was expressed in units per milligram of protein. To examine the optimum temperature and pH of the enzyme reaction, the activities were measured at various temperatures and with various buffers at 30°C, respectively. To examine enzyme stability, 0.5 U of purified 1,5-AG dehydrogenase (AGH) was incubated with 0.1 M Tris-HCl (pH 8.0) at various temperatures or with various buffers, and the residual activities were measured under the standard conditions. The enzyme activities were also measured in the standard reaction mixture containing various metal ions or chemical inhibitors at a concentration of 1 mM; the only exception was p-chloromercuribenzoic acid, which was used at a concentration of 0.1 mM. Kinetic constants were calculated by constructing double-reciprocal plots of the initial velocity of the enzyme versus various substrate concentrations in the standard reaction mixture by using 0.5 U of the enzyme.
RESULTS
Screening to obtain an microorganism that converts 1,5-AG to glucose.
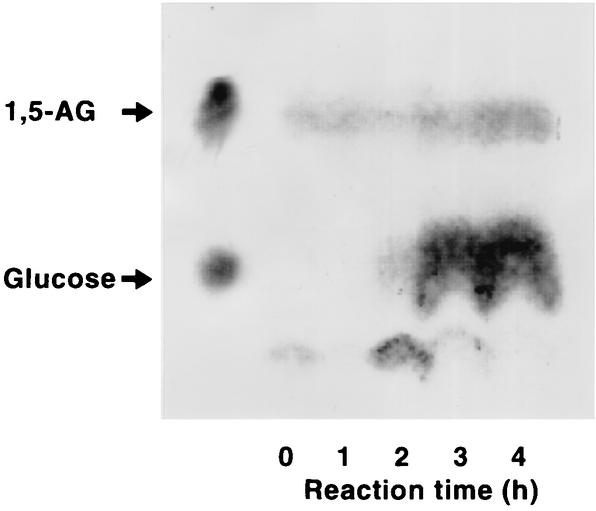
A total of 196 microorganisms that grew on 1,5-AG as the sole carbon source were isolated from 32 soil samples. These isolates included 73 fungi, 46 yeasts, and 77 bacteria. Since the oxidase reaction producing H2O2 is generally useful for enzymatic diagnosis, we first attempted to detect oxidase activity for 1,5-AG in cell extracts of the isolates using the peroxidase system. The oxidase activities detected were not specific for 1,5-AG and also exhibited activity with glucose and/or sugar alcohols. In a further attempt to obtain enzymes specific for 1,5-AG, we tried to select organisms which transform 1,5-AG into glucose without further consumption of glucose. The culture filtrates of 1,5-AG-utilizing microorganisms were subjected to the glucose oxidase assay to detect glucose after the microorganisms were cultivated on a medium containing 1,5-AG as the sole carbon source. As a result, glucose was detected in the culture filtrates of seven isolates, including two fungi. Then resting cell reactions were carried out with the isolates to detect glucose in the reaction mixtures by TLC. In this anaylsis, strain 11-3 was found to have activity that converted 1,5-AG into glucose (Fig. 1). In the resting cell reaction, the spot of 1,5-AG did not disappear but seemed to become more intense. A small decrease in the size of the 1,5-AG spot was observed after 2 h of reaction, and a glucose spot appeared; the glucose spot became strong after 3 h. Glucose was not observed in the reaction without 1,5-AG. Thus, the results suggested that some metabolite produced after the conversion of 1,5-AG to glucose showed the same migration as 1,5-AG.
FIG. 1.
Transformation of 1,5-AG to glucose by T. longibrachiatum strain 11-3. After a resting cell reaction for 4 h with 1,5-AG, the reaction mixtures were analyzed by TLC under the conditions described in the text. 1,5-AG and glucose (50 mg/ml) were used as standards.
Furthermore, enhanced reduction of NAD was observed when the cell extract was added to the reaction mixture with 1,5-AG, although conversion of 1,5-AG into glucose was not detected in the cell extract or in the membrane fraction of the fungus. This activity with 1,5-AG seemed to be an AGH activity and to be dependent on NAD. NADP was not effective under the same conditions.
Culture conditions for strain 11-3.
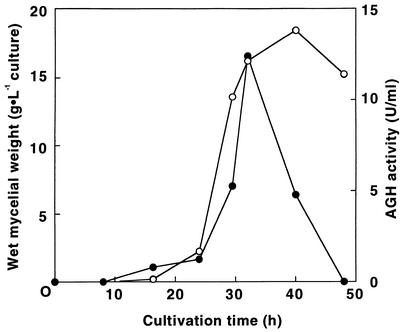
To facilitate large-scale production of AGH, glucose and glycerol, as well as 1,5-AG, were tested for enzyme productivity. After strain 11-3 was cultivated at 30°C for 2 days, the enzyme activity and the growth were measured. As shown in Table 1, the highest enzyme activity and the best growth were obtained when glucose was used. Strain 11-3 was cultivated at 28°C in 7 liters of medium which contained glucose and NaNO3 as carbon and nitrogen sources, respectively (Fig. 2). The growth and the enzyme activity increased until 40 h in the early stationary phase, when they reached the maximum values.
TABLE 1.
Effect of carbon source on the formation of AGH in T. longibrachiatum strain 11-3a
| Substrate(s) | Growth (g [wet wt] · liter−1) | AGH activity (U/mg) |
|---|---|---|
| 1,5-AG | 24 | 0.20 |
| Glucose | 30 | 0.22 |
| Glycerol | 28 | 0.14 |
| Glycerol + 1,5-AG | 36 | 0.15 |
T. longibrachiatum strain 11-3 was cultured with various carbon sources and (NH4)2SO4 as the nitrogen source at 30°C for 2 days.
FIG. 2.
Production of AGH by T. longibrachiatum strain 11-3. T. longibrachiatum strain 11-3 was cultivated at 28°C for 2 days with 7 liters of the medium described in the text by using a 15-liter jar fermentor. Symbols: ○, wet mycelial weight; •, AGH activity (in units per milliliter of extract).
Identification of strain 11-3.
Strain 11-3 was a filamentous fungus, and the colonies of this fungus were green after culture. Many phialoconidia were observed at the tops of branched phialides by microscopy, and the conidia formed lumps but not chains. From these observations, we speculated that strain 11-3 belongs to the genus Trichoderma. This fungus was definitively identified as Trichoderma longibrachiatum by Centraalbureau voor Shimmelcultures (Delft, The Netherlands).
Properties of AGH.
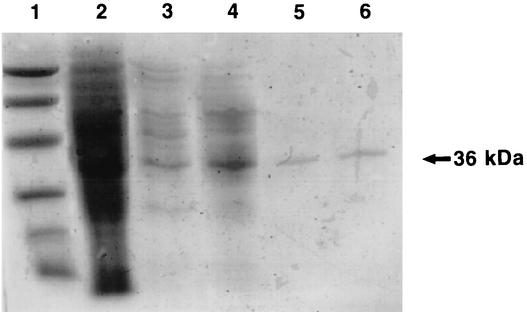
AGH was purified 18-fold from the cell extract (Table 2). The purified AGH had a specific activity of 3.3 U/mg of protein. The purified preparation produced a single band on SDS-PAGE gels, indicating the apparent homogeneity of the protein (Fig. 3).
TABLE 2.
Summary of purification of AGH from T. longibrachiatum strain 11-3
| Fraction | Total activity (u) | Total protein (mg) | Sp act (U · mg−1) | Purification (fold) | % Recovery |
|---|---|---|---|---|---|
| Cell extract | 51 | 280 | 0.18 | 100 | 1 |
| (NH4)2SO4 (35-55% saturation) | 47 | 123 | 0.38 | 94 | 2.1 |
| DEAE-Toyopearl | 19 | 11.3 | 1.7 | 37 | 9.3 |
| (NH4)2SO4 (0-55% saturation) | 19 | 7.36 | 2.6 | 37 | 14 |
| Phenyl-Sepharose | 5.3 | 2.84 | 1.9 | 10 | 10 |
| Superdex 200 | 2.6 | 0.79 | 3.3 | 5.1 | 18 |
FIG. 3.
SDS-PAGE patterns of AGH from T. longibrachiatum strain 11-3 after different purification steps. A sample obtained after each purification step was applied to a 10% polyacrylamide gel containing SDS. Lane 1, molecular mass markers, including phosphorylase b (94 kDa), bovine serum albumin (67 kDa), ovalbumin (43 kDa), carbonic anhydrase (30 kDa), soybean trypsin inhibitor (20.1 kDa), and α-lactalbumin (14.4 kDa); lane 2, cell extract of T. longibrachiatum strain 11-3; lane 3, preparation after ammonium sulfate precipitation; lane 4, preparation after DEAE-Toyopearl column chromatography; lane 5, preparation after phenyl-Sepharose chromatography; lane 6, preparation after Superdex 200 gel filtration.
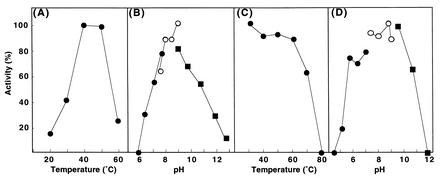
The relative molecular mass of the enzyme subunit was estimated to be 36 kDa by SDS-PAGE (Fig. 3). As gel filtration showed that the molecular mass of AGH was 141 kDa, the enzyme seemed to be a homotetramer. The optimum temperature and optimum pH of the enzyme were 40°C and 9.0, respectively (Fig. 4A and B). The enzyme was stable at temperatures up to 60°C, and 60% of the enzyme activity remained at 70°C. The enzyme activity was lost completely after incubation for 10 min at 80°C (Fig. 4C). The enzyme was stable at pH values ranging from 6 to 11 (Fig. 4D). The enzyme activity was completely inhibited by Mn2+, Fe3+, Ni2+, Ca2+, Ba2+, and Li+ and was partially inhibited by Mg2+, Cu2+, Zn2+, and Hg2+. Fe2+ activated the enzyme activity (about 2.7-fold). The enzyme was strongly inhibited by p-chloromercuribenzoic acid, 5,5′-dithiobis(2-nitrobenzoic acid), NaN3, and o-phenanthroline. These data suggested that the SH group and iron ion are involved in the enzyme reaction. AGH did not exhibit activity with glucose, sorbitol, xylitol, mannitol, glyceraldehyde 3-phosphate, and acetaldehyde (Table 3). There was a trace of activity with fructose, but it could not be measured definitely even if the amount of the enzyme and/or the amount of the substrate was increased. The enzyme activity with glyceraldehyde was 52% of that with 1,5-AG. The apparent Michaelis constants for 1,5-AG and NAD were determined to be 0.67 and 0.50 mM, respectively.
FIG. 4.
Effects of temperature and pH on the activity (A and B) and stability (C and D) of AGH. (B and D) Symbols: •, McIlvaine buffer; ○, Tris-HCl buffer; ▪, glycine-NaOH buffer.
TABLE 3.
Substrate specificity of AGH from T. longibrachiatum strain 11-3a
| Substrate | Relative activity (%) |
|---|---|
| 1,5-AG | 100 |
| d-Glucose | NDb |
| d-Fructose | ND |
| d-Sorbitol | ND |
| Xylitol | ND |
| d-Mannitol | ND |
| d-Glyceraldehyde 3-phosphate | ND |
| d-Glyceraldehyde | 52 |
| Acetaldehyde | ND |
The enzyme activity was measured with various substrates (3 mM) under the standard conditions.
ND, not detected.
Enzymatic measurement of 1,5-AG.
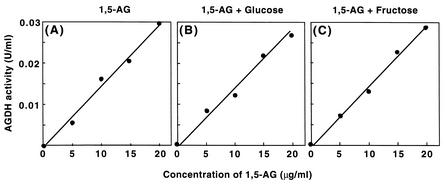
Enzymatic determination of the amount of 1,5-AG in samples was examined by using the purified AGH. The mean concentration of 1,5-AG in normal subjects is 2.5 ± 0.7 mg/dl, and the cutoff value for diabetic diagnosis has been proposed to be 1.4 mg/dl. AGH activities were measured with 1,5-AG at various concentrations around the cutoff value. As shown in Fig. 5A, a linear relationship between the concentration of 1,5-AG and the enzyme activity was observed. The relationship was unchanged when glucose or fructose was present (Fig. 5B and C).
FIG. 5.
Enzymatic measurement of 1,5-AG with AGH. (A) Enzyme activities measured at various concentrations of 1,5-AG under the standard conditions but with an excess amount of purified AGH (0.5 U). (B and C) Assay of 1,5-AG carried out in a similar way but with 110 mg of glucose per dl (B) or 0.56 mg of fructose per dl (C).
DISCUSSION
Enzymes which exhibit activity with 1,5-AG have been purified from various microorganisms and characterized (3, 7, 8, 15). However, almost all of these enzymes also exhibit activity with glucose. For example, the level of activity of pyranose oxidase from P. obtusus (7), which is the only commercial enzyme, with glucose is the same as the level of activity of this enzyme with 1,5-AG. Because 1,5-AG is structurally similar to glucose, selection for enzyme activity specific for 1,5-AG seems to be difficult. Thus, we tried to obtain microorganisms which transform 1,5-AG into glucose without further consumption of glucose.
AGH from T. longibrachiatum 11-3 was unique in its substrate specificity. This enzyme did not exhibit activity with any sugar other than 1,5-AG or with any sugar alcohol. The enzyme gained prominence because of its substrate specificity compared with the specificities of the other enzymes described so far. This characteristic of AGH is adequate for diagnostic application of the enzyme. In this study, a preliminary examination of enzymatic measurement of 1,5-AG was carried out. A linear relationship between the concentration of 1,5-AG and the enzyme activity was obtained by using reaction mixtures with an excess amount of purified AGH. It was possible that AGH exhibited activity with glucose in the serum sample because large amounts of glucose (50 times the amount of 1,5-AG) are present in blood serum. Thus, 1,5-AG samples containing 110 mg of glucose per dl, which is a border value for the serum glucose concentration for diabetes diagnosis, were used for the AGH assay. As a result, we found that the relationship did not change with or without glucose (Fig. 5B). The purified AGH also exhibited trace activity with fructose. Fructose is produced from ingested sucrose and then inverts to glucose, but the amount of fructose is not negligible (0.56 mg/dl in normal subjects). As shown in Fig. 5C, the presence of fructose at a physiological level did not affect the 1,5-AG determination with AGH (Fig. 5C). The activity with glyceraldehyde may not be an obstacle to practical use because glyceraldehyde is thought not to be present in serum. Furthermore, the enzyme activity remained after incubation at 70°C for 10 min and was stable after storage at 4°C for at least 6 months. These results suggested that AGH is a novel enzyme and is adequate for diagnosing diabetes mellitus.
1,5-AG is generally found in animals and plants. 1,5-AG in animals is produced from glucose and is ingested with food (20). However, its physiological role is unknown. Shiga et al. have reported that 1,5-AG is synthesized and phosphorylated in Escherichia coli C600. They have also shown that E. coli C600 synthesizes 1,5-AG when glucose is exhausted in the medium (12) and that E. coli takes 1,5-AG back from the medium and phosphorylates it to 1,5-AG 6-phosphate. These authors suggested that 1,5-AG and/or its phosphate may be a signal substance in cell-to-cell communication for bacterial growth (11). T. longibrachiatum strain 11-3 mycelia converted 1,5-AG into glucose in the resting cell reaction. AGH activity was detected after the fungus was cultivated on medium containing glucose as a carbon source and then immediately decreased in the stationary phase of the growth. These results suggest that AGH may also be an engaged signal for starvation for carbon sources in strain 11-3, as it is in E. coli C600.
REFERENCES
- 1.Akanuma, H., K. Ogawa, Y. Lee, and Y. Akanuma. 1981. Reduced levels of plasma 1,5-anhydroglucitol in diabetic patients. J. Biochem. 90:157-162. [DOI] [PubMed] [Google Scholar]
- 2.Bradford, M. M. 1976. A rapid and sensitive method for the quantitation of microgram quantities of protein utilizing the principle of protein-dye binding. Anal. Biochem. 72:248-254. [DOI] [PubMed] [Google Scholar]
- 3.Ebinuma, H., and K. Ushizawa. 1998. Japan patent 155479-A.
- 4.Fukumura, Y., S. Tajima, S. Oshitani, Y. Ushijima, I. Kobayashi, F. Hara, S. Yamamoto, and M. Yabuuchi. 1994. Fully enzymatic method for determining 1,5-anhydro-d-glucitol in serum. Clin. Chem. 40:2013-2016. [PubMed] [Google Scholar]
- 5.Kametani, S., Y. Hashimoto, T. Yamanouchi, Y. Akanuma, and H. Akanuma. 1987. Reduced renal reabsorption of 1,5-anhydro-d-glucitol in diabetic rats and mice. J. Biochem. 102:1599-1607. [DOI] [PubMed] [Google Scholar]
- 6.Laemmli, U. K. 1970. Cleavage of structural proteins during the assembly of the head of bacteriophage T4. Nature 227:680-685. [DOI] [PubMed] [Google Scholar]
- 7.Nakamura, K., H. Akanuma, A. Naito, A. Takahashi, S. Tanuma, T. Hashiba, and K. Kato. 1991. Japan patent 24200-B2.
- 8.Nishii, K., S. Sato, and K. Nakamura. 1990. Japan patent 268679-A.
- 9.Niwa, T., K. Tohyama, and Y. Kato. 1993. Analysis of polyols in uremic serum by liquid chromatography combined with atmospheric pressure chemical ionization mass spectrometry. J. Chromatogr. 613:9-14. [DOI] [PubMed] [Google Scholar]
- 10.Pitkanen, E. 1982. Serum 1,5-anhydroglucitol in normal subjects and in patients with insulin-dependent diabetes mellitus. Scand. J. Lab. Investig. 42:445-448. [DOI] [PubMed] [Google Scholar]
- 11.Shiga, Y., S. Kametani, H. Mizuno, and H. Akanuma. 1996. Escherichia coli phosphorylates 1,5-anhydroglucitol and releases 1,5-anhydroglucitol 6-phosphate when glucose is absent in the medium. J. Biochem. 119:173-179. [DOI] [PubMed] [Google Scholar]
- 12.Shiga, Y., H. Mizuno, and H. Akanuma. 1993. Conditional synthesis and utilization of 1,5-anhydroglucitol in Escherichia coli. J. Bacteriol. 175:7138-7141. [DOI] [PMC free article] [PubMed] [Google Scholar]
- 13.Tajima, S., M. Hashiba, T. Suzuki, H. Akanuma, and M. Yabuuchi. 1993. Determination of 1,5-anhydroglucitol in urine by high performance liquid chromatography and an enzyme sensor. Biomed. Chromatogr. 7:41-44. [DOI] [PubMed] [Google Scholar]
- 14.Tanaka, S., K. Nakamori, H. Akanuma, and M. Yabuuchi. 1992. High performance liquid chromatographic determination of 1,5-anhydroglucitol in human plasma for diagnosis of diabetes mellitus. Biomed. Chromatogr. 6:63-66. [DOI] [PubMed] [Google Scholar]
- 15.Tsugawa, W., S. Horiuchi, M. Tanaka, H. Wake, and K. Sode. 1996. Purification of a marine bacterial glucose dehydrogenase from Cytophaga marinoflava and its application for measurement of 1,5-anhydro-d-glucitol. Appl. Biochem. Biotechnol. 56:301-310. [DOI] [PubMed] [Google Scholar]
- 16.Yabuuchi, M., M. Masuda, K. Katoh, T. Nakamura, and H. Akanuma. 1989. Simple enzymatic method for determining 1,5-anhydro-d-glucitol in plasma for diagnosis of diabetes mellitus. Clin. Chem. 35:2039-2043. [PubMed] [Google Scholar]
- 17.Yamanouchi, T., H. Akanuma, T. Asano, C. Konishi, I. Akaoka, and Y. Akanuma. 1987. Reduction and recovery of plasma 1,5-anhydro-d-glucitol level in diabetes mellitus. Diabetes 36:709-715. [DOI] [PubMed] [Google Scholar]
- 18.Yamanouchi, T., H. Akanuma, T. Nakamura, I. Akaoka, and Y. Akanuma. 1988. Reduction of plasma 1,5-anhydroglucitol (1-deoxyglucose) concentration in diabetic patients. Diabetologia 31:41-45. [DOI] [PubMed] [Google Scholar]
- 19.Yamanouchi, T., I. Akaoka, Y. Akanuma, H. Akanuma, and H. Miyashita. 1990. Mechanism for acute reduction of 1,5-anhydroglucitol in rats treated with diabetogenic agents. Am. J. Physiol. 258:E423-E427. [DOI] [PubMed]
- 20.Yamanouchi, T., Y. Tachibana, H. Akanuma, S. Minoda, T. Shinohara, H. Moromizato, H. Miyashita, and I. Akaoka. 1992. Origin and disposal of 1,5-anhydroglucitol, a major polyol in the human body. Am. J. Physiol. 263:E268-E273. [DOI] [PubMed]
- 21.Yoshioka, S., S. Saitoh, T. Fujisawa, A. Fujimori, O. Takatani, and M. Funabashi. 1982. Identification and metabolic implication of 1-deoxyglucose (1,5-anhydroglucitol) in human plasma. Clin. Chem. 28:1283-1286. [PubMed] [Google Scholar]


