Abstract
Detection of RNA viruses by reverse transcription (RT)-PCR has proven to be a useful approach for the diagnosis of infections caused by many viral pathogens. However, adequate controls are required for each step of the RT-PCR protocol to ensure the accuracies of diagnostic test results. Heterologous competitor RNA can be used as a control for a number of different aspects of diagnostic RT-PCR. Competitor RNA can be applied to assessments of the efficiency of RNA recovery during extraction procedures, detection of endogenous RT-PCR inhibitors that could lead to false-negative results, and quantification of viral template in samples used for diagnosis; competitor RNA can also be used as a positive control for the RT-PCR. In the present study, heterologous competitor RNA was synthesized by a method that uses two long oligonucleotide primers containing primer binding sites for RT-PCR amplification of porcine reproductive and respiratory syndrome virus or West Nile virus. Amplification of the competitor RNA by RT-PCR resulted in a product that was easily distinguished from the amplification product of viral RNA by agarose gel electrophoresis. Assessment of a variety of RNA samples prepared from routine submissions to a veterinary diagnostic laboratory found that either partial or complete inhibition of the RT-PCR could be demonstrated for approximately 20% of the samples. When inhibition was detected, either dilution of the sample or RNA extraction by an alternative protocol proved successful in eliminating the source of inhibition.
Development of molecular diagnostic techniques has provided a valuable approach for the detection of a number of pathogens. However, as with any diagnostic technique, quality control of the steps involved is critical to ensure the accuracy of results. During the performance of a diagnostic reverse transcription (RT)-PCR, elimination of RNase enzymes (from both endogenous and exogenous sources) during RNA extraction and the subsequent amplification procedure is critical to the successful detection of viral RNA. In addition, a number of commonly encountered components of diagnostic laboratory samples have been reported to be PCR inhibitors (26). These include components of feces (16, 17), heme in blood (1), proteinases in milk (21), and urea in urine (11). The commonly encountered anticoagulant heparin also inhibits PCR (9). Clearly, failure to adequately detect problems with either RNase contamination or RT-PCR inhibitors may result in false-negative results for samples used in diagnostic tests.
Competitive quantitative RT-PCR is a rapid, sensitive method that has been widely used to assess gene expression levels (6, 7, 13, 19, 20, 23-25). In this method, an exogenous competitor RNA template (often termed a “mimic”) that contains the primer binding sites present in the target RNA, yet that is shorter in length, can be used as an internal competitor during RT and PCR amplification. Following RT-PCR amplification in the same reaction tube, the competitor RNA and target RNA yield amplification products of different lengths which are then resolved by agarose gel electrophoresis. The concentration of target RNA can be estimated by determining the amount of competitor RNA that produces an amplification product of equal intensity, provided that the size of the target amplification product is similar to that of the competitor RNA amplification product. Heterologous competitor RNA, in which only the sequences of the primer binding sites are identical to the sequence of the viral genome, has been shown to be equally as effective for use in quantitative RT-PCR assays as it is for use in other amplification-based approaches (8).
Several methods have been described for the preparation of competitor RNA. For example, competitor RNA can be prepared by restriction enzyme digestion of the cDNA product at two restriction endonuclease cleavage sites, which generates compatible ends; this is followed by religation (13). Although this approach is straightforward, synthesis of competitor RNA by this method requires cloning of template DNA into a plasmid vector and is dependent on the presence of two unique restriction endonuclease cleavage sites within the intervening sequence. Additionally, for this method the RNA polymerase promoter site must still be incorporated after the deletion is made, either through the addition of a 5′ extension to one of the oligonucleotide primers or through the inserting of the RNA polymerase promoter site into a plasmid vector that contains an RNA promoter. An additional method for competitor RNA synthesis uses an RNA ligase-mediated approach (3). However, this approach requires multiple (reiterative) PCRs, which add both time and complexity to the protocol. The production of “armored” RNA, in which RNA is encapsidated by bacteriophage coat proteins and thus protected from degradation by RNases, has also been shown to be a useful method of competitor RNA production (18). However, this method requires cloning of template DNA into a plasmid vector and cesium chloride gradient ultracentrifugation for purification of the encapsidated RNA.
In the study described in this report, heterologous competitor RNA molecules were synthesized by a rapid, flexible method that uses two long oligonucleotide primers containing multiple primer binding sites (2, 20). The usefulness of the competitor RNA is demonstrated for a number of important quality control aspects of routine diagnostic RT-PCR and quantitative 5′ exonuclease (TaqMan) RT-PCR assays. Most notably, RT-PCR inhibitors were detected in a variety of samples submitted for routine viral pathogen detection by a veterinary diagnostic laboratory.
MATERIALS AND METHODS
Oligonucleotide primers and PCR.
To amplify the DNA template for subsequent in vitro transcription, oligonucleotide primers specific for plasmid vector pUC19 were synthesized with 5′ extensions. The forward and reverse primers used for porcine reproductive and respiratory syndrome virus (PRRSV) competitor RNA template synthesis were 5′-CACGTAATACGACTCACTATAGGGTGAGCTGAATGGCACAGATTGGCTGGCTGTCTGTAAGCGGATGC-3′ and 5′-ACCTTTTGTGGAGCCGTGCTATCATGGCAATACAACGTCGTGACTGG-3′, respectively. The forward and reverse primers used for synthesis of the West Nile virus (WNV) competitor RNA template for use in a standard RT-PCR assay were 5′-CACGTAATACGACTCACTATAGGACCAACTACTGTGGAGTCGCATGTCTGTAAGCGGATGC-3′ and 5′-ACCTTTTTCCATCTTCACTCTACACTTCATACAACGTCGTGACTGG-3′, respectively. The forward and reverse primers used for synthesis of the WNV competitor RNA template for use in a 5′ exonuclease (TaqMan) RT-PCR assay were 5′-CACGTAATACGACTCACTATAGGTCAGCGATCTCTCCACCAAAGCTTCGCTATTACGCCAG-3′ and 5′-GTCTGGGTCAGCACGTTTGTCATTTACAACGTCGTGACTG-3′, respectively. For the forward primers, the T7 RNA polymerase promoter binding site is shown in italics. The pUC19-specific region of each primer is underlined, and the virus-specific region of each primer is shown in boldface. The sequences between the viral primer and plasmid primer or the T7 RNA polymerase promoter represent viral genomic sequences that flank the viral primer binding site. Amplification with pUC19 DNA as the template for PCR resulted in a 397-bp product for the PRRSV competitor RNA template, a 389-bp product for the traditional WNV RT-PCR competitor RNA template, or a 164-bp product for the real-time (TaqMan) WNV RT-PCR competitor RNA template.
For each primer pair, amplification was performed with each oligonucleotide primer at a final concentration of 0.6 μM with 1.0 U of HotStarTaq (Qiagen, Inc.) in the buffer of the manufacturer, which contained 1.5 mM MgCl2 and 0.2 mM (each) deoxynucleoside triphosphates in a final reaction volume of 25 μl, with thermocycling performed in a Perkin-Elmer 9700 thermocycler. Thermocycling conditions for the first round of amplification were 95°C for 12 min, followed by 10 cycles of denaturation (95°C, 30 s), annealing (68°C, 20 s), and extension (72°C, 45 s), with the annealing temperature in these cycles reduced by 1°C during each cycle. An additional 25 cycles of denaturation (95°C, 30 s), annealing (58°C, 20 s), and extension (72°C, 45 s) were performed, followed by a final extension at 72°C for 7 min. The amplification product (5 μl) was visualized in a 2% agarose-1× TAE (Tris-acetate-EDTA) gel by ethidium bromide staining and UV transillumination (22). Following PCR amplification, the reaction product was purified with a Qiaex II gel extraction kit (Qiagen, Inc., Valencia, Calif.) according to the instructions of the manufacturer.
In vitro transcription and RNA purification.
The purified PCR product generated by amplification from pUC19 DNA was used as the template for in vitro RNA transcription by using the AmpliCap T7 High Yield Message Maker kit (Epicentre, Inc., Madison, Wis.) according to the instructions of the manufacturer. The 20-μl (final volume) reaction mixture was incubated at 37°C for 2 to 3 h. Following in vitro transcription, 1 U of RNase-free DNase I was added and the reaction mixture was incubated for an additional 30 min at 37°C. Following DNase I digestion, the RNA transcribed in vitro was purified with RNeasy (Qiagen, Inc.) and eluted in 100 μl of RNase-free distilled H2O (dH2O). The concentration of the purified RNA was estimated by measuring the absorbance at 260 nm, and the purity was assessed by determining the ratio of the absorbance at 260 nm to the absorbance at 280 nm. Samples were considered to be relatively pure and suitable for subsequent use as competitor RNA if that ratio was ≥2.0. Following in vitro transcription, the RNA was serially diluted in RNase-free dH2O and stored as aliquots at −80°C. The number of molecules of competitor RNA per microliter was estimated on the basis of the RNA concentration and the molecular weight of the transcript.
RNA extraction.
Extraction of RNA from samples submitted for diagnostic assays was performed by using either Trizol (Invitrogen, Carlsbad, Calif.) or the Qiagen viral RNA kit (Qiagen, Inc.) according to the instructions of the manufacturers. Extractions of the purified competitor RNA were performed with the Qiagen viral RNA kit (Qiagen, Inc.). For the samples from which competitor RNA was extracted, the final elution volume was adjusted to the original sample volume.
Standard RT-PCR.
Amplification of 2 μl of RNA was performed with the One-step RT-PCR kit (Qiagen, Inc.) in a single tube for each sample with 0.5 μl of the One-step RT-PCR enzyme mixture in the buffer of the manufacturer, which contained 2.5 mM MgCl2 and 0.2 mM (each) deoxynucleoside triphosphates in a final reaction volume of 20 μl, with thermocycling performed in a Perkin-Elmer 9700 thermocycler. Thermocycling conditions were 50°C for 40 min and 95°C for 12 min, followed by 12 cycles of denaturation (95°C, 30 s), annealing (72°C, 30 s), and extension (72°C, 90 s), with the annealing temperature in these cycles reduced by 1°C during each cycle. An additional 38 cycles of denaturation (95°C, 30 s), annealing (60°C, 30 s), and extension (72°C, 90 s) were performed, followed by a final extension at 72°C for 7 min. The primers used for PRRSV amplification were 5′-AGCTGAATGGCACAGATTGG-3′ (forward primer) and 5′-TGTGGAGCCGTGCTATCAT-3′ (reverse primer) (11). These primers correspond to base pairs 13914 to 13933 (forward primer) and 14384 to 14402 (reverse primer) of prototype U.S. PRRSV isolate VR-2332 (GenBank accession number U87392), respectively. Each primer was used at a final concentration of 1.0 μM. Amplification of viral RNA produced a 489-bp fragment from the open reading frame 5 and 6 region of the PRRSV genome. Amplification of PRRSV competitor RNA produced a 365-bp fragment.
The primers used for WNV amplification were 5′-ACCAACTACTGTGGAGTC-3′ (forward primer) and 5′-TTCCATCTTCACTCTACACT-3′ (reverse primer), as previously reported by Johnson et al. (10). These primers correspond to base pairs 1401 to 1418 (forward primer) and 1826 to 1845 (reverse primer) of WNV strain NY99 (GenBank accession number AF196835), respectively. Each primer was used at a final concentration of 1.0 μM. The amplification reaction conditions were identical to those described for PRRSV RT-PCR amplification, except that the annealing temperature was reduced to 56°C. Amplification of viral RNA produced a 445-bp fragment from the envelope protein gene. Amplification of WNV competitor RNA produced a 360-bp fragment.
Quantitative (TaqMan) RT-PCR.
Amplification of 2 μl of RNA was performed with a QuantiTect Probe RT-PCR kit (Qiagen, Inc.), with thermocycling and detection performed in an Mx4000 instrument (Stratagene, Inc., La Jolla, Calif.). Samples were analyzed in triplicate. Thermocycling conditions were 50°C for 30 min and 95°C for 15 min, followed by 40 cycles of denaturation (94°C, 15 s) and annealing and extension (60°C, 60 s). The primers used for 5′ exonuclease (TaqMan) WNV amplification (15) were 5′-TCAGCGATCTCTCCACCAAAG-3′ (forward primer) and 5′-CTGGGTCAGCACGTTTGTCAT-3′ (reverse primer), with the reverse primer modified slightly from that reported by Lanciotti et al. (15). These primers correspond to base pairs 1160 to 1180 (forward primer) and 1211 to 1231 (reverse primer) of WNV strain NY99 (GenBank accession number AF196835), respectively. The forward primer was used at a final concentration of 0.2 μM, and the reverse primer was used at a final concentration of 0.4 μM. Amplification of viral RNA produced a 72-bp fragment from the envelope protein gene. Amplification of WNV competitor RNA produced a 129-bp fragment. The dual-labeled probe used for detection of WNV template was 5′-6-carboxyfluorescein-TGCCCGACCATGGGAGAAGCTC-BHQ1-3′ (whereBHQ1 is black hole quencher 1) (15). The dual-labeled probe used for heterologous WNV competitor template detection was 5′-HEX-TGTGCTGCAAGGCGATTAAGTTGGGT-BHQ2-3′ (where BHQ2 is black hole quencher 2 and HEX is hexachlorofluorescein). Probes were synthesized by Integrated DNA Technologies, Inc. (Coralville, Iowa), and each probe was used at a final concentration of 0.2 μM.
RESULTS
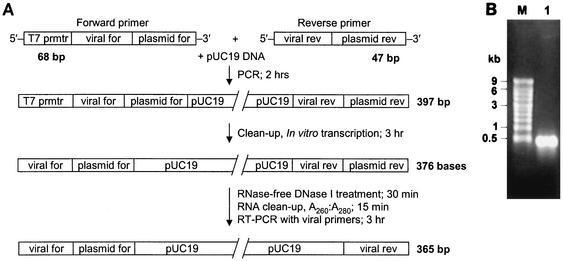
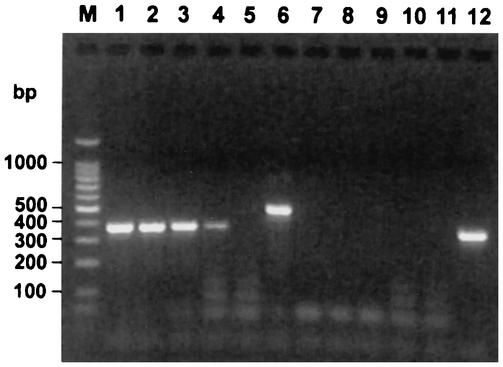
In vitro transcription by T7 RNA polymerase was performed by using a PCR amplification product as the template. This template was generated by using plasmid DNA and plasmid-specific oligonucleotide primers into which viral primer binding sites and a T7 RNA polymerase promoter site were incorporated as 5′ extensions (Fig. 1A). Following DNase I treatment and RNA purification, a single species of RNA was detected by denaturing agarose gel electrophoresis with ethidium bromide staining (Fig. 1B). A typical yield from a 20-μl in vitro transcription reaction mixture was 0.3 μg of RNA/μl, which is equivalent to approximately 1.4 × 10¹² molecules/μl for an RNA molecule 376 bases in length. Serial dilution of the RNA transcribed in vitro demonstrated that dilutions containing as few as 10 to 20 competitor molecules contained adequate template to produce a detectable product by agarose gel electrophoresis following RT-PCR (Fig. 2). Amplification of the PRRSV RNA mimic produced a product 124 bases smaller than that produced by amplification of viral RNA, and amplification of the WNV RNA mimic produced a product 85 bp smaller than that produced by amplification of viral RNA. A PCR in which the RT step was omitted did not produce a detectable product from the RNA transcribed in vitro, even when the sample contained ≥1,000-fold more template than that in the terminal dilution that was positive by RT-PCR (Fig. 2).
FIG. 1.
Method for preparation of in vitro-transcribed RNA containing PRRSV viral primer sequences. (A) Schematic of the relative oligonucleotide primer sequence positions, synthesis steps, and time required for each step. (B) Approximately 1 μg of in vitro-transcribed RNA (lane 1) following denaturing agarose gel electrophoresis with ethidium bromide staining. Lane M, RNA molecular size markers.
FIG. 2.
Detection of serial 10-fold dilutions of in vitro-transcribed RNA by PRRSV RT-PCR. RT-PCR (lanes 1 to 6) or PCR (lanes 7 to 12) was performed with serial dilutions of in vitro-transcribed RNA containing approximately 20,000 (lanes 1 and 7), 2,000 (lanes 2 and 8), 200 (lanes 3 and 9), or 20 (lanes 4 and 10) RNA molecules per μl. The results obtained following agarose gel electrophoresis are shown. The results for negative (no template added) controls are shown in lanes 5 and 11. The results for positive control reactions in which the template was PRRSV RNA (lane 6) and a previously amplified RNA mimic (lane 12) are also shown. Lane M, DNA molecular size markers.
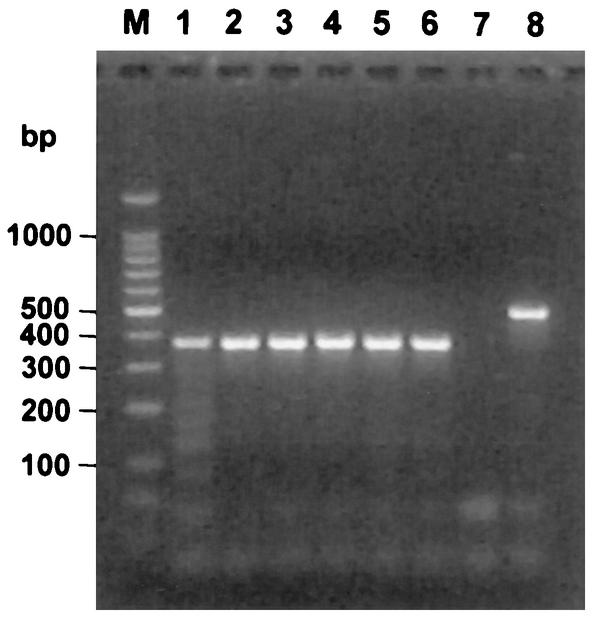
Serial dilutions of competitor RNA were extracted by a silica column-based method as a control for routine RNA extraction techniques (Fig. 3). Dilutions containing 50, 500, and 5,000 molecules/μl were extracted and eluted in a volume equivalent to that of the original sample. Following extraction of the competitor RNA, RT-PCR amplification demonstrated that a product was detectable at all dilutions, and only the sample containing 50 molecules/μl was observed to have a slight decrease in amplification product intensity.
FIG. 3.
Use of RNA mimics as extraction controls. PRRSV RT-PCR was performed with serial dilutions of in vitro-transcribed RNA either before (lanes 2, 4, and 6) or after (lanes 1, 3, and 5) column extraction of samples containing 50 (lanes 1 and 2), 500 (lanes 3 and 4), or 5,000 (lanes 5 and 6) RNA molecules per μl. Lanes 7 and 8, results for negative (no template) and positive (PRRSV RNA) control reactions, respectively; lane M, DNA molecular size markers.
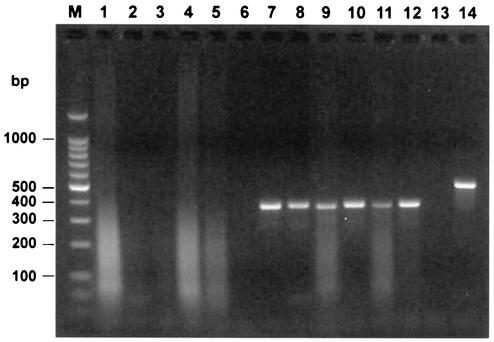
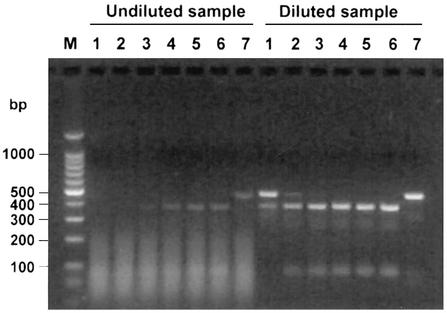
The proportion of RNA samples that contained endogenous inhibitors was assessed by adding approximately 100 molecules of competitor RNA to the RT-PCR mixture. Samples evaluated in this manner included RNA extracted from tissue (lung, lymph nodes, tonsil, and/or spleen tissue) pools, brain tissue, serum and whole blood. Analysis of 470 samples (Table 1) found that 14% of all samples partially inhibited the reaction and 6.6% of all samples completely inhibited the reaction. Over one-third of the samples that exhibited partial inhibition and nearly half of the samples that exhibited complete inhibition of competitor RNA amplification were part of a single accession of 61 serum samples that were tested for the presence of PRRSV. These samples were initially extracted with the reagent Trizol, and the resulting RNA demonstrated marked inhibition of PRRSV competitor RNA amplification. Aliquots of the original serum samples were extracted a second time by the same procedure (with Trizol), and the results were nearly identical (Fig. 4). Upon a third extraction of the original serum samples by a silica column-based method, the level of inhibition was reduced or eliminated for a majority of the samples. In a second example of sample inhibition, RNA extracted from a spleen sample was observed to completely inhibit amplification of 10, 100, and 1,000 molecules of WNV competitor RNA and to partially inhibit amplification when up to 106 molecules of competitor RNA were added to the sample RNA (Fig. 5). As a second approach used to reduce the effects of endogenous RT-PCR inhibitors, this RNA sample was diluted 1:20 with dH2O, and no inhibition was detected in the diluted sample.
TABLE 1.
Detection of RT-PCR inhibitors in diagnostic laboratory accessions
| Sample | No. (%) of samples
|
||
|---|---|---|---|
| Total | Partially inhibitedb | Completely inhibitedc | |
| Tissue poola | 91 | 13 (14.3) | 8 (8.8) |
| Brain | 28 | 8 (28.6) | 1 (3.6) |
| Serum (accession A) | 173 | 16 (9.2) | 5 (2.9) |
| Serum (accession B) | 61 | 23 (37.7) | 14 (23.0) |
| Whole blood | 117 | 6 (5.1) | 3 (2.6) |
| Total | 470 | 66 (14.0) | 31 (6.6) |
A combination of lung, lymph nodes, tonsil, and/or spleen tissue.
Partial inhibition was defined as a markedly reduced intensity of the competitor RNA RT-PCR product following agarose gel electrophoresis when 100 copies of competitor RNA were added to the reaction mixture.
Complete inhibition was defined as the absence of the competitor RT-PCR product following agarose gel electrophoresis when 100 copies of competitor RNA were added to the reaction mixture.
FIG. 4.
Detection of endogenous RT-PCR inhibitors in samples submitted for diagnostic assays. Prior to PRRSV RT-PCR, 100 molecules of competitor RNA were added to RNA extracted from six swine serum samples. The results of PRRSV RT-PCR following agarose gel electrophoresis for samples from which viral RNA was extracted with Trizol (lanes 1 to 6) or Qiagen (lanes 7 to 12) columns are shown. The results for negative (no template) and positive (PRRSV RNA) control reactions are shown in lanes 13 and 14, respectively. Lane M, DNA molecular size markers.
FIG. 5.
Detection of endogenous RT-PCR inhibitors in a sample used for diagnosis. Prior to WNV RT-PCR, serial dilutions of competitor RNA were added to undiluted and diluted (1:20) RNA extracted from a spleen sample. The results of RT-PCR following agarose gel electrophoresis are shown. Lanes 1 to 7, 10, 100, 1,000, 10,000, 100,000, 1,000,000, and 0 molecules of competitor RNA, respectively; lane M, DNA molecular size markers.
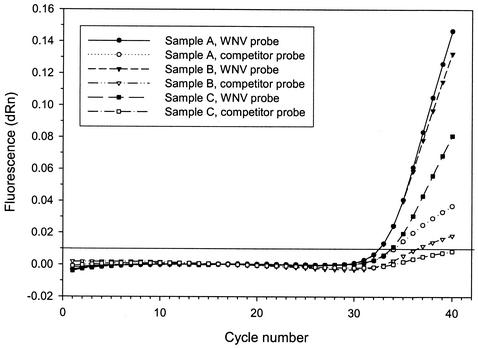
Heterologous competitor RNA was synthesized for use in a 5′ exonuclease (TaqMan) RT-PCR assay for the detection of WNV. In this assay two probes, one for detection of the WNV RNA amplification products and one for detection of the heterologous WNV competitor RNA amplification products, were added to each reaction mixture. Addition of equal amounts (approximately 20 copies) of competitor RNA resulted in the detection of various levels of endogenous inhibition in brain tissue collected from horses infected with WNV (Fig. 6). While all three samples were positive for WNV RNA, only sample A demonstrated a cycle threshold for the competitor RNA that was equivalent to that for control reactions which contained no sample RNA. For samples B and C, the WNV competitor RNA template demonstrated an increase in the cycle threshold, indicating decreased levels of amplification of that target.
FIG. 6.
Detection of endogenous RT-PCR inhibitors in samples used for diagnosis analyzed by 5′ exonuclease (TaqMan) RT-PCR. Two dual-labeled probes, one for detection of the WNV RNA amplification product and one for detection of the heterologous competitor RNA amplification product, were included in each reaction mixture. Amplification was performed with reaction mixtures to which 20 copies of competitor RNA were added to each mixture. The horizontal line at 0.01 fluorescence units indicates the threshold for a positive reaction. dRn, baseline-corrected normalized fluorescence.
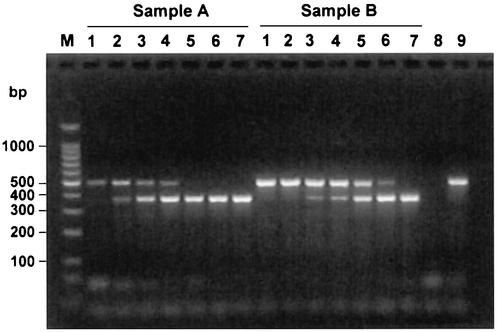
To estimate the quantity of viral RNA in a sample, a constant amount of RNA extracted from swine serum was amplified in the presence of 10, 50, 100, 500, 1,000, or 5,000 molecules of PRRSV competitor RNA (Fig. 7). Both samples were positive for PRRSV, as determined by virus isolation (12). However, sample A was estimated to have 10 to 50 copies of viral RNA per 2 μl, while sample B was estimated to have 100 to 500 copies of viral RNA per 2 μl. Thus, sample A had 10- to 50-fold less viral RNA than sample B. To assess the accuracies of the RNA concentration estimates by an independent procedure, the results obtained for heterologous competitor RNA by a standard WNV RT-PCR assay were compared to those obtained by a quantitative 5′ exonuclease (TaqMan) RT-PCR assay for WNV (Table 2). In general, the concentration estimates obtained by using heterologous competitor RNA in a traditional RT-PCR assay were in agreement with those obtained by quantification by the more precise 5′ exonuclease (TaqMan) RT-PCR assay.
FIG. 7.
Quantification of PRRSV RNA in serum samples. Prior to RT-PCR, dilutions of the competitor RNA were added to RNA extracted from serum from PRRSV-infected pigs. Equal amounts of RNA purified from serum were mixed with increasing amounts of competitor RNA. The results of RT-PCR following agarose gel electrophoresis are shown. Lanes 1 to 7, 0, 10, 50, 100, 500, 1,000, and 5,000 molecules of competitor RNA, respectively; lanes 8 and 9, results for negative (no template) and positive (PRRSV RNA) control reactions, respectively; lane M, DNA molecular size markers.
TABLE 2.
Comparison of quantification using heterologous competitor RNA in by WNV RT-PCR and real-time RT-PCR assays with equine samples
| Sample | Estimated concna by:
|
|
|---|---|---|
| RT-PCR | Real-time RT-PCR | |
| Brain | 2000-20,000 | 8,652 |
| Brain | 20-200 | 50 |
| Brain | ≥20,000 | 29,801 |
| Whole blood | 2-20 | 9 |
| Whole blood | 20-200 | 68 |
| Whole blood | 20-200 | 10 |
Number of viral RNA copies per 2 μl of purified RNA.
DISCUSSION
Competitor RNA was synthesized in vitro from DNA template that was generated by long oligonucleotide primers into which PRRSV or WNV viral RT-PCR primer binding sites were incorporated as 5′ extensions. This process was achieved in approximately 1 day in a minimal number of steps by standard techniques and with commercially available reagents. In this study, RT-PCR amplification of the competitor RNA resulted in a product smaller than that amplified from the PRRSV or WNV viral RNA template, although the method used for competitor RNA synthesis could generate a template of essentially any size, either larger or smaller than the viral RNA amplification product. Visualization of the RNA transcribed in vitro by denaturing agarose gel electrophoresis demonstrated that a relatively pure preparation of the expected size of RNA had been generated. Only RNA preparations with A260:A280 ratios ≥2.0 were used as competitor RNA. Thus, the purity of competitor RNA allowed a reasonably accurate estimation of the concentration of RNA molecules by spectrophotometry. Lack of an amplification product when the RT step was omitted further demonstrated that RNA had been synthesized and that the DNA template was adequately degraded through DNase I digestion.
Competitor RNA transcribed in vitro can be used for several applications in diagnostic RT-PCR. Use of competitor RNA as an extraction control allows the rapid, comprehensive assessment of both the RNA recovery efficiency and the exclusion of RNase enzymes (e.g., through contamination) from the extraction procedure. Additionally, competitor RNA can serve as a positive control template for validation and use of RT-PCR assays. When competitor RNA is used as a positive control, false-positive reactions caused by cross-contamination with the positive control sample are readily identified due to the different size of the amplicon generated from the competitor RNA. The methodology used in this study resulted in the synthesis of very large amounts of RNA, which, if aliquoted and stored at −80°C, can provide a long-term source of positive control RNA. Furthermore, this positive control template can be obtained without the need for in vitro cultivation of viral stocks. This can be particularly important for assays for the detection of pathogens that require high levels of biocontainment for in vitro cultivation, such as pathogens for which biosafety level 3 facilities are required (e.g., WNV) or pathogens that cause highly contagious and reportable animal diseases such as foot-and-mouth disease virus or classical swine fever virus. Competitor RNA can also be particularly useful as a positive control template for pathogens that are difficult to cultivate and quantify in vitro, such as hepatitis C virus. As veterinary diagnostic laboratories are beginning to adopt the real-time PCR methodology, one additional potential advantage of heterologous competitor RNA is that universal probes for use in real-time RT-PCR could be designed to detect the plasmid sequence that is internal to the viral primer binding sites. Thus, a single probe could serve as an internal standard for a wide variety of viral real-time RT-PCR or PCR assays in systems that can detect more than one molecule in a single sample (e.g., multiplex systems).
Since the analytical and diagnostic sensitivities of RT-PCR often surpass those of other techniques such as virus isolation and antigen-based enzyme-lined immunosorbent assays, detection of false-negative results due to the presence of endogenous inhibitors in RNA samples is without question an important quality control measure. A broad range of tissues and samples have been reported to contain endogenous inhibitors of PCR or RT-PCR (1, 9, 11, 16, 17, 21, 26). Furthermore, semen is commonly tested for PRRSV by RT-PCR, and semen is also suspected to be inhibitory to RT-PCR or PCR on the basis of evaluations of assays for the detection of human immunodeficiency virus and other pathogens such as bovine viral diarrhea virus, Chlamydia trachomatis, and papillomavirus (4, 5, 14). In addition to the known inhibitors of RT-PCR, common conditions such as advanced autolysis and fecal contamination of tissue samples may place veterinary diagnostic assays at particular risk of complications due to the presence of endogenous inhibitors of RT-PCR. Additional sample degradation often occurs due to the necessity for most samples to be in transit for 1 to 2 days from the time of collection until their arrival at a veterinary diagnostic laboratory. The addition of relatively small amounts (10 to 100 copies) of competitor RNA to samples used for diagnosis allows the effective identification of samples containing endogenous inhibitors of RT-PCR, which could lead to false-negative results. Inhibitors of RT-PCR can be detected without the need to include additional primer sets in an RT-PCR or to run separate reactions for this purpose. The effectiveness of this approach was demonstrated for both traditional and 5′ exonuclease (TaqMan) RT-PCR assays. By using routine samples used for diagnosis, assessment of RNA from 470 tissue and serum samples demonstrated that 20% of the samples either partially or completely inhibited competitor RNA amplification when the RNA was included at levels that were 10-fold greater than the detectable limits of the assay. Interestingly, a single accession of 61 serum samples accounted for a large proportion of the samples identified to contain endogenous inhibitors in this study, suggesting that the prevalence of inhibition can vary markedly among samples and may depend more on the sample source than on the type of sample (e.g., serum versus whole blood) extracted. In a second example of marked inhibition, an individual sample was identified that prevented robust amplification of competitor template even when a very large number of RNA copies (e.g., 106) was present in the reaction. When inhibition was detected for the samples used for diagnosis in this study, the RNA sample either was diluted and then reamplified or alternative extraction procedures were performed.
In summary, a rapid method was used for the preparation of competitor RNA for diagnostic RT-PCR assays. The format of this method is flexible and allows the design of competitor RNA that will yield an RT-PCR product of any size. Use of competitor RNA provides unparalleled opportunities for assessment of RNA extraction procedures, detection of endogenous inhibitors of RT-PCR, and quantification of viral RNA.
Acknowledgments
I thank Sunny Jo Troxell and Jeffery C. Peters for dedicated and expert technical contributions.
REFERENCES
- 1.Akane, A., K. Matsubara, H. Nakamura, S. Takahashi, and K. Kimura. 1994. Identification of the heme compound copurified with deoxyribonucleic acid (DNA) from blood stains, a major inhibitor of polymerase chain reaction (PCR) amplification. J. Forensic Sci. 39:362-372. [PubMed] [Google Scholar]
- 2.Ballagi-Pordany, A., and S. Belak. 1996. The use of mimics as internal controls to avoid false negatives in diagnostic PCR. Mol. Cell. Probes 10:159-164. [DOI] [PubMed] [Google Scholar]
- 3.Borriello, F., and J. Lederer. 1995. Construction of quantitative RT-PCR mimics. BioTechniques 19:580-584. [PubMed] [Google Scholar]
- 4.Da Silva, N., R. Zardoya, G. Santurde, A. Solana, and J. M. Castro. 1995. Rapid and sensitive detection of the bovine viral diarrhea virus genome in semen. J. Virol. Methods 55:209-218. [DOI] [PubMed] [Google Scholar]
- 5.Dyer, J. R., B. L. Gilliam, J. J. Eron, L. Grosso, M. S. Cohen, and S. A. Fiscus. 1996. Quantitation of human immunodeficiency virus type 1 RNA in cell free seminal plasma: comparison of NASBA and Amplicor reverse transcription-PCR amplification and correlation with quantitative culture. J. Virol. Methods 60:161-170. [DOI] [PubMed] [Google Scholar]
- 6.Fille, M., J. D. Shanley, and J. Aslanzadeh. 1997. Quantitative RT-PCR using a PCR-generated competitive internal standard. BioTechniques 23:34-36. [DOI] [PubMed] [Google Scholar]
- 7.Freeman, W. M., S. J. Walker, and K. E. Vrana. 1999. Quantitative RT-PCR: pitfalls and potential. BioTechniques 26:112-125. [DOI] [PubMed] [Google Scholar]
- 8.Haberhausen, G., J. Pinsl, C.-C. Kuhn, and C. Markert-Hahn. 1998. Comparative study of different standardization concepts in quantitative competitive reverse transcription-PCR assay. J. Clin. Microbiol. 36:628-633. [DOI] [PMC free article] [PubMed] [Google Scholar]
- 9.Holodniy, M., S. Kim, D. Katzenstein, M. Konrad, E. Groves, and T. C. Merigan. 1991. Inhibition of human immunodeficiency virus gene amplification by heparin. J. Clin. Microbiol. 29:676-679. [DOI] [PMC free article] [PubMed] [Google Scholar]
- 10.Johnson, D. J., E. N. Ostlund, D. D. Pedersen, and B. J. Schmitt. 2001. Detection of North American West Nile virus in animal tissue by a reverse transcription-nested polymerase chain reaction assay. Emerg. Infect. Dis. 7:739-741. [DOI] [PMC free article] [PubMed] [Google Scholar]
- 11.Khan, G., H. O. Kangro, P. J. Coates, and R. B. Heath. 1991. Inhibitory effects of urine on the polymerase chain reaction for cytomegalovirus DNA. J. Clin. Pathol. 44:360-365. [DOI] [PMC free article] [PubMed] [Google Scholar]
- 12.Kleiboeker, S. B., J. R. Lehman, and T. J. Fangman. 2002. Concurrent use of reverse transcription-polymerase chain reaction testing of oropharyngeal scrapings and paired serological testing for detection of porcine reproductive and respiratory syndrome virus in sows. J. Swine Health Prod. 10:251-258. [Google Scholar]
- 13.Kozbor, D., E. Hyjek, R. Wiaderkiewicz, Z. Wang, M. Wang, and E. Loh. 1993. Competitor mRNA fragments for quantitation of cytokine specific transcripts in cell lysates. Mol. Immunol. 30:1-7. [DOI] [PubMed] [Google Scholar]
- 14.Labau, E., S. Henry, P. Bennet, P. Massip, and G. Chabanon. 1998. Direct diagnosis of Chlamydia trachomatis genital infections: culture or PCR? Pathol. Biol. (Paris) 46:813-818. [PubMed] [Google Scholar]
- 15.Lanciotti, R. S., A. J. Kerst, R. S. Nasci, M. S. Godsey, C. J. Mitchell, H. M. Savage, N. Komar, N. A. Panella, B. C. Allen, K. E. Volpe, B. S. Davis, and J. T. Roehrig. 2000. Rapid detection of West Nile virus from human clinical specimens, field-collected mosquitoes, and avian samples by a TaqMan reverse transcriptase-PCR assay. J. Clin. Microbiol. 38:4066-4071. [DOI] [PMC free article] [PubMed] [Google Scholar]
- 16.Lantz, P.-G., M. Matsson, T. Wadström, and P. Rådström. 1997. Removal of PCR inhibitors from human fecal samples through the use of an aqueous two-phase system for sample preparation prior to PCR. J. Microbiol. Methods 28:159-167. [Google Scholar]
- 17.Monteiro, L., D. Bonnemaison, A. Vekris, K. G. Petry, J. Bonnet, R. Vidal, J. Cabrita, and F. A. Megraud. 1997. Complex polysaccharides as PCR inhibitors in feces: Helicobacter pylori model. J. Clin. Microbiol. 35:995-998. [DOI] [PMC free article] [PubMed] [Google Scholar]
- 18.Pasloske, B. L., C. R. Walkerpeach, R. D. Obermoeller, M. Winkler, and D. B. DuBois. 1998. Armored RNA technology for production of ribonuclease-resistant viral RNA controls and standards. J. Clin. Microbiol. 36:3590-3594. [DOI] [PMC free article] [PubMed] [Google Scholar]
- 19.Piatak, M., Jr., L. Ka-Cheung, B. Williams, and J. D. Lifson. 1993. Quantitative competitive polymerase chain reaction for accurate quantitation of HIV DNA and RNA species. BioTechniques 14:70-81. [PubMed] [Google Scholar]
- 20.Platzer, C., G. Richter, K. Uberla, W. Muller, H. Blocker, T. Diamantstein, and T. Blankenstein. 1992. Analysis of cytokine mRNA levels in interleukin-4-transgenic mice by quantitative polymerase chain reaction. Eur. J. Immunol. 22:1179-1184. [DOI] [PubMed] [Google Scholar]
- 21.Powell, H. A., C. M. Gooding, S. D. Garrett, B. M. Lund, and R. A. McKee. 1994. Proteinase inhibition of the detection of Listeria monocytogenes in milk using the polymerase chain reaction. Lett. Appl. Microbiol. 18:59-61. [Google Scholar]
- 22.Sambrook, J., E. F. Fritsch, and T. Maniatis. 1989. Molecular cloning: a laboratory manual, 2nd ed. Cold Spring Harbor Laboratory Press, Cold Spring Harbor, N.Y.
- 23.Souaze, F., A. Ntodou-Thome, C. Y. Tran, W. Rostene, and P. Forgez. 1996. Quantitative RT-PCR: limits and accuracy. BioTechniques 21:280-285. [DOI] [PubMed] [Google Scholar]
- 24.Wang, A. M., M. V. Doyle, and D. F. Mark. 1989. Quantitation of mRNA by the polymerase chain reaction. Proc. Natl. Acad. Sci. USA 86:9717-9721. [DOI] [PMC free article] [PubMed] [Google Scholar]
- 25.Wang, W.-K., C.-N. Lee, C.-L. Kao, Y.-L. Lin, and C.-C. King. 2000. Quantitative competitive reverse transcription-PCR for quantification of dengue virus RNA. J. Clin. Microbiol. 38:3306-3310. [DOI] [PMC free article] [PubMed] [Google Scholar]
- 26.Wilson, I. G. 1997. Inhibition and facilitation of nucleic acid amplification. Appl. Environ. Microbiol. 63:3741-3751. [DOI] [PMC free article] [PubMed] [Google Scholar]


