

Abstract
Background
Women who live in disadvantaged circumstances in Canada exhibit dietary intakes below recommended levels, but their children often do not. One reason for this difference may be that mothers modify their own food intake to spare their children nutritional deprivation. The objective of our study was to document whether or not low-income lone mothers compromise their own diets to feed their children.
Methods
We studied 141 low-income lone mothers with at least 2 children under the age of 14 years who lived in Atlantic Canada. Women were identified through community organizations using a variety of recruitment strategies. The women were asked weekly for 1 month to recall their food intake over the previous 24 hours; they also reported their children's (n = 333) food intake. Mothers also completed a questionnaire about “food insecurity,” that is, a lack of access to adequate, nutritious food through socially acceptable means, during each interview.
Results
Household food insecurity was reported by 78% of mothers during the study month. Mothers' dietary intakes and the adequacy of intake were consistently poorer than their children's intake overall and over the course of a month. The difference in adequacy of intake between mothers and children widened from Time 1, when the family had the most money to purchase food, to Time 4, when the family had the least money. The children experienced some improvement in nutritional intake at Time 3, which was possibly related to food purchases for them associated with receipt of the Child Tax Benefit Credit or the Goods and Services Tax Credit.
Interpretation
Our study demonstrates that low-income lone mothers compromise their own nutritional intake in order to preserve the adequacy of their children's diets.
Poverty affects about 1 in 5 children in Canada,1,2 and 41% of all poor children live in households headed by single mothers.2 Social assistance rates across Canada are being frozen or reduced and are widely regarded as insufficient to meet basic needs.1,2,3,4 Food banks are complaining of increasing demand, particularly from women and children.5,6,7
Women with children who live in disadvantaged circumstances in Canada exhibit dietary intakes below recommended levels.8,9,10 The relation between disadvantage and poor dietary intake is not as clear, however, when children are the subject of inquiry. A study of 182 French-Canadian children in Montreal, aged 5–18 years, failed to reveal a clear association between dietary adequacy and socioeconomic factors.11 One reason for this difference may be that mothers modify their own food intake to spare their children nutritional deprivation. The 1994 National Longitudinal Survey of Children and Youth identified families that experienced child hunger to be 8 times more likely to be headed by a lone mother than families that did not experience hunger, and 34% of caregivers replied that they skipped meals or ate less when food was scarce compared with only 4.9% of their children.3 In a survey of a low-income Ontario community, which predominantly comprised families headed by single mothers, 52% of respondents said that they deprived themselves of food to feed their children.9
Several qualitative studies have also described how the food intake of mothers is compromised to feed their children.8,12,13,14 Although these data are compelling regarding the experience of maternal food insecurity, that is, a lack of access to adequate, nutritious food through socially acceptable means, they do not link women's reports of self- deprivation with quantitative measures of their dietary intake in relation to that of their children. The objective of our study was to document whether or not low-income lone mothers compromise their own dietary intake so that their children have an adequate food intake.
Methods
We chose to study low-income lone mothers who had at least 2 children under the age of 14 years and lived in Atlantic Canada. Subjects were characterized as having a low income if their annual household income was less than or equal to Statistics Canada's Low-Income Cut-Off for the provincial district or region.15 A sample size of 138 women was calculated to be sufficient to identify an absolute difference in energy intake of 120 kcal (502 kJ) between groups of subjects, with a power of 80% and a 2-tailed p value of less than 0.05. Based on the typical dietary intake of Nova Scotian women,16 120 kcal (502 kJ) represents an approximate 6% variation in daily food intake. Geographical sites within each Atlantic province were selected based on community size and ethnic characteristics. We sought about 15 participants per location through referrals from parent resource centres, public health units, community organizations and from subjects themselves who suggested the names of eligible friends or neighbours. Subjects were paid $20 for each interview.
Data were collected between February 1999 and February 2000 from 141 women who provided information about their 333 children. During the first interview, which was conducted in person, women answered sociodemographic questions about themselves and their children and responded to the Cornell–Radimer questionnaire as a measure of food insecurity and hunger experienced over the past year.13,17,18 They were also asked to recall their food intake for the past 24 hours on behalf of themselves and their children. In order to assess the impact of the cyclical pattern of income receipt on food intake by low-income families, mothers were subsequently interviewed weekly by telephone over a 1-month period (3 weekdays and 1 weekend day that were randomly selected but moved to the subsequent day if the mother was unavailable). These interviews also included the readministering of the food insecurity questionnaire, which was modified for the experiences of the past week. To account for food eaten away from home, whenever possible children were present during the interviews. The interviews were conducted by 2 registered dietitians trained in food intake assessment methodology.19 The study was approved by the Faculty of Health Professions Ethics Committee at Dalhousie University, Halifax, NS.
Data from the 24-hour food intake recalls were coded and entered into the FoodSmart Millennium Professional Edition nutrient analysis program (Sasquatch Software Corporation, Vancouver, BC) with extensive data quality checks. Women were asked to identify when they shopped relative to when they received income using a monthly calendar. From this, we constructed Time 1 (T1) for each family to be the first interview that was carried out after the time when the family had the most money to buy food. T1 may or may not have been the time of the face-to-face 24-hour food intake recall.
During the initial statistical review of nutrient intake, we checked for differences between the 2 dietitians and unfortunately identified a systematic inter-interviewer bias in which food intake recalls done by one dietitian (who had conducted 38.9% of the interviews) were consistently and significantly lower than those of the second dietitian. The most probable explanation for the underreporting of intake was failure to use probing questions to determine “the extras,” such as sauces, condiments, spreads and snacks, during the latter part of the study. After a thorough analysis,20 for these interviews only, we subsequently weighted the intake of mothers by a factor of 1.24 and the intake of children by a factor of 1.15. We also found that the diets of the 12 (8.5%) pregnant or lactating women among the subjects were significantly better than those of the other women (although their consumption of calcium, folate and iron remained below recommended levels); thus they were excluded from further dietary analyses.
Dietary intakes of micronutrients by mothers and children were evaluated for adequacy by comparison with Dietary Reference Intakes (DRIs).21,22,23,24,25 The DRIs differ from the Recommended Nutrient Intake26 formerly used by Health Canada to assess dietary intake in that they consist of a range of values (Estimated Average Requirement, Recommended Dietary Allowance, Adequate Intake, Tolerable Upper Intake Level) and the emphasis is on achieving optimum health, rather than the prevention of dietary deficiency, leading to much higher recommendations for dietary intake of folate, calcium, iron and vitamin C. The process of developing the DRIs is still in progress.
A weighted summary intake value was derived for each of the nutrients by averaging intake over the 4 periods for which food intake was recalled. The prevalence of dietary inadequacy for mothers and children was determined using the Estimated Average Requirement (EAR) cut-point method,27 whereby the summary intake values were log-transformed and adjusted to remove within-person variability (except for maternal iron, which was modelled as described by Tarasuk and Beaton10). The EAR is a daily nutrient intake value that is estimated to meet the requirement of half the healthy individuals in a group.
Weighted group mean intakes assessed at T1 through T4 were calculated for both mothers and children. Differences in the dietary intake of mothers relative to the children were examined using analysis of variance to compare the percent meeting or exceeding the Recommended Dietary Allowance (RDA) for selected nutrients. The RDA is the average daily dietary intake level that is sufficient to meet the nutrient requirement of nearly all healthy individuals in a group.22 The comparison was made at the summary level and for each of the 4 points in time. Because RDAs for children vary by age, all children's intakes were standardized per 1000 kcal (4184 kJ) so that different ages could be aggregated.
Results
The characteristics of the women in this study are described in Table 1. The mean age of the mothers was 29.3 (standard deviation [SD] 5.5, range 19–46) years. The mean age of the children was 5.6 (SD 3.7) years, with about equal numbers of boys and girls. The families had a mean number of 2.4 (SD 0.6) children. A total of 333 children participated in the study; 30 (9.0%) were aged less than 1 year, 82 (24.6%) were aged 1–3 years, 147 (44.1%) were aged 4–8 years and 74 (22.2%) were aged 9–14 years. These age categories correspond to those established by the DRI process to represent physiological development of children in relation to nutritional needs.
Table 1
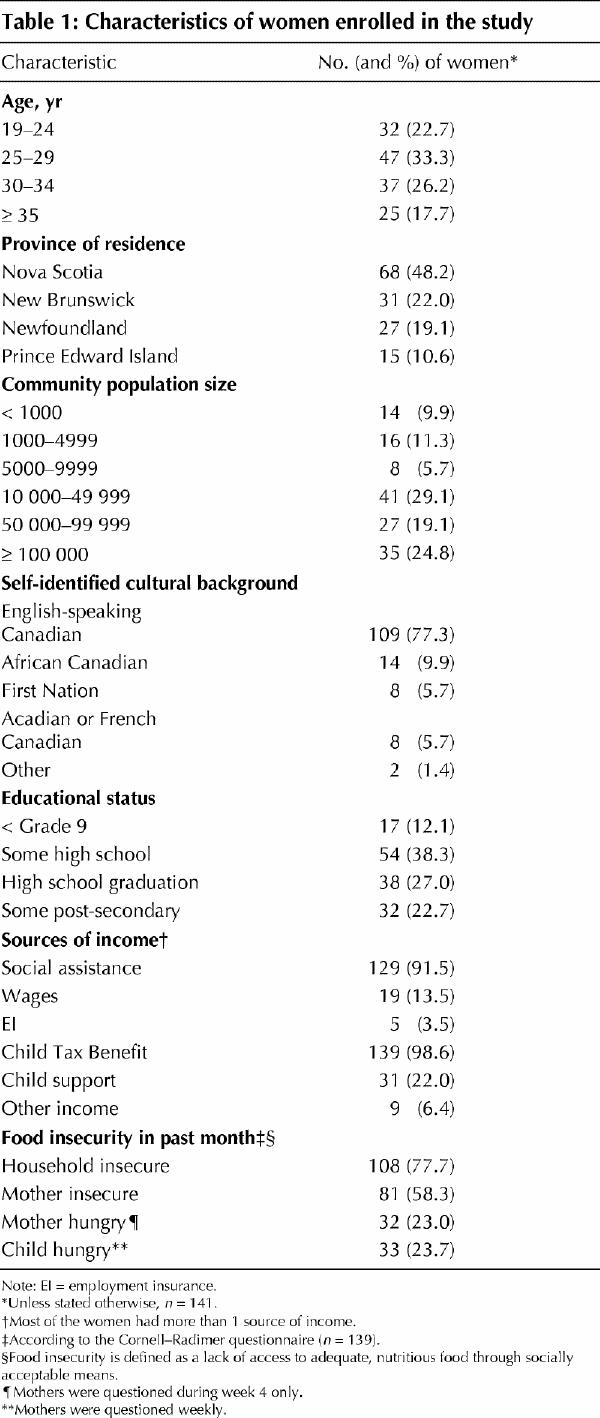
Given that this was a study of low-income women, not surprisingly, social assistance (welfare) was the main source of income for 123 (87.2%) of the women. Over 80% of the women had received free food over the past year from a mean of 2.1 (SD 1.5) sources, most commonly from a food bank (54.6%) and relatives (42.6%). Over three-quarters of households experienced food insecurity. A detailed analysis of the food insecurity of the sample is published elsewhere,28 and an analysis of the quality of the diets consumed by the mothers and their children is being published separately.
The mean energy intake of mothers was 1739 (SD 631) kcal/d (7276 kJ/d). On average, women consumed 15.5% (SD 3.2%) of energy as protein, 50.1% (SD 8.1%) of energy as carbohydrates and 35.0% (SD 7.0%) of energy as fat. The mean energy intake for children was 1873 (SD 627) kcal/d (7837 kJ/d), with 13.2% (SD 2.8%) of energy as protein, 55.0% (SD 6.6%) of energy as carbohydrates and 33.2% (SD 5.8) of energy as fat. Estimated mean daily intakes, EAR values and prevalence of inadequacy of selected nutrients for mothers and their children are presented in Table 2. When compared with the EAR, for every nutrient, more mothers than children had inadequate dietary intake. Although dietary intake by children was adequate for the most part, intakes of folate and zinc were most likely to be compromised. We found that the dietary intake of children for each constituent nutrient was consistently and significantly (p < 0.007 to p < 0.001) better than that of the mothers at each point in time during the month. As shown in Fig. 1, energy intake by mothers declined after T1 and remained low for the rest of the month. Energy intake by children also declined after T1, but the slope of the decrease was less than that of mothers and there was a rebound at T3 (corresponding to mid-month income such as the Child Tax Benefit or Goods and Services Tax Credit) that was not apparent for maternal intake. Fig. 1 demonstrates the types of linear trends observed for intake of selected nutrients by mothers and their children. Although a clear visual trend was seen in the reduction of nutrient consumption of mothers from T1 to T4, the longitudinal analysis over 4 points in time failed to reveal any significant linear trends in consumption of either macronutrients or micronutrients. In contrast, trends were significant for the reduction of nutrient consumption among children for thiamin, riboflavin, vitamin A, phosphorus and zinc (not all data shown). Riboflavin, calcium and vitamins A and C showed a “T3 effect,” leading to improved nutritional intake among children (not all data shown).
Table 2
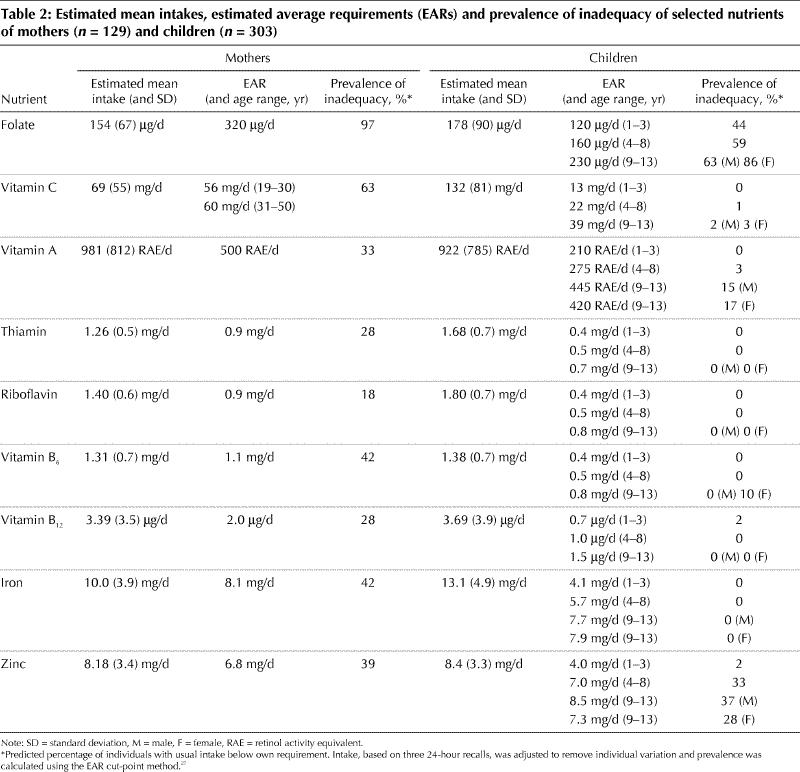
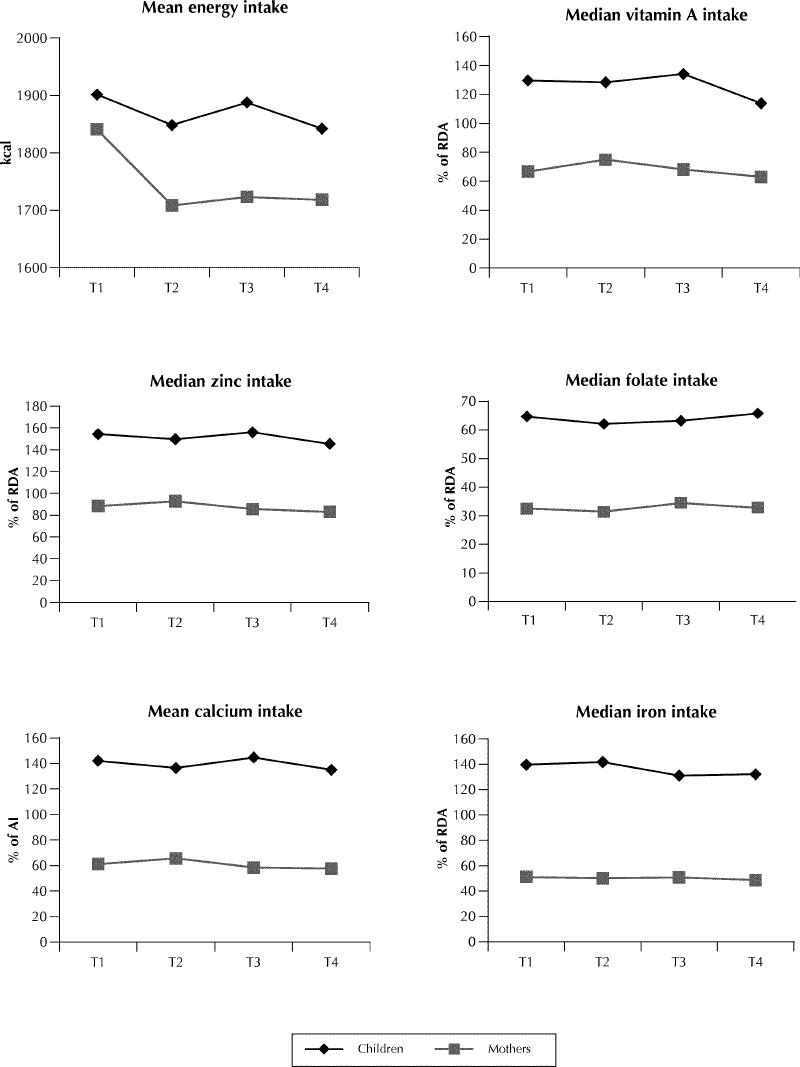
Fig. 1: Mean energy intake and selected nutrient intakes of mothers and children over 4 weeks from Time 1 (T1), when the family had the most money to purchase food, to Time 4 (T4), when the family had the least money. RDA = Recommended Dietary Allowance, AI = Adequate Intake.
Interpretation
The families in our study had very limited financial resources, which affected their ability to purchase food. Their use of food banks was higher than the one-third of families that experienced hunger and reported food bank use in the National Longitudinal Survey of Children and Youth.3 Mothers' intakes failed to meet their requirements for total kilocalories and a number of essential nutrients. In contrast, their children's intakes were consistently more adequate, except for folate and zinc. These findings support the hypothesis that mothers compromise their own diets to feed their children. The mean monthly energy reduction among the women amounted to 133 kcal (556 kJ), which would not lead to noticeable weight decrease over a short period of time especially when balanced with variations in energy expenditure.
Mean energy intake by mothers in this study was less than that reported by a representative sample of women in the Saskatchewan Nutrition Survey (1949 kcal/d [8155 kJ/d] for women aged 18–34 years),29 similar to that of women in the Nova Scotia Nutrition Survey (1721 kcal/d [7201 kJ/d] for women aged 18–34 years)16 and higher than the estimated usual intake of food-insecure women living in Toronto (1616 kcal/d [SD 799 kcal/d] or 6761 kJ/d) reported by Tarasuk and Beaton,10 all measured using a standard 24-hour recall method.30,31,32
Underreporting can be a problem with self-reported dietary intake, particularly for women, and appears to vary inversely with socioeconomic status.33 However, the mothers who participated in our study were very committed to the project and, because they took some degree of pride in the coping strategies they had developed, there is no reason to suspect they would deliberately misrepresent their food consumption. The different patterns of nutrient intake of mothers and children could be the result of mothers' underreporting their own intake while overreporting that of their children. Such a situation could arise if mothers perceived that it would reflect badly on them as caregivers if they were not providing enough food to their children. Alternatively, mothers may be more aware of the food they provide to their children than they are of their own consumption. Eck and colleagues noted that comparing the recollections of mother, father and child produced a better estimate of a child's intake than the recollections of either parent alone.34 To reduce reporting bias, children were present at the interviews whenever possible, so that the assessment of intake was by consensus of mother and child, with cross-checks.
Although a clear visual trend was seen in the reduction in dietary nutrient consumption among the mothers from T1 to T4, these results were not significant. It may be that our interview dates were not precise enough to identify the so-called plentiful and lean times of the month, or that food already present in the house buffered some of the impact of limited purchasing power during the month. It may also be that intake is so chronically poor among the mothers that there is little variation in their diets over the month. It is also possible that intra-individual variability has obscured true differences in intake across time intervals.35
Whereas the intake of some nutrients by the children did decrease significantly at intervals over a 1-month period, nutrient intake averaged over the whole month generally exceeded recommendations for dietary adequacy. Again in contrast to the mothers, the children experienced some improvement in nutrient intake at T3, which corresponds to the second cheque of the month (usually the Child Tax Benefit or Goods and Services Tax Credit) in a fixed-income household. A similar trend was not apparent among mothers, suggesting that extra revenues available for food purchase are directed toward meeting the needs of the children, while the mother's nutritional needs continue to be compromised.
In conclusion, our results demonstrate that low-income lone mothers are compromising their own diets in order to preserve the healthier diets of their children. Although it may be that maternal self-deprivation of food is a socially acceptable practice, related to the gendered work of feeding the family36 and to the socialization of mothers who are taught to put their children's needs first,37 the implications for the nutritional health of women living in poverty are grave and go beyond the nutritional risks associated with their reproductive role.38,39 Increases in support payments and the accessibility and affordability of healthy food staples, such as milk and dairy products and fresh produce, are needed, as are creative, respectful and responsive strategies to help lone mothers become less dependent upon the social assistance system.
β See related article page 709
Acknowledgments
We thank the women who participated in this study, and we thank Gordon Walsh for statistical support.
Footnotes
This article has been peer reviewed.
Contributors: Dr. McIntyre was responsible for study design, supervision of data collection and analysis, and writing the manuscript. Dr. Glanville assisted with subcomponent design, data collection training, coding of dietary recall data and interpretation of dietary intake. Dr. Raine was responsible for study subcomponents and data interpretation. Dr. Dayle participated in study design and was the senior research associate for subcomponents of the study. She also contributed to data interpretation. Ms. Anderson coordinated the implementation of the study, added original methodological approaches, oversaw quality control of data entry and participated in nutrient intake interpretation. Ms. Battaglia participated in the design of the overall study, pilot-tested all instruments, provided advice on subject recruitment and retention, and assisted with data interpretation. All authors reviewed and commented on the revised manuscript.
This study was funded by National Health Research and Development Program grant no. 6603-1550-002 and Public Health Services, Capital District Health Authority, Halifax, NS.
Competing interests: None declared.
Correspondence to: Dr. Lynn McIntyre, Professor, Faculty of Health Professions, 3rd floor, 5968 College St., Burbidge Building, Dalhousie University, Halifax NS B3H 3J5; fax 902 494-1966; Lynn.McIntyre@dal.ca
References
- 1.Campaign 2000. Child poverty in Canada: report card 2000. Toronto: The Campaign; 2000. p. 1-18.
- 2.National Council of Welfare. Poverty profile 1998. Ottawa: The Council; 2000.
- 3.McIntyre L, Connor SK, Warren J. Child hunger in Canada: results of the 1994 National Longitudinal Survey of Children and Youth. CMAJ 2000;163 (8):961-5. [PMC free article] [PubMed]
- 4.GPI Atlantic. Income distribution in Nova Scotia. Halifax: GPI Atlantic; 2001. Available: www.gpiatlantic.org/ab_incdist.shtml (accessed 2003 Jan 17).
- 5.Chaudhuri N. Child health, poverty and the environment: the Canadian context. Can J Public Health 1998;89(1):S26-30. [PubMed]
- 6.Tarasuk V, Beaton G. Household food insecurity and hunger among families using food banks. Can J Public Health 1999;90(2):109-13. [DOI] [PMC free article] [PubMed]
- 7.Wilson B, Steinman C. HungerCount 2000: a surplus of hunger. Canada's annual survey of emergency food programs. Toronto: The Canadian Association of Food Banks; 2000. Available: www.icomm.ca/cafb/hunger_count.html (accessed 2003 Jan 17).
- 8.Campbell CC, Desjardins E. A model and research approach for studying the management of limited food resources by low-income families. J Nutr Educ 1989; 21: 162-71.
- 9.Badun C, Evers S, Hooper M. Food security and nutritional concerns of parents in an economically disadvantaged community. J Can Diet Assoc 1995; 56: 75-80.
- 10.Tarasuk V, Beaton G. Women's dietary intakes in the context of household food insecurity. J Nutr 1999;129:672-9. [DOI] [PubMed]
- 11.Shatenstein B, Ghadirian P. Nutrient patterns and nutritional adequacy among French-Canadian children in Montreal. J Am Coll Nutr 1996;15:264-72. [DOI] [PubMed]
- 12.Tarasuk V, Maclean H. The food problems of low-income single mothers: an ethnographic study. Can Home Econ J 1990;40:76-82.
- 13.Radimer KL, Olson CM, Greene JC, Campbell CC, Habicht JP. Understanding hunger and developing indicators to assess it in women and children. J Nutr Educ 1992;24:36S-45S
- 14.Travers K. The social organization of nutritional inequities. Soc Sci Med 1996; 43: 543-53. [DOI] [PubMed]
- 15.Incomes in Canada. Ottawa: Statistics Canada; 1998. Catalogue no 75-202-XIE.
- 16.Nova Scotia Heart Health Program, Nova Scotia Department of Health, and Health and Welfare Canada. Report of the Nova Scotia Nutrition Survey. Halifax: Nova Scotia Department of Health; 1993.
- 17.Kendall A, Olson CM, Frongillo EA Jr. Validation of the Radimer-Cornell measures of hunger and food insecurity. J Nutr 1995;125(11):2793-801. [DOI] [PubMed]
- 18.Leidenfrost NB, Wilkins JL, editors. Food security in the United States: a guidebook for public issues education. Washington: The Cooperative Extension System, US Department of Agriculture; 1994.
- 19.Nova Scotia Heart Health Program, Nova Scotia Department of Health, and Health and Welfare Canada. Nova Scotia Nutrition Survey Training Manual. Halifax: Nova Scotia Department of Health; 1991.
- 20.McIntyre L, Raine KD, Glanville NT, Dayle JB. Hungry mothers of barely fed children: a study of the diets and food experiences of low-income lone mothers in Atlantic Canada. Final report to CIHR/NHRDP. Halifax: CIHR/NHRDP; 2001.
- 21.Health and Welfare Canada. Nutrition recommendations. The Report of the Scientific Review Committee. Ottawa: Health and Welfare Canada; 1990.
- 22. Institute of Medicine. Dietary reference intakes: applications in dietary assessment. Washington: National Academy Press; 2000.
- 23.Institute of Medicine. Dietary reference intakes for calcium, phosphorous, magnesium, vitamin D and fluoride. Washington: National Academy Press; 1997. [PubMed]
- 24.Institute of Medicine. Dietary reference intakes for thiamin, riboflavin, niacin, vitamin B6, folate, vitamin B12, pantothenic acid, biotin, and choline. Washington: National Academy Press; 1998. [PubMed]
- 25.Institute of Medicine. Dietary reference intakes for vitamin C, vitamin E, selenium, and carotenoids. Washington: National Academy Press; 2000. [PubMed]
- 26.Institute of Medicine. Dietary reference intakes: vitamin A, vitamin K, arsenic, boron, chromium, copper, iodine, iron, manganese, molybdenum, nickel, silicon, vanadium, and zinc. Washington: National Academy Press; 2001. [PubMed]
- 27.National Academies Press. Using the estimated average requirement for nutrient assessment of groups. In: Dietary reference intakes: applications in dietary assessment. Washington: The National Academy of Sciences; 2000. p. 73-105. Available: http://books.nap.edu/books/0309071836/html/45.html#pagetop (accessed 2003 Jan 17).
- 28.McIntyre L, Glanville NT, Officer S, Anderson B, Raine KD, Dayle JB. Food insecurity of low-income lone mothers and their children in Atlantic Canada. Can J Public Health 2002;93(6):411-5. [DOI] [PMC free article] [PubMed]
- 29.University of Saskatchewan. Saskatchewan Nutrition Survey. Report of a survey in the province of Saskatchewan, 1993–94. Saskatoon (SK): University of Saskatchewan; 2001.
- 30.Gersovitz M, Madden JP, Smiciklas-Wright H. Validity of the 24-hour dietary recall and seven-day record for group comparisons. J Am Diet Assoc 1978; 73: 48-55. [PubMed]
- 31.Karvetti RL, Knuts LR. Validity of the 24-hour dietary recall. J Am Diet Assoc 1985;85:1437-42. [PubMed]
- 32.Posner BM, Borman CL, Morgan JL, Borden WS, Ohls JC. The validity of a telephone administered 24-hour dietary recall methodology. Am J Clin Nutr 1992;36(3):546-53. [DOI] [PubMed]
- 33.Carter LM, Whiting SJ. Underreporting of energy intake, socioeconomic status, and expression of nutrient intake. Nutr Rev 1998;56(6):179-82. [DOI] [PubMed]
- 34.Eck LH, Klesges RC, Hanson CL. Recall of a child's intake from one meal: Are parents accurate? J Am Diet Assoc 1989;89:784-9. [PubMed]
- 35.Tarasuk V, Beaton G. The nature and individuality of within-subject variation in energy intake. Am J Clin Nutr 1991;54:464-70. [DOI] [PubMed]
- 36.Devault M. Feeding the family. The social organization of caring as gendered work. Chicago: University of Chicago Press; 1991.
- 37.Fiene JI. The construction of self by rural low-status Appalachian women. Affilia 1991;6(2):45-60.
- 38.Strengthening prenatal health promotion for disadvantaged families. Ottawa: Health Canada; 1994.
- 39.Affenito SG, Kerstetter J. Women's health and nutrition. Position of Dietitians of Canada and the American Dietetic Association. Can J Diet Prac Res 1999;60:85-100. [PubMed]