Abstract
Hepatocyte growth factor/scatter factor (HGF/SF) is a paracrine growth factor which increases cellular motility and has also been implicated in tumor development and progression and in angiogenesis. Little is known about the metabolic alteration induced in cells following Met-HGF/SF signal transduction. The hypothesis that HGF/SF alters the energy metabolism of cancer cells was investigated in perfused DA3 murine mammary cancer cells by nuclear magnetic resonance (NMR) spectroscopy, oxygen and glucose consumption assays and confocal laser scanning microscopy (CLSM). 31P NMR demonstrated that HGF/SF induced remarkable alterations in phospholipid metabolites, and enhanced the rate of glucose phosphorylation (P < .05). 13C NMR measurements, using [13C1]-glucose-enriched medium, showed that HGS/SF reduced the steady state levels of glucose and elevated those of lactate (P < .05). In addition, HGF/SF treatment increased oxygen consumption from 0.58±0.02 to 0.71±0.03 µmol/hour per milligram protein (P < .05). However, it decreased CO2 levels, and attenuated pH decrease. The mechanisms of these unexpected effects were delineated by CLSM, using NAD(P)H fluorescence measurements, which showed that HGF/SF increased the oxidation of the mitochondrial NAD system. We propose that concomitant with induction of ruffling, HGF/SF enhances both the glycolytic and oxidative phosphorylation pathways of energy production.
Keywords: HGF/SF, NMR, oxidative phosphorylation, glycolysis
Introduction
Hepatocyte growth factor/scatter factor (HGF/SF) is a paracrine factor produced primarily by mesenchymal cells, which induces mitogenic and morphogenic changes [1]. The diverse biological effects of HGF/SF are all mediated by its receptor Met, which is preferentially expressed on epithelial cells [2]. In vivo, this receptor-ligand pair is essential for normal embryological development [3,4]. Null mutations in HGF/SF [4] and Met [5] are embryonically lethal. Met-HGF/SF signaling plays an important role in epithelial tissue morphogenesis and lumen formation [6,7]. HGF/SF has been shown to induce tubular branching of mammary cell lines in collagen gels [8,9] and to be involved in the development of mammary tubular structures in vivo [10]. While Met-HGF/SF signaling clearly plays a role in normal cellular processes, this signaling pathway has also been implicated in tumor development and progression.
Met-HGF/SF signaling promotes rapid membrane ruffling and formation of microspikes, increases cellular motility [11,12] and tumorigenicity [13] and enhances in vitro invasiveness [2,14–16] and in vivo metastasis [16–18]. In addition, Met-HGF/SF signaling can increase production of proteases [16] and urokinase [17] that are associated with extracellular matrix/basal membrane degradation and important for metastasis. HGF/SF is a potent angiogenic factor [19,20] that induces blood vessel formation in tumors originating from injection of human breast cancer cells into the mammary fat pads of nude mice [21].
HGF/SF-induced ruffling and mitogenicity are assumed to alter the energy metabolism of the cells. We have previously found that other growth factors and cytokines, such as EGF and TNF-α, induced remarkable increase in glucose utilization in human breast cancer cells [22,23]. These findings are in agreement with the increased energy requirements of the cells necessary for increased motility and mitogenicity following stimulation. Although extensive research has been conducted in order to characterize the signal transduction pathways leading to HGF/SF-induced biological effects, little knowledge was acquired regarding the metabolic alteration induced in the cells following Met signaling.
In the study presented here, we investigated the effects of HGF/SF on the energy metabolism of perfused DA3 murine mammary cancer cells by 31P and 13C nuclear magnetic resonance (NMR) spectroscopy, glucose and oxygen consumption assays, and confocal laser scanning microscopy (CLSM) analysis. The combined application of NMR and CLSM provides an excellent approach for studying biochemical processes in intact living cells and tissues in a continuous manner. Together, these methods can provide information on intracellular milieu and cellular metabolism of living cells, which is not typically attainable by other methods [24,25].
In this paper, we studied the metabolic effects of HGF/SF using NMR measurements of perfused DA3 cells at physiological conditions, traditional biochemical assays and CLSM analysis. The principal changes induced by HGF/SF were enhanced glucose utilization and glycolysis accompanied by increased oxygen consumption. However, these alterations were associated with decreased carbon dioxide accumulation and less intracellular acidification compared to the control perfusions. The mechanism and pathways of these effects were delineated by CLSM, which showed that HGF/SF activation also induced increased mitochondrial activity and activation of NAD(P)H fluorescence that measures mitochondrial dehydrogenases activation.
Materials and Methods
Materials
All chemicals were purchased from Sigma Chemical (St. Louis, MO) unless otherwise indicated, and were of highest available purity. HGF/SF was produced as previously described [26]. In all experiments where HGF/SF was applied, with the exception of the Western blot (WB) analysis, it was used at a concentration of 5x10⁻⁵ ng/cell.
Tumor Cells
D1-DMBA-3 is a cell line derived from a poorly differentiated mammary adenocarcinoma induced in BALB/C mice by dimethylbenzanthracene. Limiting dilution cloning produced the cell line designated DA3 [27]. DA3 cells were grown in Dulbecco's modified Eagle's medium (DMEM; Gibco BRL, Gaithersburg, MD) supplemented with 10% heat-inactivated fetal calf serum (FCS) (Gibco BRL), penicillin-streptomycin-nystatine (20 U/ml, 20 g/ml, 2.5 U/ml, respectively) and l-glutamine (2 mM), under 5% CO2 environment. The growth medium contained 11 mM glucose. For the NMR experiments, the cells were grown to approximately 90% confluence, harvested with 0.25% trypsin-0.05% EDTA, centrifuged at 4°C at 1000xg for 5 minutes, and washed twice with medium. The following antibodies were used: rabbit polyclonal SP260 anti-murine Met peptide antibody (Santa Cruz Biotechnology, Santa Cruz, CA) [28] andanti-phosphotyrosine 4G10 mAb (UBI, NY).
Immunoprecipitation (IP) and WB Analysis of Met and Met Tyrosine Phosphorylation
Near-confluent cells were treated with HGF/SF (1.25 ng/ml) for 5 minutes at room temperature. Cells were washed twice with cold PBS and lysed in 1 ml lysis buffer (20 mM Tris-HCl pH 7.8, 100 mM NaCl, 50 mM NaF, 1% NP40, 0.1% SDS, 2 mM EDTA, 10% glycerol) with protease inhibitor cocktail (Boehringer Mannheim, Germany) and 1 mM sodium orthovanadate. Cell lysates were clarified by centrifugation and 1 mg cell lysate protein was IP with SP260 anti-Met Ab. The immunoprecipitates were subjected to WB analysis using either SP260 anti-Met antibody (1:500) or 4G10 anti-pTyr antibody (1:1500). Visualization was achieved using HRP-conjugated anti-mouse IgG antibody or HRP-conjugated protein A (1:5000) (Amersham, Arlington Heights, IL), enhanced chemiluminescence (ECL) reaction and exposure to X-ray film (Fuji, Japan).
Biological Effects of HGF/SF: Ruffling and Scatter Assay
To analyze the effect of HGF/SF on membrane ruffling, a rapid CLSM time lapse photography (0.05-second interval) of untreated and HGF/SF-treated (20 ng/ml) DA3 cells was performed. CLSM DIC images of untreated and HGF/SF-treated cells after 10 minutes and 10 minutes+0.05 seconds were acquired.
Scatter assay was carried out as previously described in the literature [29,30].
Perfusion Method
Cell perfusion mandates attaching cells to a matrix to prevent washing with the effluent or clogging the filters. In these studies, we used the method of cellular embedding in sodium alginate microcapsules [31]. This method is very suitable for NMR studies of normal and tumor human cells. 1.0±0.2x10⁸ cells were used in each experiment. The cells were harvested as described above and the pellet was mixed with equal volume of 2.5% (w/v in PBS) sodium alginate. The mixture was manually extruded, under minimal pressure, through a 25-gauge needle, onto the surface of 0.1 M CaCl2 solution. The small drops gelled into capsules, which were immediately washed three times in growth medium. The capsules were isolated by decantation, transferred to a 10-mm screw cap NMR tube, and perfusion was promptly initiated. The capsules were not tightly packed in order to ensure optimal perfusion. Average procedure length was 15 to 20 minutes, and the time in CaCl2 was kept below 5 minutes.
The experiments were performed using a non-recycling perfusion system. The perfusion was performed through an insert with inlet and outlet tubing, and the volume of the perfusion chamber was 2 ml. The perfusion solution flowed from the opening of the inlet near the bottom of the tube through the packed alginate capsules, and the outflow was directed through opening in the insert to the outlet tubing. A constant flow of 0.9 ml/minute in a single pass mode was maintained by a peristaltic pump throughout all experiments, and the temperature was maintained at 37°C. The perfusion solution contained 5.5 mM glucose, similar to glucose physiological concentration, unless otherwise indicated. In each experiment, control perfusion with 31P NMR recording was carried out for about 90 minutes to ensure metabolic stability of the cells, before adding the HGF/SF (100 ng/ml) to the perfusion solution.
Magnetic Resonance Spectroscopy and Data Analysis
The NMR spectra were recorded on a Bruker ARX-500 spectrometer equipped with a quadro-nuclei software controlled probe. 31P spectra were recorded at 202.46 MHz, with broadband proton decoupling. The temperature of the sample inside the magnet was maintained at 37°C using a thermocouple. Each spectrum was an accumulation of 400 scans, with 1.85 seconds repetition time and 45° flip angle. 31P chemical shifts were determined by standardizing glycerophosphocholine (GPC) to 0.49 ppm [32]. The spectra were analyzed on a SGI Data Station, and acquisition and processing parameters were identical throughout all experiments. Quantification was performed by measuring the heights of the peaks; 20 Hz line broadening was applied. Under these conditions, there was no significant nuclear Overhauser effect. The intracellular pH was determined from the intracellular Pi peak. Although using phosphate-free medium would facilitate measuring this peak, we use phosphate-containing medium in these experiments in order to keep the conditions as physiological as possible. Moreover, previously, we have found continuous depletion of nucleoside triphosphate (NTP) when cells were perfused with phosphate-free medium (unpublished results). A reference, 50 mM preweighed tetrametaphosphate (TMP), within a sealed capillary in the perfusion tube, was used for quantitative analyses.
13C NMR spectra were recorded in cells perfused with [13C1]-glucose-enriched medium, at 125.7 MHz, with proton decoupling. No significant NOE was induced in these experiments. Each spectrum was an accumulation of 200 transients, with 1 second repetition time and 45° flip angle. Quantification was performed by measuring relative integrals of the peaks. Peaks were assigned by standardizing glucose to 94.7 ppm. A reference, preweighed dioxane solution, within a capillary in the perfusion tube, was used for quantitative analyses of 13C-containing metabolites, taking into account the 1.1% natural abundance of 13C nucleus.
Protein Determination in the Embedded Cells
Cell number in each experiment is standardized for quantification of the results. The proteins were extracted by treating the cells (in the alginate capsules) with alkali at high temperature (125°C, 1 N NaOH). Protein content was measured by the bicinchoninic acid assay and spectrophotometric quantitation at 562 nm. Absorbance measurements were performed with an ELISA reader, (Elx808 BioTEC Instruments, Inc.).
Oxygen Consumption Measurements
Cells were embedded in alginate capsules and perfused as described above. Two three-way valves were inserted in the inflow and the effluent tubes, in close proximity to the perfusion chamber. After 90 minutes of perfusion for stabilization, baseline control samples were collected at 10-minute intervals for an hour. Then, 5.6 ng/ml HGF/SF was added to 50 ml of medium, which was perfused for 1 hour, followed by perfusion with medium for additional 120 minutes. At each time point, samples (1 ml each) were withdrawn from the inflow medium and the effluent. The samples were kept in closed syringes without air, and the measurements were promptly performed with a Stat 1 Profile instrument (NOVA Biomedical). Oxygen consumption, in addition to pCO2 and pH changes, was calculated from the difference between concentrations of the inflow medium and the effluent.
Each series of NMR and oxygen consumption measurements was repeated at least three times, and the results are expressed as means±SD. Statistical analyses were performed with the paired, double-tailed, Student's t-test.
Glucose Consumption Assays
The 25x104 cells were plated in 25-cm2 flasks in 10 ml growth medium. When the cells reached 50±5% confluence, the medium was replaced by 11 mM glucose DMEM with 1.25 ng/ml of HGF/SF. Twenty four hours later, samples of medium were taken for glucose measurements, and a cell count was performed in one flask. After 48 hours of HGF/SF stimulation, glucose levels were measured again, and cell counts were performed in the remaining flasks. Glucose concentrations were determined by the hexokinase enzymatic assay, utilizing the coupled enzyme reaction catalysed by hexokinase and glucoses-6-phosphate dehydrogenase, and measuring the product, NADH, at 340 nm.
Mitochondria Activity Analysis
CLSM was used to quantify the mitochondrial autofluorescence changes of NAD(P)H and flavoproteins in unfixed saponin-permeabilized DA3 cells. Changes were calculated by ratio imaging of autofluorescence intensities of fluorescent flavoproteins and NAD(P)H as previously described [33]. In brief, coverslips-8-well Lab-Tek chamber slides (Nunc, Denmark), were seeded with 104 cells per well in medium containing 10% FCS for 24 hours. Cells were washed twice and incubated in measurement medium (consisting of 110 mM mannitol, 60 mM KCl, 10 mM KH2PO4, 5 mM MgCl2, 0.5 mM Na2EDTA, and 60 mM Tris-HCl, pH 7.4). Saponin treatment was performed as described by Kuznetzov et al. [33] by a 30-minute incubation of the cells in relaxing solution 10 mM Ca-EGTA buffer, 0.1 mM calcium, 20 mM imidazole, 20 mM taurine, 49 mM K-2-(N-morpholino)-ethanesulfonic acid, 3 mM KH2PO4, 9.5 mM MgCl2, 5 mM ATP, 15 mM phosphocreatine, pH 7.1) containing 50 mg/ml saponin. The cells were treated with 20 ng/ml of HGF/SF for 0 to 20 minutes. The NAD(P)H fluorescence was excited at 325 nm using the CLSM UV laser. The flavoprotein fluorescence was excited at 488 nm using a 75-mW argon ion laser (model OMI-532 AP; Omnichrome). The emissions at wavelengths 450 (NAD(P)H fluorescence) or 520 nm (flavoprotein fluorescence) were collected by the Zeiss 410 (Oberkochen, Germany) CLSM having the following configuration: 25 mW HeNe lasers (633 nm), krypton argon (488, 568 nm and UV (364 nm) laser lines. For control of NAD(P)H elevation, the cells were treated with 1 mM octanoylearnitine (OC) and 5 mM malate (MAL). For control of NAD(P)H downregulation, the cells were treated with 1 mM ADP. The NAD(P)H signal was co-localized with MitoTracker Red mitochondrial marker (Molecular Probes, OR) to verify that the source of NAD(P)H was mitochondrial and not cytoplasmatic. When comparing fluorescence intensity, we used identical parameters for each image (e.g., scanning line, laser light, contrast brightness).
To calculate the ratio between the green and red fluorescence, we used the percentage positive area (PPA) image analysis procedure previously described [34]. The PPA data shown represent the calculated average of at least three different CLSM fields. Statistical significance was calculated using the Student's t-test in Microsoft Excel (Microsoft, Redmond, WA). Images were printed using a Codonics dye sublimation color printer.
Results
HGF/SF Induces Met Phosphorylation and Ruffling in DA3 Cells
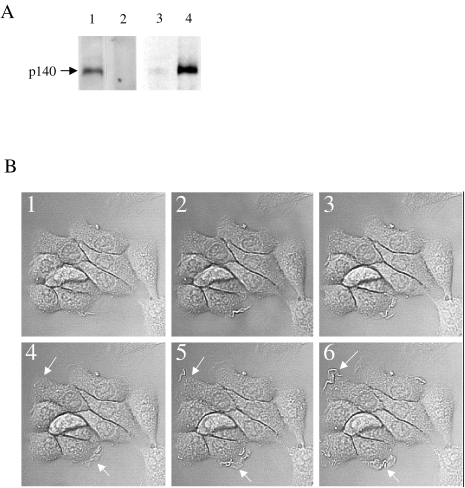
Met expression in DA3 cells was determined by WB analysis with SP260 rabbit anti-peptide antibody. High levels of p140met were detected (Figure 1A, lane 1 ). This band was not evident in the presence of SP260 immunizing peptide (Figure 1A, lane 2), confirming the specificity of the antibody. The influence of HGF/SF on Met phosphorylation was determined by IP using SP260 followed by WB analysis using anti-phosphotyrosine antibody (anti-pTyr). Low levels of phosphorylated Met were detected in the untreated DA3 cells (Figure 1A, lane 3). A 5-minute exposure to HGF/SF increased Met phosphorylation (Figure 1A, lane 4). Thus, Met is present and is rapidly phosphorylated in response to HGF/SF treatment.
Figure 1.
(A) Met expression and activation in DA3 cells. DA3 cell extracts were IP using SP260 antibody (1) or IP using SP260 antibody in the presence of immunizing peptide (2) and WB with SP260 antibody. Untreated DA3 cells (3) or DA3 cells treated with HGF/SF (1.25ng/ml) for 5 minutes (4) were lysed in the presence of sodium orthovanadate, cell extracts were IP with SP260 antibody and immunoblotted with anti-phosphotyrosine antibody (4G10). Met is expressed in DA3N cells and is rapidly phosphorylated in response to HGF/SF treatment. (B) HGF/SF induces membrane ruffling and scattering of DA3 mammary cells. CLSM DIC images of untreated (1–3) and HGF/SF-treated cells (20 ng/ml) (4–6) after 10 minutes (4,1) and 10 minutes+0.05 seconds (5, 2) and 0.1 second (6,3). Arrows indicate areas of ruffling (original magnification, x 450).
To analyze the effect of HGF/SF on membrane ruffling, we compared rapid CLSM time lapse photography (0.05-second interval) of untreated and treated DA3 cells. CLSM images of HGF/SF-treated (Figure 1B, 4–6) and untreated (Figure 1B, 1–3) cells after 10 minutes (Figure 1B, 4, 1, respectively) and 10 minutes+0.05 seconds and +0.1 second (Figure 1B, 5, 2 and 6, 3, respectively) were acquired. In the HGF/SF-treated cells, extensive formation of motile cell surface protrusions was observed. Little significant ruffling was observed in untreated cells (see arrows in Figure 1B). We performed 10 experiments to determine the number of cells exhibiting membrane ruffling for at least 50 cells per experiment. Ninety-five percent of the HGF/SF-treated cells exhibit membrane ruffling while only 4% of the untreated cells exhibited ruffling.
After 24 hours, DA3 cells treated with HGF/SF displayed fibroblast-like “scattered” morphology as compared to the epithelial appearance of untreated cells (data not shown). This change in morphology is similar to that of HGF/SF-treated MDCK cells (the classical model for HGF/SF-induced cell motility [35] exhibiting disruption and scattering of epithelial cell colonies). These results show that HGF/SF treatment induces rapid Met phosphorylation followed by rapid membrane ruffling and subsequently cell movement.
31P NMR
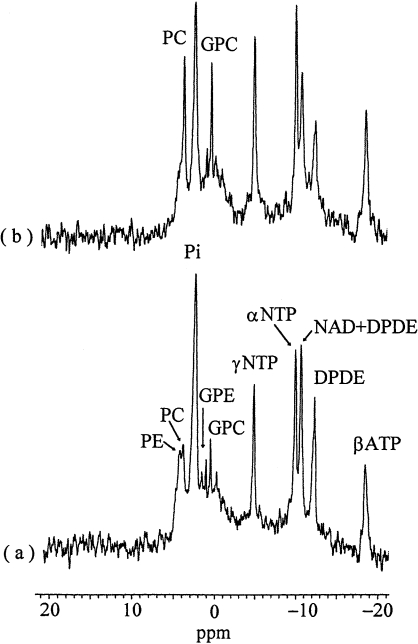
Phosphorous-31 NMR spectra of perfused DA3 murine mammary cancer cells are shown in Figure 2. The peaks were assigned according to previously published data, including perchloric acid extraction studies [32,36,37]. It should be noted that the effects of HGF/SF were assessed in the same sample from which the control spectrum was acquired. Perfusions with 100 ng/ml HGF/SF induced remarkable elevations of the PC and GPC signals compared to the control (P < .05). Similar effects were also noted following treatment with a low HGF/SF concentration (10 ng/ml), but the magnitude of the signals was smaller (data not shown). HGF/SF stimulation (100 ng/ml) was also associated with a small increase in the NTP peaks (ATP is a principal component of these signals), with no effect on the intracellular pH.
Figure 2.
31P NMR spectra of perfused DA3 cells at 37°C. (a) Controls; (b) 1 hour after perfusion with 100 ng/ml HGF/SF. For acquisition parameters, see Materials and Methods section; line broadening=20 Hz. PE, phosphoethanolamine; PC, phosphocholine; Pi, inorganic phosphate; GPE, glycerophosphoethanolamine; GPC, glycerophosphocholine; NTP, nucleoside triphosphate; NAD, nicotinamide dinucleotide; DPDE, diphosphodiester. Note the remarkable increase of the PC and GPC signals following exposure to HGF/SF. No phosphocreatine signals were found in these spectra.
2-Deoxyglucose (2-DG)
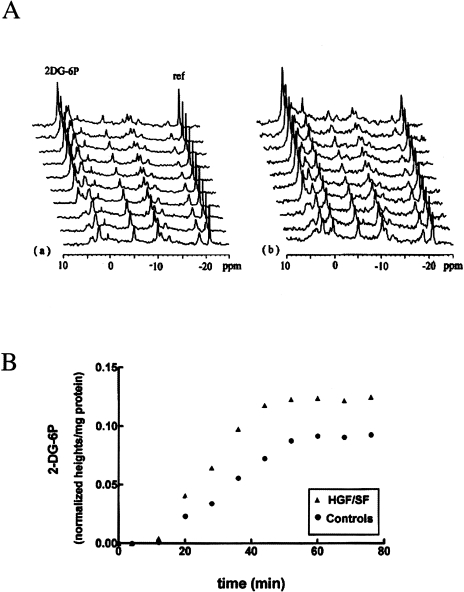
2-DG is a metabolic inhibitor that competes with glucose on transport into the cells, and once having entered cells is phosphorylated by hexokinase to 2-deoxyglucose-6-phosphate (2-DG-6P), which undergoes no further metabolism [38,39]. We used 2-DG as a “probe” to measure this initial step of glycolysis. The cells were perfused with DMEM (containing 5.5 mM glucose) into which 5 mM 2-DG was added, and the accumulation of 2-DG-6P was followed serially (Figure 3A). Because 2-DG treatment irreversibly blocks glycolysis, causing energy deprivation, and the cells are no longer in homeostasis, it was necessary to perform the control and the HGF/SF stimulation experiments with different samples. 2-DG and HGF/SF had some effects on all the 31P signals and a reference was mandatory. The signal of 2-DG-6P overlaps the phosphomonoester (PME) peaks and measuring its integrals may be inaccurate. Therefore, we used peak heights with line broadening of 20 Hz. The results were normalized according to the reference and protein contents. The accumulation of 2-DG-6P is shown in Figure 3B.
Figure 3.
31PNMR of DA3 cells perfused with 2-deoxyglucose. (A) 31P spectra: (a) Controls — cells were perfused with DMEM containing 2-DG (5 mM) and 31P spectra were continuously recorded; (b) HGF effects — cells were perfused with HGF/SF (100 ng/ml) for 60 minutes. 2-DG (5 mM) was then added to the perfusion solution and 31P spectra were continuously recorded. For acquisition parameters, see Materials and Methods section; line broadening=20 Hz. The time scale starts at the point at which 2-DG reached the cells. For peak assignments — see Figure 2. 2-DG-6P, 2-deoxyglucose-6-phosphate; ref, reference (TMP in a capillary). (B) Accumulation of 2-DG-6P. The metabolite levels were normalized according to the signals of the reference and the cellular protein content. Results of one pair of control and HGF/SF experiments out of three different sets of experiments are shown.
The rates of the phosphorylation reaction were calculated using the equation: Initial rate = ln2I∞/t1/2, where I∞ is the magnitude of the final 2-DG-6P signal, and t1/2 is the time required to reach one-half of this magnitude. Time 0 is the time when 2-DG-6P enters the perfusion chamber (calculated from the time 2-DG-6P perfusion began and taking into account the rate of perfusion and the length of the tubes). The slow accumulation of 2-DG-6P during the first 10 minutes is due to the time until 2-DG-6P solution replaces the DMEM in the perfusion chamber. Since control and HGF/SF experiments were performed in an identical manner, this delay is identical with and without treatment.
The I∞ in three different control experiments was 92.2±10.5x10⁻³ normalized integral/mg protein, and following HGF/SF administration, it was 125.3±9.8x10⁻³ normalized integral/mg protein in three identical experiments (P < .05). HGF/SF significantly increased the 2-DG phosphorylation rate, from 2.2±0.4x10⁻³ normalized integral/mg protein per minute in the control perfusions to 3.5±0.3x10⁻³ normalized integral/mg protein per minute after HGF/SF stimulation (P < .05).
13C NMR
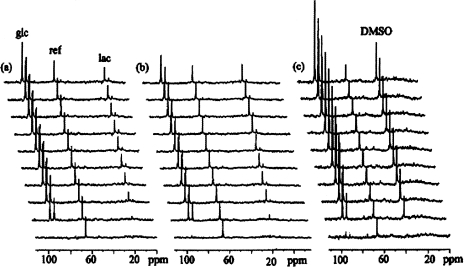
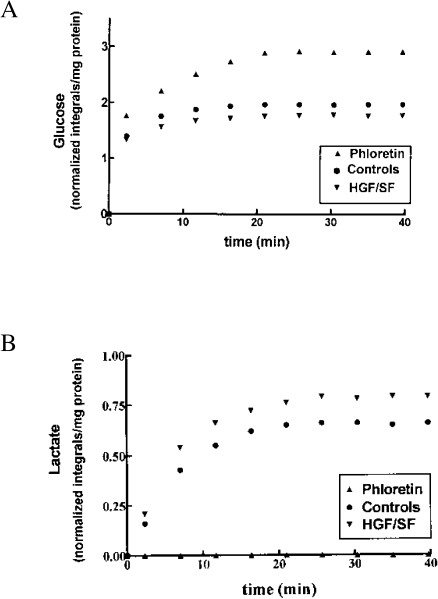
The effects of HGF/SF on cellular glucose uptake and lactate production were studied by continuous 13C NMR measurements. The following protocol was used: cells were perfused with [13C1]-glucose-enriched medium, and control 13C spectra were continuously recorded (Figure 4a). After a complete washout for 60 minutes with medium, perfusion with HGF/SF (100 ng/ml in DMEM) was maintained for 60 minutes. A second perfusion with [13C1]-glucose-enriched medium was then recorded (Figure 4b). Thus, each sample served as its own control. It is noteworthy that in 20 to 25 minutes, both glucose and lactate reached plateau levels that represent a steady state of glucose utilization and glycolysis.
Figure 4.
13C spectra of DA3 cells perfused with 13C1 glucose, (a) Controls — cells were perfused with [13C1]-glucose-enriched medium and 13C spectra were continuously recorded, (b) Following a complete washout for 60 minutes with normal medium, the cells were perfused with DMEM containing HGF/SF (100 ng/ml) for 60 minutes and the 13C NMR experiment was repeated on the same sample, (c) Following a second washout, the cells were perfused with DMEM containing 200 mM phloretin. For acquisition parameters, see Materials and Methods section; line broadening = 15 Hz. Each spectrum was accumulated for 4 hours and 40 minutes. The time scale starts at the point at which [13C1]-glucose reached the cells. Note that lactate production and accumulation reached plateau in approximately 20 to 25 minutes. Chemical shifts were determined by standardizing glucose to 94.7 ppm. glc, glucose; lac, lactate; ref, reference (dioxane in a capillary). DMSO was used to dissolve phloretin (see Results section: 13C NMR). There are no lactate signals in the phloretin experiment.
In order to quantify cellular glucose utilization, its concentration in the perfusion chamber should be determined. Glucose is continuously transported into the cells, and, once inside them, is immediately phosphorylated [40]. Therefore, calculation based only on its concentration in the perfusion solution and on the volume of the cells and capsules [41] may lead to erroneous results. Indeed, NMR-detected glucose levels at steady state are lower than the results obtained based on these estimations. In order to solve this problem, we used the glucose transport inhibitor, phloretin (200 mM final concentration), dissolved in DMSO (Figure 4C). The final concentration of the DMSO in the perfusion solution was 0.2%. We have previously shown that DMSO at this concentration had no effects on cellular viability or on NMR spectra [42,43]. Addition of phloretin to the perfusion solution increased glucose levels by 47.7±6.1% compared to controls of the same samples (Figure 5A). In cells perfused with [13C1]-glucose-enriched medium and phloretin, there was no lactate signal (Figure 5B), indicating that phloretin completely inhibited glycolysis. The amount of lactate formed in the control perfusions was 70.2±8.6% of the increase of the glucose in the phloretin perfusions. It can be concluded, therefore, that glycolysis consumed 70% of the glucose metabolism.
Figure 5.
13C NMR kinetic measurements of glucose utilization (A) and lactate formation (B). Controls — cells were perfused with [13C1]-glucose-enriched medium and 13C spectra were continuously recorded. HGF/SF — following a complete washout for 60 minutes with normal medium, the cells were perfused with DMEM containing 100 ng/ml HGF/SF for 60 minutes and the 13C NMR experiment was repeated. Phloretin — following a second complete washout with normal medium, the cells were perfused with DMEM containing phloretin (200 mM) and the 13C NMR spectra were recorded again on the same sample. The time scale starts at the point at which [13C1]-glucose reached the cells. Results of one out of three different experiments are shown. Metabolite levels were determined by normalizing NMR signals integrals to the reference (dioxane in a capillary), and to the protein content of the cell.
The kinetic studies demonstrated significant effects of HGF/SF on glucose uptake and lactate accumulation; it reduced the steady state levels of glucose and elevated those of lactate, compared to the control measurements (Figure 5). Lactate signals increased from 0.66±0.05 normalized integrals/mg protein in the control perfusions to 0.79±0.06 normalized integrals/mg protein following HGF/SF (P < .05). 13C NMR of the effluent, which was collected after perfusion, showed a similar pattern, i.e. higher levels of lactate and lower levels of glucose following HGF/SF treatment compared to the control perfusions (data not shown). The differences in the lactate signals are, therefore, not a consequence of inhibition of the export of lactate from the cell, but reflect the effects of HGF/SF on its formation as the final product of glycolysis.
Glucose Consumption
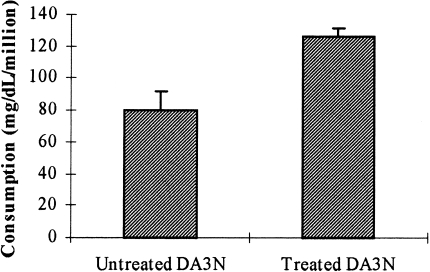
The effect of HGF/SF on glucose consumption under tissue culture conditions was also examined. DA3 cells were plated in tissue culture flasks (2.5x10⁵/flask). When confluence was approximately 50%, the growth medium was replaced with medium containing 2 g/l glucose, with or without HGF/SF (1.25 ng/ml). Twenty four and 48 hours later, 0.2 ml aliquots of the medium were collected and analyzed for glucose concentration using the hexokinase enzymatic assay kit (Sigma) according to manufacturer's instructions, and cell number in one flask of each treatment was counted using trypan blue. Glucose consumption levels after 48 hours are displayed as milligram per deciliter per million cells (Figure 6). Consistent with the 13C NMR results, we found that HGF/SF significantly increased glucose consumption in the cultured DA3 cells, from 79.85±12.2 to 126.0±5.2 mg/dl per million cells (P < .0001).
Figure 6.
Effects of HGF/SF on glucose consumption. DA3 cells were plated in tissue culture flasks. When confluence was approximately 50%, the growth medium was replaced with medium containing 2 g/l glucose, with or without HGF/SF (1.25 ng/ml). Twenty-four and 48 hours later, samples from the medium were tested for glucose concentration using hexokinase enzymatic assay kit (Sigma) according to manufacturer's instructions, and cell number in one flask was counted using trypan blue. Statistical analysis of the results was carried out using t-test.
Oxygen Consumption
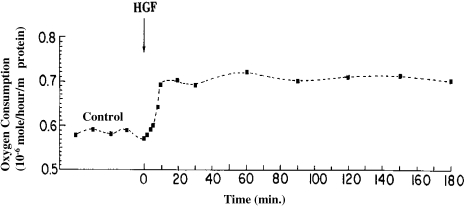
The effects of HGF/SF on oxygen utilization as well as on carbon dioxide and pH levels were studied in a perfusion system simulating physiological conditions. Oxygen consumption was determined by calculating the difference in oxygen content of perfusion medium (In) and effluent (Out). Measurements were performed in the presence and absence of HGF/SF. Exposure of DA3 cells to HGF/SF increased oxygen consumption by 20.1% compared to untreated cells (Table 1). Based on the solubility of oxygen in aqueous solutions at 37°C perfusion rate and protein content, oxygen consumption was determined to be 0.58±0.02 µmol/hour per milligram protein in the control cells, and 0.71±0.03 µmol/hour per milligram protein in the HGF/SF-stimulated cells (P < .05).
Table 1.
Oxygen consumption, CO2 production and pH changes in perfused DA3 cells.
| Control | HGF/SF treatment | |||||
| In | Out | δ | In | Out | δ | |
| O2 (Torr) | 222.9±2.7 | 121.3±3.6 | 100.8±1.6 | 224±2.4 | 103.1±2.3 | 121.1±2.9 |
| CO2 (Torr) | 33.1±2.2 | 69.9±2.9 | 36.5±2.5 | 32.8±2.1 | 59.6±2.7 | 27.1±3.2 |
| pH | 7.48±0.02 | 7.16±0.02 | 0.32±0.01 | 7.49±0.02 | 7.24±0.03 | 0.25±0.02 |
Samples of perfusion medium (In) and effluent (Out) were simultaneously collected. In each experiment: Control samples were collected for 1 hour at 10-minute intervals; HGF/SF (5.6 ng/ml medium) was then perfused for 1 hour. Samples were collected afterwards at 30-minute intervals for 180 minutes. The results are the means and SD of three different experiments.
The differences between the δ's of the control and post HGF/SF stimulation measurements were statistically significant for O2, CO2 and pH (P < .05).
The same measurements were performed for carbon dioxide production and pH. Surprisingly, we found that HGF/SF treatment decreased carbon dioxide accumulation by 26.6% and attenuated the pH decrease by 21.8% compared to the control perfusions of the same samples (P < .05 for both).
In order to evaluate the time scale of the abovenoted changes, two more experiments were carried out in which samples were collected at 2-minute intervals for the first 10 minutes after HGF/SF had entered the perfusion chamber (Figure 7). As can be seen, these effects are very fast; they were already apparent after 6 to 8 minutes and, by 10 minutes, nearly reached a steady state that was maintained for over 2 hours following termination of HGF/SF perfusion.
Figure 7.
Effects of HGF/SF on oxygen consumption of perfused DA3 cells at 37°C. Baseline control samples were collected at 10-minute intervals, and HGF/SF (5.6 ng/ml) was perfused for 60 minutes, followed by perfusion with the regular medium for additional 120 minutes. Samples (1 ml each) were withdrawn from the inflow medium and the effluent at each time point, and the oxygen consumption was calculated from the difference between the measurements of the inflow medium and the effluent. Note that the increase in the oxygen consumption reached a plateau in less than 20 minutes, and persisted for 2 hours after the completion of HGF/SF treatment.
Metabolic Redox Ratio Images of DA3 Cells Treated with HGF/SF
The inverse fluorescence behavior of NAD(P)H and flavoproteins in response to the reduction-oxidation of the mitochondrial NAD system can serve as a very sensitive indicator of changes in mitochondrial activity [44]. In order to study the effects of HGF/SF on mitochondrial activities, CLSM quantification of the autofluorescence changes of NAD(P)H and flavoprotein in unfixed saponin-permeabilized DA3 cells was performed. The data derived from six independent experiments exhibited similar results.
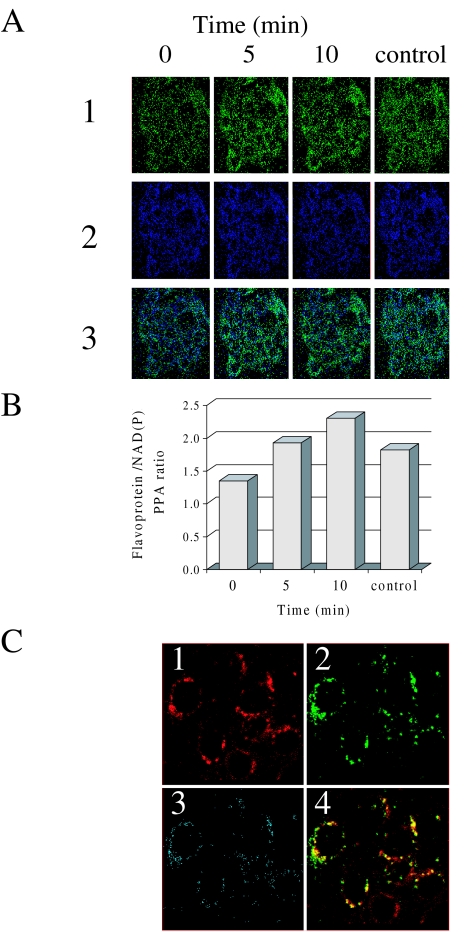
Treatment with 20 ng/ml HGF/SF for 5, 10, 15 and 20 minutes led to increased green fluorescence (flavoproteins) (Figure 8A, 1, times 0, 5 and 10) and decreased blue fluorescence (NAD) (Figure 8A, 2, times 0, 5 and 10). Calculating the ratio between the PPA of the green and blue images demonstrates that HGF/SF increased the ratio from 1.2 to 2.2 (P < .005). To demonstrate that the cells were metabolically active, 1 mM OC and 5 mM malate were added following HGF/SF treatment. A uniform decrease in the intensity of the ratio image was observed because of the quenching of the flavoprotein fluorescence, and an increase of the NAD(P)H fluorescence (Figure 8A and B, control). Treatment with 5 ng/ml HGF/SF increases the ratio to 1.8 and 10 ng/ml HGF/SF increases the ratio from 1.0 to 2.0. Treatment with 1 ng of HGF/SF did not increase the ratio significantly (results not shown). To test whether the detected flavoprotein autofluorescence (Figure 8C, 1) can be spatially co-localized with proven mitochondria-specific fluorescent markers (Figure 8C, 2), we applied the fluorescent dye MitoTracker Red FM [45]. The red and green signals co-localize as indicated by the yellow color (Figure 8C, 4) and the blue image in the CLSM co-localization analysis (Figure 8C, 3) [46].
Figure 8.
Effects of HGF/SF on redox changes in mitochondrial NAD system. (A) Saponin-permeabilized DA3 cells were treated with HGF/SF (20 ng/ml) and CLSM analysis was performed after 0, 5 and 10 minutes. For control of NAD(P)H elevation, the cells were treated with 1 mM octanoylcarnitine and 5 mM malate (control). (1) Flavoprotein autofluorescence (green). (2) NAD autofluorescence (blue). (3) CLSM autofluorescence ratio images (flavoprotein/NAD(P)H). (original magnification, x350) (B) Flavoprotein/NAD(P)H PPA ratio calculation of CLSM autofluorescence images of saponin-permeabilized DA3 cells treated with HGF/SF (20 ng/ml) for O, 5 and 10 minutes. For control of NAD(P)H elevation, the cells were treated with 1 mM octanoylcarnitine and 5 mM malate (control). (C) (1) CLSM image of saponin-permeabilized DA3 cells treated for 10 minutes with HGF/SF (20 ng/ml) and stained with MitoTracker Red FM. (2) CLSM flavoprotein autofluorescence image of saponin-permeabilized DA3 cells treated for 10 minutes with HGF/SF (20 ng/ml). (3) CLSM co-localization analysis of flavoprotein autofluorescence and MitoTracker-stained mitochondria (colocalization depicted in blue). (4) Yellow color indicates co-localization of green (flavoprotein) and red (mitochondria) CLSM images (original magnification, x350).
These results show that HGF/SF increases mitochondrial oxidative phosphorylation activity in a time- and dose-dependent manner.
Discussion
Met-HGF/SF signaling has been implicated in a wide range of cellular activities [1]. However, its effects on cellular metabolism have not been studied. Previously, we found that other growth factors, such as EGF and TNF-α, increased glucose consumption and lactate production in cancer cells [22,23]. However, these compounds did not modify the 31P spectra of perfused cells [22,23]. Few studies were conducted that show 31P NMR analysis of the effects of a growth factor [47]. In this study, we show for the first time that the effects of HGF/SF can be observed by 31P NMR spectroscopy. The changes in the phosphorous-containing metabolites are consistent with the high phosphorylation activities of HGF/SF, which encompass not only proteins but also phospholipid metabolism. The growth medium contained choline but not ethanolamine, and indeed only PC, and not phosphoethanolamine (PE), was elevated following HGF/SF treatment. PC is a substrate for phospholipids biosynthesis [48], and increased levels of this metabolite are often associated with induction of proliferation [49]. Our results are in concordance with recent work showing that HGF/SF stimulates de novo synthesis of lipids and secretion of lipoproteins in rat hepatocytes. rhHGF enhanced levels of triacylglycerol, total cholesterol, and phospholipids by 50% to 200% in both very low-density lipoprotein (VLDL) and low-density lipoproteins (LDL)/high-density lipoprotein (HDL) [50]. On the other hand, GPC is a degradative product of phospholipids metabolism. GPC was previously found to have a regulatory role in cellular differentiation, and it was suggested that it modulates membranous phospholipids composition, and alters membrane fluidity [51].
Growth factors increase the requirements for energy and synthesis of the carbon skeleton of macromolecules, and glucose is the foremost source for these metabolic activities in cancer cells [40,52]. We propose that increased glucose utilization is often the principal effect of growth factors such as EGF, TNF-alpha and HGF/SF, and perhaps of other cytokines. The marked increase in glucose consumption may lead to glucose depletion in unperfused cultured cells, and to cell growth inhibition. This phenomenon may be the reason for the inconsistent results obtained in previous studies with these agents [53–57], and demonstrates the advantage of perfusion studies.
Another benefit of cellular perfusion experiments is that the effects of manipulations with substrates, growth factors and drugs can be studied in a reversible manner, and each sample can be used as its own control. This was very useful for the kinetic 13C NMR measurements in this study. Moreover, perfusion studies enable accurate measurements of the levels of compounds in the vicinity of the cells, and quantitative evaluation of their utilization. Thus, when we used the glucose transport inhibitor phloretin, we determined the actual level of glucose in the perfusion chamber, and we calculated that approximately two thirds of the glucose that is used by the cells is metabolized via the glycolysis pathway to lactate.
Biochemical or pharmacological manipulations performed traditionally on cells in culture plates usually cause irreversible changes, which are reflected in major variations in the levels of the metabolites. Often, these experiments lead to non-physiological conditions in culture plates, while in a single pass perfusion experiment, the cells are furnished constantly with fresh substrates, the waste materials are removed, and the cells maintain their homeostatic mechanisms. Therefore, in perfusion experiments, even small concentration modifications may be associated with significant metabolic alterations.
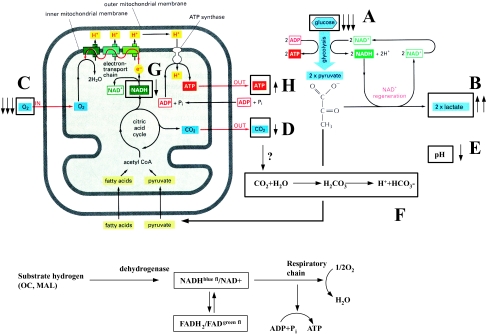
Based on our results, we propose a model that outlines the effects of HGF/SF on energy metabolism pathways (Figure 9). HGF/SF increased glucose consumption (Figure 9A) and lactate production (Figure 9B), indicating that the rate of glycolysis was increased. HGF/SF also enhanced oxygen utilization (Figure 9C), but decreased carbon dioxide levels (Figure 9D) and attenuated the pH decrease (Figure 9E) compared to control measurements. An explanation for this phenomenon may be that HGF/SF modifies the activities of hydrogenases, causing the following reaction to proceed from left to right: 2H++2NAD-H+O2 ⇔ 2H2O+2NAD+ (Figure 9G). These results are in concordance with the mitochondria CLSM analyses, which showed elevations of NAD+ and reduced NADH levels following stimulation with HGF/SF. Thus, HGF/SF enhanced oxidative phosphorylation, but actual CO2 accumulation was decreased. The reduction in CO2 levels may be explained by its consumption in the bicarbonate buffer system: CO2+H2O⇒H2CO3⇒H++HCO3- (Figure 9F). In this buffer system, the pH is a function of the equilibrium between partial pressure of CO2 in the aqueous phase and in the gaseous phase over the buffer solution. When pH changes cause H2CO3 to be converted into HCO3-, it is rapidly replaced from this CO2 pool. Thus, CO2 levels are an inaccurate measurement for respiration, and the preferred method is oxygen consumption measurement.
Figure 9.
Effects of HGF/SF on energy metabolism pathways. HGF/SF increased glucose consumption causing decreased glucose levels (A) and increased lactate production (B), indicating that the rate of glycolysis was increased. HGF/SF enhanced oxygen utilization resulting in decreased oxygen levels (C), but decreased carbon dioxide levels (D) and attenuated the pH decrease (E) compared to control measurements. We propose that HGF/SF modifies the hydrogenases activity, causing the following reaction to proceed from left to right: 2H++2NADH+O2 ⇔ 2H2O+2NAD+. The reduction in CO2 levels may be explained by its consumption: CO2+H2O⇒H2CO3⇒H++HCO3- (F). This reaction is directed to the right as the protons are consumed in the “NAD+/NADH” reaction (G) described above.
The possibility that the effects of HGF/SF on O2, CO2 and pH are associated with a reduction in Krebs cycle activity should also be considered. The additional oxygen that is consumed after HGF/SF treatment may be used for other metabolic activities, such as an electron donor for biosynthetic pathways. However, the findings of the CLSM studies are not in agreement with this hypothesis.
To our knowledge, this is the first study showing that a growth factor directly stimulates alteration in the redox state of the mitochondria 5 minutes following tyrosine kinase receptor activation and the first to demonstrate change by a factor of 2 of the NAD/NADH ratio. Combined NMR and CLSM studies enabled detection of the effects of HGF/SF on glycolysis as well as on oxidative phosphorylation, and the results indicate that concomitant with induction of cellular activities, HGF/SF enhances both energy production pathways. Although the molecular mechanism underlying the metabolic alteration induced by Met-HGF/SF signal transduction has yet to be clarified, the data presented in this paper show activation of metabolic pathways essential for the biological activities of this growth factor. Understanding the activation of these pathways using advanced techniques such as NMR and CLSM can shed light on the metabolic processes leading to motility and metastasis, and could be further used in molecular imaging and in monitoring therapy.
Acknowledgements
Partially supported by a grant from the Israel Science Foundation founded by the Israel Academy of Sciences and Humanities. We thank Leonid Mittelman (Interdepartmental Core Facility, Sackler School of Medicine, Tel-Aviv University) for his excellent assistance with confocal microscopy. We thank Miriam Shaharabany and Mr. Rom T. Altstock for critical review of this work.
Abbreviations
- CLSM
confocal laser scanning microscopy
- 2-DG
2-deoxyglucose
- 2-DG-6P
2-deoxyglucose-6-phosphate
- DMEM
Dulbecco's modified Eagle's medium
- DPDE
diphosphodiester
- ECL
enhanced chemiluminescence
- GPC
glycerophosphocholine
- GPE
glycerophosphoethanolamine
- HGF/SF
hepatocyte growth factor/scatter factor
- NMR
nuclear magnetic resonance
- NTP
nucleoside triphosphate
- PE
phosphoethanolamine
- PC
phosphocholine
- PME
phosphomonoester
- IP
immunoprecipitation
- WB
Western blot analysis
- OC
octanoylcarnitine
- MAL
malate
References
- 1.Vande Woude GF, Jeffers M, Cortner J, Alvord G, Tsarfaty I, Resau J. Met-HGF/SF: tumorigenesis, invasion and metastasis. Proc Ciba Symp. 1997 doi: 10.1002/9780470515457.ch8. [DOI] [PubMed] [Google Scholar]
- 2.Jeffers M, Rong S, Anver M, Vande Woude GF. Autocrine hepatocyte growth factor/scatter factor-Met signaling induces transformation and invasive/metastatic phenotype in C127 cells. Oncogene. 1996;13:853–856. [PubMed] [Google Scholar]
- 3.Bladt F, Riethmacher D, Isenmann S, Aguzzi A, Birchmeier C. Essential role for the c-met receptor in the migration of myogenic precursor cells into the limb bud. Nature. 1995;376:768–771. doi: 10.1038/376768a0. [DOI] [PubMed] [Google Scholar]
- 4.Schmidt C, Bladt F, Goedecke S, Brinkmann V, Zschiesche W, Sharpe M, Gherardi E, Birchmeier C. Scatter factor/hepatocyte growth factor is essential for liver development. Nature. 1995;373:699–702. doi: 10.1038/373699a0. [DOI] [PubMed] [Google Scholar]
- 5.Uehara Y, Minowa O, Mori C, Shiota K, Kuno J, Noda T, Kitamura N. Placental defect and embryonic lethality in mice lacking hepatocyte growth factor/scatter factor. Nature. 1995;373:702–705. doi: 10.1038/373702a0. [DOI] [PubMed] [Google Scholar]
- 6.Tsarfaty I, Rong S, Resau JH, Rulong S, da Silva PP, Vande Woude GF. The Met proto-oncogene mesenchymal to epithelial cell conversion. Science. 1994;263:98–101. doi: 10.1126/science.7505952. [DOI] [PubMed] [Google Scholar]
- 7.Tsarfaty I, Resau JH, Rulong S, Keydar I, Faletto DL, Vande Woude GF. The met proto-oncogene receptor and lumen formation. Science. 1992;257:1258–1261. doi: 10.1126/science.1387731. [DOI] [PubMed] [Google Scholar]
- 8.Berdichevsky F, Alford D, D'Souza B, Taylor Papadimitriou J. Branching morphogenesis of human mammary epithelial cells in collagen gels. J Cell Sci. 1994;107:3557–3568. doi: 10.1242/jcs.107.12.3557. [DOI] [PubMed] [Google Scholar]
- 9.Soriano JV, Pepper MS, Nakamura T, Orci L, Montesano R. Hepatocyte growth factor stimulates extensive development of branching duct-like structures by cloned mammary gland epithelial cells. J Cell Sci. 1995;108:413–430. doi: 10.1242/jcs.108.2.413. [DOI] [PubMed] [Google Scholar]
- 10.Pepper MS, Soriano JV, Menoud PA, Sappino AP, Orci L, Montesano R. Modulation of hepatocyte growth factor and c-met in the rat mammary gland during pregnancy, lactation, and involution. Exp Cell Res. 1995;219:204–210. doi: 10.1006/excr.1995.1220. [DOI] [PubMed] [Google Scholar]
- 11.Nishiyama T, Sasaki T, Takaishi K, Kato M, Yaku H, Araki K, Matsuura Y, Takai Y. rac p21 is involved in insulin-induced membrane ruffling and rho p21 is involved in hepatocyte growth factor- and 12-O-tetradecanoylphorbol-13-acetate TPA)-induced membrane ruffling in KB cells. Mol Cell Biol. 1994;14:2447–2456. doi: 10.1128/mcb.14.4.2447. [DOI] [PMC free article] [PubMed] [Google Scholar]
- 12.Ridley AJ, Comoglio PM, Hall A. Regulation of scatter factor/hepatocyte growth factor responses by Ras, Rac, and Rho in MDCK cells. Mol Cell Biol. 1995;15:1110–1122. doi: 10.1128/mcb.15.2.1110. [DOI] [PMC free article] [PubMed] [Google Scholar]
- 13.Rong S, Bodescot M, Blair D, Dunn J, Nakamura T, Mizuno K, Park M, Chan A, Aaronson S, Vande Woude GF. Tumorigenicity of the met proto-oncogene and the gene for hepatocyte growth factor. Mol Cell Biol. 1992;12:5152–5158. doi: 10.1128/mcb.12.11.5152. [DOI] [PMC free article] [PubMed] [Google Scholar]
- 14.Giordano S, Zhen Z, Medico E, Gaudino G, Galimi F, Comoglio PM. Transfer of mitogenic and invasive response to scatter factor/hepatocyte growth factor by transfection of human MET proto-oncogene. Proc Natl Acad Sci USA. 1993;90:649–653. doi: 10.1073/pnas.90.2.649. [DOI] [PMC free article] [PubMed] [Google Scholar]
- 15.Matsumoto K, Matsumoto K, Nakamura T, Kramer RH. Hepatocyte growth factor/scatter factor induces tyrosine phosphorylation of focal adhesion kinase (p125FAK) and promotes migration and invasion by oral squamous cell carcinoma cells. J Biol Chem. 1994;269:31807–31813. [PubMed] [Google Scholar]
- 16.Rong S, Segal S, Anver M, Resau JH, Vande Woude GF. Invasiveness and metastasis of NIH/3T3 cells induced by Met-HGF/SF autocrine stimulation. Proc Natl Acad Sci USA. 1994;91:4731–4735. doi: 10.1073/pnas.91.11.4731. [DOI] [PMC free article] [PubMed] [Google Scholar]
- 17.Jeffers M, Rong S, Vande Woude GF. Enhanced tumorigenicity and invasion-metastasis by hepatocyte growth factor/scatter factor-met signalling in human cells concomitant with induction of the urokinase proteolysis network. Mol Cell Biol. 1996;16:1115–1125. doi: 10.1128/mcb.16.3.1115. [DOI] [PMC free article] [PubMed] [Google Scholar]
- 18.Rosen EM, Knesel J, Goldberg ID, Jin L, Bhargava M, Joseph A, Zitnik R, Wines J, Kelley M, Rockwell S. Scatter factor modulates the metastatic phenotype of the EMT6 mouse mammary tumor. Int J Cancer. 1994;57:706–714. doi: 10.1002/ijc.2910570517. [DOI] [PubMed] [Google Scholar]
- 19.Bussolino F, Di RM, Ziche M, Bocchietto E, Olivero M, Naldini L, Gaudino G, Tamagnone L, Coffer A, Comoglio PM. Hepatocyte growth factor is a potent angiogenic factor which stimulates endothelial cell motility and growth. J Cell Biol. 1992;119:629–641. doi: 10.1083/jcb.119.3.629. [DOI] [PMC free article] [PubMed] [Google Scholar]
- 20.Rosen EM, Grant DS, Kleinman HK, Goldberg ID, Bhargava MM, Nickoloff BJ, Kinsella JL, Polverini P. Scatter factor (hepatocyte growth factor) is a potent angiogenesis factor in vivo. Symp Soc Exp Biol. 1993;47:227–234. [PubMed] [Google Scholar]
- 21.Lamszus K, Jin L, Fuchs A, Shi E, Chowdhury S, Yao Y, Polverini PJ, Laterra J, Goldberg ID, Rosen EM. Scatter factor stimulates tumor growth and tumor angiogenesis in human breast cancers in the mammary fat pads of nude mice. Lab Invest. 1997;76:339–353. [PubMed] [Google Scholar]
- 22.Kaplan O, Jaroszewski JW, Faustino PJ, Zugmaier G, Ennis BW, Lippman M, Cohen JS. Toxicity and effects of epidermal growth factor on glucose metabolism of MDA-468 human breast cancer cells. J Biol Chem. 1990;265:13641–13649. [PubMed] [Google Scholar]
- 23.Kaplan O, Ruiz Cabello J, Cohen JS. In vitro cytotoxic effects of tumor necrosis factor alpha in human breast cancer cells may be associated with increased glucose consumption. FEBS Lett. 1997;406:175–178. doi: 10.1016/s0014-5793(97)00265-2. [DOI] [PubMed] [Google Scholar]
- 24.Daly PF, Cohen JS. Magnetic resonance spectroscopy of tumors and potential in vivo clinical applications: a review. Cancer Res. 1989;49:770–779. [PubMed] [Google Scholar]
- 25.Kaplan O, Cohen JS. Metabolism of breast cancer cells as revealed by non-invasive magnetic resonance spectroscopy studies. Breast Cancer Res Treat. 1994;31:285–299. doi: 10.1007/BF00666161. [DOI] [PubMed] [Google Scholar]
- 26.Rong S, Oskarsson M, Faletto D, Tsarfaty I, Resau JH, Nakamura T, Rosen E, Hopkins RFD, Vande Woude GF. Tumorigenesis induced by coexpression of human hepatocyte growth factor and the human met proto-oncogene leads to high levels of expression of the ligand and receptor. Cell Growth Differ. 1993;4:563–569. [PubMed] [Google Scholar]
- 27.Fu Y, Watson G, Jimenez JJ, Wang Y, Lopez DM. Expansion of immunoregulatory macrophages by granulocyte-macrophage colony-stimulating factor derived from a murine mammary tumor. Cancer Res. 1990;50:227–234. [PubMed] [Google Scholar]
- 28.Gonzatti-Haces M, Seth A, Park M, Copeland T, Oroszlan S, Vande Woude GF. Characterization of the TPR-MET oncogene p65 and the MET proto-oncogene p140 protein tyrosine kinases. Proc Natl Acad Sci USA. 1988;85:21–25. doi: 10.1073/pnas.85.1.21. [DOI] [PMC free article] [PubMed] [Google Scholar]
- 29.Stoker M, Gherardi E, Perryman M, Gray J. Scatter factor is a fibroblast-derived modulator of epithelial cell mobility. Nature. 1987;327:239–242. doi: 10.1038/327239a0. [DOI] [PubMed] [Google Scholar]
- 30.Rosen EM, Goldberg ID, Kacinski BM, Buckholz T, Vinter DW. Smooth muscle releases an epithelial cell scatter factor which binds to heparin. In Vitro Cell Dev Biol. 1989;25:163–173. doi: 10.1007/BF02626174. [DOI] [PubMed] [Google Scholar]
- 31.Narayan KS, Moress EA, Chatham JC, Barker PB. 31P NMR of mammalian cells encapsulated in alginate gels utilizing a new phosphate-free perfusion medium. NMR Biomed. 1990;3:23–26. doi: 10.1002/nbm.1940030104. [DOI] [PubMed] [Google Scholar]
- 32.Navon G, Ogawa S, Shulman RG, Yamane T. 31P nuclear magnetic resonance studies of Ehrlich ascites tumor cells. Proc Natl Acad Sci USA. 1977;74:87–91. doi: 10.1073/pnas.74.1.87. [DOI] [PMC free article] [PubMed] [Google Scholar]
- 33.Kuznetsov AV, Mayboroda O, Kunz D, Winkler K, Schubert W, Kunz WS. Functional imaging of mitochondria in saponin-permeabilized mice muscle fibers. J Cell Biol. 1998;140:1091–1099. doi: 10.1083/jcb.140.5.1091. [DOI] [PMC free article] [PubMed] [Google Scholar]
- 34.Ronen D, Altstock RT, Firon M, Mittelman L, Sobe T, Resau JH, Vande Woude GF, Tsarfaty I. Met-HGF/SF mediates growth arrest and differentiation in T47D breast cancer cells. Cell Growth Differ. 1999;10:131–140. [PubMed] [Google Scholar]
- 35.Stoker M, Perryman M. An epithelial scatter factor released by embryo fibroblasts. J Cell Sci. 1985;77:209–223. doi: 10.1242/jcs.77.1.209. [DOI] [PubMed] [Google Scholar]
- 36.Kaplan O, van Zijl PC, Cohen JS. Information from combined 1H and 31P NMR studies of cell extracts: differences in metabolism between drug-sensitive and drug-resistant MCF-7 human breast cancer cells. Biochem Biophys Res Commun. 1990;169:383–390. doi: 10.1016/0006-291x(90)90343-l. [DOI] [PubMed] [Google Scholar]
- 37.Kaplan O, Navon G, Lyon RC, Faustino PJ, Straka EJ, Cohen JS. Effects of 2-deoxyglucose on drug-sensitive and drug-resistant human breast cancer cells: toxicity and magnetic resonance spectroscopy studies of metabolism. Cancer Res. 1990;50:544–551. [PubMed] [Google Scholar]
- 38.Demetrakopoulos GE, Linn B, Amos H. Starvation, deoxysugars, ouabain, and ATP metabolism in normal and malignant cells. Cancer Biochem Biophys. 1982;6:65–74. [PubMed] [Google Scholar]
- 39.Horton RW, Meldrum BS, Bachelard HS. Enzymic and cerebral metabolic effects of 2-deoxy-D-glucose. J Neurochem. 1973;21:507–520. doi: 10.1111/j.1471-4159.1973.tb05996.x. [DOI] [PubMed] [Google Scholar]
- 40.Eigenbrodt E, Fister P, Reinacher M. New perspectives on carbohydrate metabolism in tumor cells. In: Beitner R, editor. Regulation of Carbohydrate Metabolism. Vol. 2. Boca Raton, FL: CRC Press, Inc.; 1985. pp. 141–179. [Google Scholar]
- 41.Neeman M, Degani H. Metabolic studies of estrogen- and tamoxifen-treated human breast cancer cells by nuclear magnetic resonance spectroscopy. Cancer Res. 1989;49:589–594. [PubMed] [Google Scholar]
- 42.Ben Horrin H, Tassini M, Vivi A, Navon G, Kaplan O. Mechanism of action of the anti-neoplastic drug lonidamine: 31P and 13C nuclear magnetic resonance studies. Cancer Res. 1995;55:2814–2821. [PubMed] [Google Scholar]
- 43.Vivi A, Tassini M, Ben-Horin H, Navon G, Kaplan O. Comparison of action of the anti-neoplastic drug lonidamine on drug-sensitive and drug-resistant human breast cancer cells: 31P and 13C nuclear magnetic resonance studies. Breast Cancer Res Treat. 1997;43:15–25. doi: 10.1023/a:1005781320906. [DOI] [PubMed] [Google Scholar]
- 44.Mayevsky A, Chance B. Intracellular oxidation-reduction state measured in situ by a multichannel fiber optic surface fluorometer. Science. 1982;217:537–540. doi: 10.1126/science.7201167. [DOI] [PubMed] [Google Scholar]
- 45.Hoth M, Fanger CM, Lewis RS. Mitochondrial regulation of store-operated calcium signaling in T lymphocytes. J Cell Biol. 1997;137:633–648. doi: 10.1083/jcb.137.3.633. [DOI] [PMC free article] [PubMed] [Google Scholar]
- 46.Tsarfaty I, Altstock RT, Mittelman L, Sandovsky-Losica H, Jadoun J, Fabian I, Segal E, Sela S. Confocal microscopy in the study of the interactions between microorganisms and cells. In: Rosenberg E, editor. Microbial Ecology and Infectious Disease. Washington, DC: ASM Press; 1999. pp. 75–88. [Google Scholar]
- 47.Melner MH, Sawyer ST, Evanochko WT, Ng TC, Glickson JD, Puett D. Phosphorus-31 nuclear magnetic resonance analysis of epidermal growth factor action in A-431 human epidermoid carcinoma cells and SV-40 virus transformed mouse fibroblasts. Biochemistry. 1983;22:2039–2042. doi: 10.1021/bi00278a001. [DOI] [PubMed] [Google Scholar]
- 48.Pelech SL, Vance DE. Regulation of phosphatidylcholine biosynthesis. Biochim Biophys Acta. 1984;779:217–251. doi: 10.1016/0304-4157(84)90010-8. [DOI] [PubMed] [Google Scholar]
- 49.Daly PF, Lyon RC, Faustino PJ, Cohen JS. Phospholipid metabolism in cancer cells monitored by 31P NMR spectroscopy. J Biol Chem. 1987;262:14875–14878. [PubMed] [Google Scholar]
- 50.Kaibori M, Kwon AH, Oda M, Kamiyama Y, Kitamura N, Okumura T. Hepatocyte growth factor stimulates synthesis of Iipids and secretion of lipoproteins in rat hepatocytes. Hepatology. 1998;27:1354–1361. doi: 10.1002/hep.510270523. [DOI] [PubMed] [Google Scholar]
- 51.Burt CT, Ribolow HJ. A hypothesis: non-cyclic phospho-diesters may play a role in membrane control. Biochem Med. 1984;31:21–30. doi: 10.1016/0006-2944(84)90054-1. [DOI] [PubMed] [Google Scholar]
- 52.Warburg O. On the origin of cancer cells. Science. 1956;123:309–314. doi: 10.1126/science.123.3191.309. [DOI] [PubMed] [Google Scholar]
- 53.Larrick JW, Wright SC. Cytotoxic mechanism of tumor necrosis factor alpha. FASEB J. 1990;4:3215–3223. doi: 10.1096/fasebj.4.14.2172061. [DOI] [PubMed] [Google Scholar]
- 54.Sugarman BJ, Aggarwal BB, Hass PE, Figari IS, Palladino MA, Jr, Shepard HM. Recombinant human tumor necrosis factor alpha: effects on proliferation of normal and transformed cells in vitro. Science. 1985;230:943–945. doi: 10.1126/science.3933111. [DOI] [PubMed] [Google Scholar]
- 55.Davidson NE, Gelmann EP, Lippman ME, Dickson RB. Epidermal growth factor receptor gene expression in estrogen receptor-positive and negative human breast cancer cell lines. Mol Endochnol. 1987;1:216–223. doi: 10.1210/mend-1-3-216. [DOI] [PubMed] [Google Scholar]
- 56.Filmus J, Pollak MN, Cailleau R, Buick RN. MDA-468, a human breast cancer cell line with a high number of epidermal growth factor (EGF) receptors, has an amplified EGF receptor gene and is growth inhibited by EGF. Biochem Biophys Res Commun. 1985;128:898–905. doi: 10.1016/0006-291x(85)90131-7. [DOI] [PubMed] [Google Scholar]
- 57.Carpenter G, Cohen S. Epidermal growth factor. Annu Rev Biochem. 1979;48:193–216. doi: 10.1146/annurev.bi.48.070179.001205. [DOI] [PubMed] [Google Scholar]


