

Abstract
A three-dimensional biomechanical model of tissue deformation was developed to simulate dynamic vocal fold abduction and adduction. The model was made of 1721 nearly incompressible finite elements. The cricoarytenoid joint was modeled as a rocking–sliding motion, similar to two concentric cylinders. The vocal ligament and the thyroarytenoid muscle’s fiber characteristics were implemented as a fiber–gel composite made of an isotropic ground substance imbedded with fibers. These fibers had contractile and/or passive nonlinear stress–strain characteristics. The verification of the model was made by comparing the range and speed of motion to published vocal fold kinematic data. The model simulated abduction to a maximum glottal angle of about 31°. Using the posterior-cricoarytenoid muscle, the model produced an angular abduction speed of 405° per second. The system mechanics seemed to favor abduction over adduction in both peak speed and response time, even when all intrinsic muscle properties were kept identical. The model also verified the notion that the vocalis and muscularis portions of the thyroarytenoid muscle play significantly different roles in posturing, with the muscularis portion having the larger effect on arytenoid movement. Other insights into the mechanisms of abduction/adduction were given.
I. INTRODUCTION
Vocal fold dynamics can be treated in two parts: (1) large and relatively slow deformations occurring when the vocal folds abduct/adduct or elongate as a result of moving boundaries or internal muscle forces, and (2) small and relatively fast deformations occurring when the tissue is driven into oscillation. These two parts are referred to as, respectively, vocal fold posturing and vocal fold vibration. In speaking and singing, vocal fold posturing occurs in a non-periodic (but ultimately always cyclic) fashion at frequencies of less than 10 Hz. Flow-induced vocal fold vibration, on the other hand, usually occurs at 100 Hz or more. Although posturing and vibration can be treated separately, many aspects of vibration (e.g., pitch, loudness, and voice quality) are dependent on posturing.
Understanding vocal fold posturing is important to both speech scientists and clinicians. For example, vocal fold posturing has been shown to affect the intensity of the voice (Titze and Sundberg, 1992; Murry et al., 1998), the pitch (Hirano et al., 1970; Honda, 1983), devoicing (Yoshioka, 1981), and ventilation or glottal aspiration (Tomori et al., 1998). Vocal fold abdutory/adductory posturing is also important for swallowing and effort closure of the airway (e.g., for lifting). Adduction of the vocal folds has been hypothesized to be the key to optimizing airflow–tissue interaction in vocal onset and, thus, self-sustained oscillation (Titze, 1988; Cooke et al., 1997).
The study of vocal fold posturing is also essential for improved phonosurgery. Unilateral vocal fold paralysis, frequently the consequence of injury to or infection of the recurrent laryngeal nerve (or the vegus nerve from which it branches), can significantly impair an individual’s speech, swallowing, and ability to protect the airway. A common phonosurgical treatment of unilateral vocal fold paralysis is vocal fold medialization, an artificial posturing of a vocal fold to set the shape and stiffness so that phonation is improved (Neuman et al., 1994). With an increased understanding of the mechanics of abduction/adduction, especially in terms of the local and global stiffness properties of the modified tissue, it is expected that phonosurgical procedures like medialization could be enhanced.
Previous studies of vocal posturing mechanics focused on quantifying the range and direction of arytenoid cartilage motion around the cricoarytenoid joint (CAJ) (Broad, 1968; Kotby et al., 1992). Although such descriptive kinematics provided a logical foundation for understanding CAJ-based posturing, a study of the forces caused by laryngeal connective tissues is needed to establish causal relations between vocal posturing and laryngeal muscle forces. This point was noted by Sanders et al. 1994, who deemed this relationship essential to understanding the full range of vocal fold movements seen during phonation, respiration, and effort closure. Sanders et al. illustrated this point by using an in vivo canine larynx to demonstrate the effects of contracting different portions of one laryngeal muscle, the posterior cricoarytenoid muscle (PCA), on vocal fold posturing. Further, he suggested that there may be as many as four functionally different compartments of the thyroarytenoid (TA) affecting vocal fold mechanics. Therefore, describing orientations and distributions of the portions of the different laryngeal muscles, such as the TA, is a necessary step in understanding CAJ-based vocal fold posturing.
Creating a biomechanical model of CAJ-based vocal posturing is important because it can quantify the effects of individual and coordinated muscle contractions on arytenoid cartilage movements and vocalization. Farley (1996) created this type of model to study the dependence of the fundamental frequency of phonation on glottal width and closure. The posturing portion of his model was based on rigid body mechanics, from which he calculated pitch for a given arytenoid posture. Although he was able to use his model to predict glottal width from muscle activation, there were two areas that he did not address. First, Farley reported only static results; he did not address the dynamics of vocal posturing, such as the speed of glottal width change. Second, because his model was based on rigid body mechanics, he did not address tissue deformation. These two limitations restricted the type of vocal pathologies for which Farley’s model could be applied; for example, it could not simulate the effect of a polyp or scar on fundamental frequency. In contrast, a dynamic model based on deformable body theory and solved by the finite element method (FEM) could include localized changes in the vocal fold geometry, providing the foundation for simulating a wide range of disorders.
FEM has previously been deployed to simulate other speech organs, such as the tongue (Wilhelms-Tricarico, 1995), the velum (Berry et al., 1999), and the vocal folds in oscillation (Gunter, 2003; Alipour et al., 2000; Dang and Honda, 1998). It is noteworthy that only Wilhelms-Tricarico’s model of the tongue included large deformation theory with tissue properties based on fiber directions. In particular, FEM models of the vocal folds have thus far been based only on small deformation theory, which are not valid for the large movements seen in vocal fold posturing without making additional assumptions (see Sec. II A). Thus, the approach of Wilhelms-Tricarico’s motivated this study.
The goal of this research was to advance the modeling of vocal fold posturing in three dimensions; this study specifically focuses on large deformation abduction/adduction posturing with the fibrous tissues intrinsic to the vocal folds playing a key role. In light of this goal, the specific research question was as follows: To what degree can a three-dimensional biomechanical model of vocal fold abduction/adduction match the dynamics of human vocal fold abduction/adduction (in terms of glottal angle), with percent muscle activation as the driving inputs? A model was created that focused on the motion of the arytenoid cartilages and included vocal fold deformation and intrinsic fibrous tissues. Fundamental to the model’s development was the creation of a fiber–gel composite, which included the contribution of one-dimensional muscle fibers superimposed on a three-dimensional isotropic gel. The mathematical steps used in the creation of this fiber-gel were detailed, and the model’s output was then compared to the existing data on the glottal angle and the speed of glottal closure.
II. METHODS
Following general FEM procedures, there were six steps in the model’s creation: (1) definition of dynamic finite element equations; (2) identification of the target geometry (anatomical properties); (3) determination of constitutive equations and material properties (e.g., tissue elasticity, density, and incompressibility); (4) specification of the boundary conditions and constraints; (5) implementation of the finite elements (discretization of the domain and assembly of element equations); and (6) solution of the model with numerical results. Quantities such as fiber length, area, and orientation were classified as anatomical properties, while passive and contractile characteristics of the intrinsic fibers were classified as material properties.
A. Finite element equation definitions
The FEM equations had to adequately represent the large deformations (or finite strains) that occur in vocal posturing. It was predetermined that the equations would be based on eight-node hexahedral elements and hexahedral-reduced forms (prism and pyramid shapes). Some of the critical equations are provided below (as an overview), along with added details of a large-deformation extension; the specific FEM equations used, based on more general derivations found in intermediate FEM texts (e.g., Cook et al., 1989; Bathe, 1996), can be found in Hunter (2001).
The derivation of these FEM equations commences with the potential energy Π of the target geometry,
| (1) |
where U is the strain energy and R is the virtual work of the system in deformation. The strain energy was computed as a volume integral of the strain energy density U0,
| (2) |
which can be thought of as a three-dimensional extension of the elastic energy in a spring obeying Hooke’s Law: U0 = 1/2 kx2 (the stiffness matrix S is comparable to k, while strain vector ∊ is similar to x).
The entire system of equations is ultimately represented by a matrix version of the general equation of motion,
| (3) |
which is derived from a constitutive equation for tissue (see Sec. II C), a small-strain vector ∊, a trial solution, and boundary conditions (described in Sec. II D). Terms in this equation are a symmetric stiffness matrix K, displacement vector u, damping matrix D, mass matrix M, and vector R (representing the boundary conditions and applied forces). The dimensions of these matrices are dependent on the number of nodes (solution points) and the number of degrees of freedom. The damping matrix D comes from a proportion of the mass and stiffness matrices,
| (4) |
where α and β are, respectively, Rayleigh mass and Rayleigh stiffness damping. The Rayleigh terms are frequency dependent and related to a common damping ratio ζ (e.g., Bathe, 1996, p. 797),
| (5) |
Since ζ is a directly measurable quantity, α and β can be calculated from two measures of the damping, ζ1 and ζ2 , at two different frequencies, f1 and f2.
However, because Eq. (3) is based on small strain assumptions, it cannot adequately represent the large deformations that occur in vocal fold posturing, nor can it represent nonlinear material behavior, which is also found in the vocal folds. In this study, the Newton–Raphson method (e.g., Bathe, 1996, p. 755) was used to allow for large deformation and nonlinear material behavior. This specific method used an iteration technique to solve the system during static situations, or at a single time step in a dynamic solution,
| (6) |
The iteration technique begins with the calculation of the out-of-balance load vector ΔR, or the difference between the applied loads and the restoring force F,
| (7) |
Given ΔR, an incremental displacement Δu is calculated from Eq. (6) and convergence is checked. If Δu is not sufficiently small, ΔR is reevaluated and the stiffness matrix is updated,
| (8) |
At this point the process repeats itself with a new stiffness matrix. Iterations continue as needed until a preset tolerance is met.
By using the iteration technique in finite element integration, large deformations could be accounted for in a single time step. Solving Eq. (3) with the time dependence was accomplished using the FEM difference technique (Alipour et al., 2000). A smaller time step in the finite difference solution would reduce the number of iterations needed in the Newton–Raphson technique. However, with large deformations, the need for a stiffness matrix correction would never be negated regardless of how small the time steps became; only the frequency of needed corrections would be reduced.
B. Target geometry (anatomical properties)
The targeted geometry of the posturing model was a human male larynx, with the reference frame being the cricoid cartilage (Fig. 1). The primary anatomical focus was the tissue between the glottis and the thyroid cartilage, including the arytenoid cartilage. The model’s y axis was anterio-posterior (front to back) with y = 0 at the tip of the cadaveric vocal process; the x axis was medio-lateral (left to right), while the z axis was inferio-superior (down to up). The unstressed (neutral) tissue state was cadaveric. With geometric symmetry across the midplane assumed, the model consisted of only the right vocal fold, similar to a hemilarynx (Fig. 2).
FIG. 1.
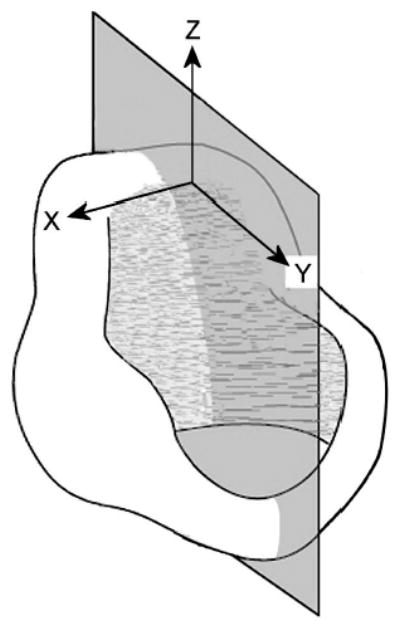
Coordinate system from vantage point of cricoid cartilage (after Selbie et al., 1998).
FIG. 2.
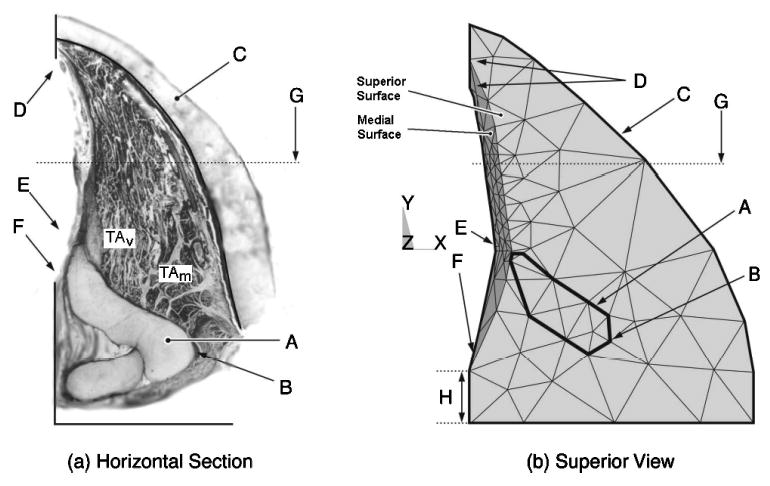
The right vocal fold: (a) horizontal slice at the level of the vocal process; and (b) the view of the model from above. Vocal fold landmarks: A—arytenoid cartilage; B—muscular process; C—thyroid cartilage; D—anterior commissure; E—vocal process; F—posterior commissure; G—midmembranous vocal fold line; and H—posterior border.
The thyroid cartilage was selected to be the outer edge of the model. The shape of the thyroid cartilage was derived from average measurements reported by Eckel and Sittel (1995). The shape and position of the vocal fold anterior commissure (Fig. 2, point D) and the vocal process (point E) were averaged from Eckel and Sittel (1995), Eckel et al. 1994, and Hirano and Sato (1993). The posterior glottis was determined solely from photographs of histological slices (Hirano and Sato, 1993).
The midmembranous medial curvature (Fig. 3), which was based on the canine vocal fold (Tayama et al., 2002), extended from the vocal process (Fig. 2, point E, 1.5 mm from the midline) to near the anterior commissure (points D, superior and inferior points shown), with a membranous length of approximately 13 mm. A smooth transition at both ends of the fold was applied via a nonplanar Coons patch (a surface patch between four arbitrary boundary curves). The inferior border of the model was defined at the base of the TA muscle (Fig. 3) (as defined by Tayama et al., 2002). The model’s entire superior surface was initially simulated to be flat.
FIG. 3.
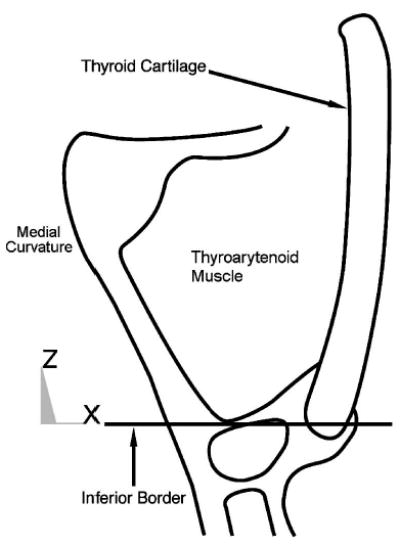
Schematic drawing of midmembranous coronal section of vocal fold with the lower border of the model’s target area labeled.
In the modeled arytenoid cartilage, the distance between the vocal process and muscular process was taken from nine human male cartilages (Tayama et al., 2001). The arytenoid cartilage height was trimmed at the vocal fold superior surface so that it would not protrude above the vocal fold. To simulate the effect of the CAJ, the arytenoid’s CAJ facet was extended inferiorly (4 mm) into the space where the cricoid cartilage would normally be (further details provided in Sec. II D).
The only ligament modeled was the vocal ligament. Muscle tissue included the four intrinsic laryngeal muscles attached to the arytenoid: the TA, the PCA, the interarytenoid (IA), and the lateral cricoarytenoid (LCA). The two bellies of the TA muscle, the thyrovocalis (TAV), and the thyromuscularis (TAM), were treated separately. TA fiber bundles (with measured insertion points, direction cosines, lengths, and areas taken from six human cadaver larynges; Cox et al., 1999) were grouped into five macrobundles (which were shared between the TAM and TAV); individual direction cosine averages for each of the five macrobundles only approximated the rule l2+m2+n2 = 1 (±0.06). The lengths, areas, and direction cosines of the PCA, LCA, and IA were taken from eight canine larynges (Mineck et al., 2000). The average insertion points of the PCA and LCA were attached to the muscular process, while the IA was attached at the most posterior arytenoid position, which represents the likely point at which the IA acts on the arytenoid (given the sling-like wrapping of the IA around the arytenoid).
C. Constitutive equations and material (tissue) properties
Tissues in the model were classified as either fibrous or nonfibrous. Fibrous tissues included the vocal ligament and intrinsic vocal fold muscles. Nonfibrous tissues included the cartilages, mucosa, superficial layer of the lamina propria (excluding the vocal ligament), and other miscellaneous tissues. To quantify the mechanics of fibrous and nonfibrous tissue deformations, an individual constitutive equation (CE) was defined for each. In the model, the various tissues’ material properties (material-specific parameters in the CEs) were obtained from the literature.
1. Constitutive equations
The relation between the stress and strain of a tissue was represented by a CE. Three assumptions about vocal tissues were made in defining the CEs used in the model: (1) all tissue was nearly incompressible; (2) all tissue was isotropic; and (3) fibrous tissues were a superposition of contractile or other fibrous characteristics onto isotropic tissues. Isotropic tissue was described by the three-dimensional Hooke’s law. In the familiar one-dimensional linear system, Hooke’s law is σ = E∊, where σ and ∊ represent the stress and strain, respectively, and E is the tangent Young’s modulus (a measure of a tissue’s stiffness). The three-dimensional Hooke’s law (which can be found in many variations in intermediate mechanics texts) takes into account both shear and normal components of stress and strain. For the symmetric shears in an isotropic material, Hooke’s law can be written in matrix notation, which is ideal for FEM (Cook et al., 1989),
| (9) |
where the following submatrices are defined,
| (10) |
| (11) |
In these equations, μ is the shear modulus, which is related to E by the Poisson’s ratio ν (a measure of a material’s compressibility),
| (12) |
After the substitution of Eqs. (10)–(12), the material parameters in Eq. (9) are E and ν.
Fibrous tissues intrinsic to the vocal folds contain both elastin and collagen fibers in their extracellular matrix; they also have a nonlinear stress–strain relationship; hence a nonlinear E. Titze (1996) defined the axial passive fiber stress σp for a one-dimensional laryngeal fiber as a piecewise static stress–strain relationship composed of a linear and an exponential portion. The CE is continuous, as is its first derivative,
| (13) |
where σ0 is the stress at zero strain (representing the prestrained state of the laryngeal fibers), σ2 is a scale factor for the exponential function, B is an exponential strain constant, ∊1 is the strain at zero stress, ∊2 is the strain at which the nonlinear exponential function begins, and ∊y is the axial strain (independent variable). The nonlinear tangent Young’s modulus is the derivative of Eq. (13) with respect to strain,
| (14) |
In the dynamic case, Eqs. (13) and (14) are used in a differential equation that also includes viscous losses. Titze (1996), using the classic Kelvin model [e.g., the lower part of Fig. 4(a)], defined a differential equation to represent an arbitrary tissue with both an active (contractile) and a passive component with parallel stiffness kp , series stiffness ks , and internal viscous damping d. Titze defined the dynamic differential relationship between ∊y and total axial stress σT as
FIG. 4.
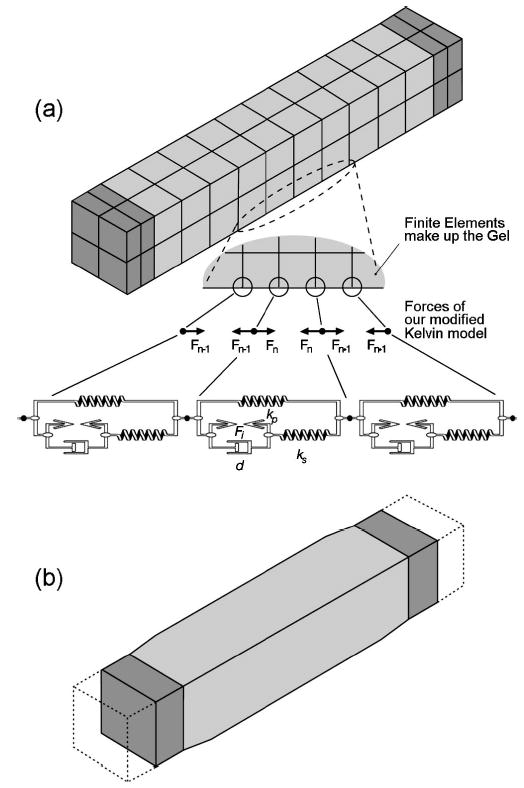
A model of the thyroarytenoid muscle bundle with cartilage on both ends (shaded): (a) forces from our modified Kelvin fiber model superimposed on specific nodes in series to add viscous losses and contraction forces; and (b) contraction of the modeled thyroarytenoid muscle bundle with the dotted line depicting the initial position.
| (15) |
where ts is a series time constant, tp is a parallel time constant, σp is the passive stress [Eq. (13)], and is the axial strain rate. Work cycle losses in Eq. (15) are represented by product terms, which include the time constants. The two time constants are defined in terms of stiffness and damping components.
| (16) |
| (17) |
Unlike passive-only tissue, muscle tissue can internally generate stress, which then acts on the surrounding structure. The active stress σa in a muscle is created from the force generated by overlapping proteins (actin and myosin); it is dependent not only on strain, but also strain rate and activation (a in percent: 0 to 100). Wilhelms-Tricarico (1995) specified the active stress CE in product form,
| (18) |
In Eq. (18), σm is a constant defining the maximum contractile stress a muscle can produce. Functions and f(∊y) depend on the strain rate and strain, respectively, and define the nature of the active components of the muscle; the piecewise function , adopted from Wilhelms-Tricarico (1995), is dependent on the strain rate and maximum strain rate ,
| (19) |
The function f(∊y), a stress–strain factor, is modeled as a polynomial from experimental data (Titze, 1996),
| (20) |
where ∊m is the strain at maximum contractile stress, and b is a coefficient.
Internal contractile stress is related to active stress through a differential equation that contains an empirically derived internal contraction time ti ,
| (21) |
The total stress within a fiber is now the internal active stress, σi , added to the passive stress from Eq. (15),
| (22) |
Equations (21) and (22) then represent our complete modified Kelvin fiber model, which includes a muscle fiber’s active and passive stress. This fiber model, used in conjunction with the three-dimensional isotropic CE above, is the basis for the three-dimensional fibrous tissues in the FEM posturing model.
2. Material properties
Material properties (tissue-specific parameters from the CEs) were listed in Tables I, II, and III. All vocal tissues in the model were nearly incompressible, ν = 0.47 (0.5 being theoretically correct for incompressible materials). All tissues were also assigned a density ρ of 1.043 grams per cubic centimeter, as measured by Perlman (1985) for laryngeal tissue. Using Eq. (5), Rayleigh mass and stiffness quantities (α = 32.3 and β = 6.87 × 10⁻⁴) were calculated from the reported median of two ζ ranges (ζ = 0.15 at 30 Hz and ζ = 0.3 at 140 Hz) (Chan and Titze, 1998).
TABLE I.
General properties as needed by the finite element model.
| Parameter description | Symbol | Cartilage | Misc. tissue | Ligament | TA |
|---|---|---|---|---|---|
| Young’s modulus | E | 30 MPa | 20.7 kPa | See Table II | See Table II |
| Poisson’s ratio | ν | 0.47 | 0.47 | 0.47 | 0.47 |
| Rayleigh mass | α | 32.3 | 32.3 | 32.3 | 32.3 |
| Rayleigh stiffness | β | 6.87 × 10⁻⁴ | 6.87 × 10⁻⁴ | 6.87 × 10⁻⁴ | 6.87 × 10⁻⁴ |
| Density | ρ | 1.043 g/cm3 | 1.043 g/cm3 | 1.043 g/cm3 | 1.043 g/cm3 |
| Cross-sectional area | A | NA | NA | 5 mm2 | 63.8 mm2 |
TABLE II.
Passive material properties for the one-dimensional Titze (1996) fiber model.
| Equation | Parameters description | Symbol | Ligament | TA (canine) |
|---|---|---|---|---|
| 13–15 | Passive stress at resting length | σ0 | 13 kPa | 2 kPa |
| 13–15 | Scaling of exponential stress | σ2 | 45 kPa | 55 kPa |
| 13–15 | Strain at zero stress | ∊1 | −0.5 | −0.5 |
| 13–15 | Strain at exponential stress | ∊2 | 0.2 | 0.2 |
| 13–15 | Exponential strain constant | B | 6.8 | 4.5 |
| 15 | Parallel time constant | tp | 0.08 s | 0.050 s |
| 15 | Series time constant | t2 | 0.07 s | 0.044 s |
TABLE III.
Active (contractile) material properties for the one-dimensional Titze (1996) fiber model.
| Equation | Active parameter description | Symbol | TA (canine) |
|---|---|---|---|
| 18 | Maximum active stress | σm | 105 kPa |
| 19 | Maximum strain rate | 6.0 s−1 | |
| 20 | Coeff. for active stress–strain | b | 1.07 |
| 20 | Strain at max. active stress | ∊m | 0.4 |
| 21 | Activation time | ti | 0.01+0.05∊y s |
Cartilage material was specified with a linear E of 30 MPa (Li, 1995). All other nonfibrous tissues were assigned an E value of 20.7 kPa, as measured from canine laryngeal muscle tissue at low strains (Alipour-Haghighi and Titze, 1991). The fibrous TA muscle’s nonlinear E [Eq. (14)] and the time constants [Eqs. (16) and (17)] were obtained by fitting the equation parameters to canine stress–strain data (Fig. 5) (Table II, from Titze, 1996). The vocal ligament’s nonlinear E was obtained from human ligament data in a similar fashion (Min et al., 1995). The optimization methodology for obtaining the fiber model parameters for all laryngeal muscles from laboratory data is the subject of an ongoing study.
FIG. 5.
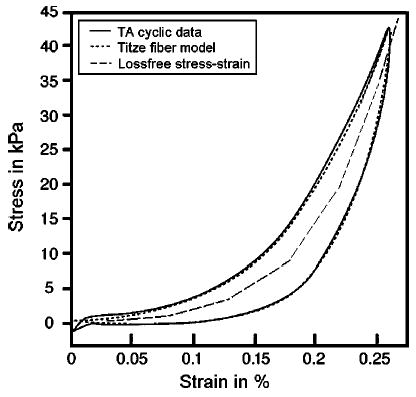
The passive stress–strain response for the canine thyroarytenoid muscle. Shown are (1) measured cyclic (1 Hz) elongation data (solid line); (2) Titze fiber model response after being fit to data (dotted line); and (3) the piecewise stress–strain relation with no viscous losses (dashed line) representing the gel response.
Active material properties were defined as those tissue-specific parameters in Eqs. (18)–(22). To obtain the TA muscle parameters listed in Table III (Titze, 1996), three types of muscle data were needed: (1) a muscle’s twitch response and tetanic contraction; (2) the contraction and relaxation times; and (3) the force–velocity and length–tension relationships. Studies have focused on PCA contraction force and timing (Cooper et al., 1994) as well as IA, LCA, and PCA contraction times (Alipour et al., in preparation). Nevertheless, of the five intrinsic muscles of the larynx, only two (the CT and TA) have been sufficiently measured and quantified so as to fully populate all of the parameters of the fiber model (Titze, 1996; Alipour and Titze, 1999). Therefore, the LCA, IA, and PCA were assumed to have the same material property parameter values as the TA but different anatomical properties (e.g., length and orientation). The fiber model parameters could be optimized to match any specific muscle if the data were available; thus, as ongoing studies are completed, parameter values can be obtained and used to refine the FEM posturing model.
D. Boundary conditions and constraints
Boundary conditions and constraints were used to simplify the FEM solution and to capture the key mechanics of abduction/adduction. The boundary conditions of the posturing model (shown in Fig. 6) consisted of four degree-of-freedom constraints: the inferior (bottom) border in the z direction (dz = 0) (surface 1); the posterior (back) border in the y direction (dy = 0) (surface 2); the shared medial border (left) near the anterior commissure and posterior glottis in the x direction (dx = 0) (surface 3); and the latero-anterior border in all directions (thyroid cartilage, dx = dy = dz = 0) (surface 4). Next, the CAJ was modeled by a constraint along a rocking–sliding axis (Fig. 6, dashed line). The vocal fold’s superior and medial surfaces were allowed to move freely.
FIG. 6.
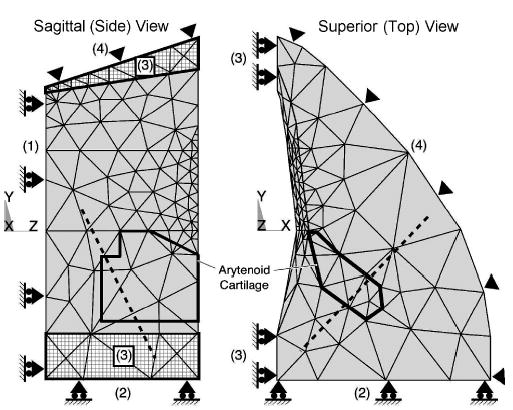
The three-dimensional vocal fold model divided into 1721 elements with only surface element faces shown. Four surface constraints within the model: (1) inferior (bottom) border, (2) posterior (back) border, (3) medial border, and (4) latero-anterior (thyroid cartilage) border. The CAJ axis (dotted line) is shown passing though the arytenoid cartilage (represented by the dark outline).
A simple boundary constraint could not be easily formed from the complex combination of tissues posterior to the arytenoid cartilage (e.g., IA and PCA, ligaments, membranes, and portions of the cricoid cartilage). Therefore, the back border (Fig. 6, surface 2) was padded with two millimeters of isotropic soft tissue, which allowed the arytenoid to move with an effective soft tissue drag that simulated this complex combination of tissues (Fig. 2, point H). At this back boundary (Fig. 6, surface 2), the surface was constrained in the anterior–posterior direction (dy = 0).
The CAJ is essential to abduction/adduction posturing; therefore, the model was designed to preserve the key movement seen in the joint, a rocking–sliding motion (Selbie et al., 1998). This motion was captured by extending the modeled arytenoid cartilage inferiorly beyond the anatomical facet location and then constraining the extension with a rocking–sliding axis. This axis was obtained from Selbie et al., who calculated various joint axes about which the arytenoid rocked and slid by analyzing the shape of the facets. From the reported orientation of the joint axes, a rocking axis was calculated in terms of direction cosines for the right half of larynx: l = 0.609, m = 0.619, and n = −0.495. The axis appeared about 4 mm below the human CAJ facet and 2.5 mm below the lowest TA fiber insertion point in the posturing model.
E. Finite element implementation
A commercial FEM software package, ANSYS 5.7, was used to construct the model and solve the FEM equations. Key to the FEM implementation was simulating fibrous tissues as a fiber–gel composite, which was created by superpositioning fiber characteristics onto isotropic finite elements through special subroutines written in the ANSYS Parametric Design Language. The ANSYS transient option was used to include time dependence; nonlinearities were solved via the ANSYS Newton–Raphson option.
Modeling more than one type of these nonlinearities at a time in FEM increases computational costs significantly. Vocal fold posturing has not only large-strain geometric nonlinearities (i.e., large deformations), but also material behavior nonlinearities (e.g., stress–strain, as in Fig. 5). Therefore, computational costs greatly increase because, for a single time step solution, multiple iterations are required for both of these types of nonlinearities.
1. Fiber–gel implementation
Because of the complexity of the vocal fold posturing model, a submodel of an isolated TA muscle was used to show how fiber–gel was created. The same principles were then employed by the larger posturing model to simulate intrinsic vocal fold fibers.
The submodel was designed in ANSYS using 56 elements (eight-node brick) with transient and Newton–Raphson options enabled. The geometry was a simple column [Fig. 4(a)] that measured 18 mm, the approximate length of human male TA strands (Cox et al., 1999); the cross-sectional area was 12.25 mm2 (2.5 mm to a side), slightly more than half the average reported TA area. Portions of the thyroid and arytenoid cartilages were represented by cartilage attachments (length of 1.8 mm) placed at the ends of the muscle. These end elements were assigned material property values, as specified in Table I. The cartilages were sufficiently stiff so that superimposed fiber forces applied at the cartilage–muscle interface would cause negligible deformations to the cartilage. The muscle elements were designed with values from Table I; however, a nonlinear Young’s Modulus [Eq. (14)] (Table II) was implemented in a piecewise fashion using an ANSYS Material Table (similar to the dashed stress–strain curve, Fig. 5). Therefore, if the submodel (currently only a gel) were cyclically elongated at this point in its creation, it could not simulate the TA work-cycle response (as seen in Fig. 5, solid).
Fibrous characteristics were next added to the gel by superimposing viscous losses and contractile properties onto the lines of nodes (or solution points) parallel to the muscle’s length. If any two adjacent nodes along one of these parallel lines were examined, these nodes would represent the end nodes of a single fiber model [Fig. 4(a)]. Fibrous characteristics superimposed onto the two nodes were in the form of forces calculated by the fiber model; these forces were always directed toward the adjacent node of the pair. Each of the four outer edges of the rectangular TA muscle was designed with fiber characteristics using ten fiber models in series. Thus, the TA submodel had 40 fiber models oriented in four lines, with the resulting forces superimposed on their respective nodes.
Two steps were used to solve the TA submodel for a given time increment. First, multiple Newton–Raphson iterations were used in the FEM solution for the deformation of the finite elements. Second, vector force magnitudes were calculated by the fiber model from the resulting deformation. These vector forces were added by (1) recording the new fiber–gel node locations; (2) calculating the fiber strain and strain history for each of the 40 small fiber models; and (3) applying the losses and contractile forces to the nodes. However, because the finite element gel was constructed with nonlinear (loss-free) passive properties (which were also accounted for in the fiber model), the forces applied to the nodes had to be reduced by the amount of passive force already in existence within the elements.
The differential equations of a single fiber model [Eqs. (21) and (22)] were solved by a fourth-order Runge–Kutta routine, requiring a time sampling of approximately 1000 Hz to be stable. In solving the TA submodel (consisting of FEM equations and 40 fiber models), the solution time sampling was allowed to be variable in order to keep the overall solution stable while minimizing computational time; the average time sampling was approximately 1100 Hz, with each time sampling costing about one second of CPU time on an HP B2600 workstation (i.e., one second of dynamic solution expended about 1100 s of CPU time).
The TA submodel was verified by testing the muscle for cyclic elongation (1 Hz) and contractile effects. The results were as desired: the elongation’s resulting stress/strain curve mirrored the fiber model (similar to Fig. 5), and the contraction shortened and bulged the muscle appropriately [Fig. 4(b)].
2. Posturing model implementation
With the TA submodel created and the fiber–gel composite tested, the next step was to follow a similar pattern to implement the larger posturing model in ANSYS. The vocal fold’s geometry (described in Sec. II B) was divided into hexahedral elements and hexahedral-reduced forms (prism and pyramid shapes) (Fig. 6, only surface element faces visible). The elements near the vocal fold margin were more finely structured to show greater deformation detail because they were of the most interest to future glottal shape studies. All elements were assigned their respective material properties from Tables I–III.
Boundary conditions and constraints (described in Sec. II D) were implemented and applied to the nodes as degree-of-freedom constraints. The CAJ’s rocking–sliding axis was modeled using a constraint equation, which was assigned only to those nodes that were both on this axis and within the arytenoid’s extended region (below the actual CAJ facet). The constrained motion of the individual nodes then combined to constrain the entire CAJ motion to a rocking–sliding cylindrical path.
The PCA, IA, and LCA were treated as point forces acting on the arytenoid (Fig. 7). These point forces were calculated from the fiber model using properties from Tables I–III. Although the muscles were only point forces, a virtual length was created by calculating the distance between the point at which force was applied on the arytenoid and a fixed point in space that represented the other end of the muscle (based on known lengths and orientations) (Table IV). These virtual lengths changed with the motion of the arytenoid, by which changes a strain and strain history could be calculated.
FIG. 7.
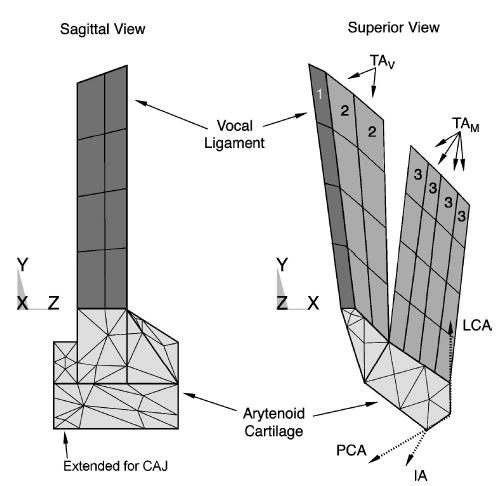
The modeled arytenoid cartilage and fiber–gel composite volumes (only the outer element faces are shown). Three types of modeled fiber–gels: TAM , TAV , and vocal ligament. Intrinsic adductor and abductor muscles (PCA, LCA, and IA) attached near the muscular process. Dotted vectors in the superior view represent the applied forces (x−y component shown only) of these three muscles.
TABLE IV.
Anatomical properties of the canine abductor and adductor muscles (PCA, LCA, and IA) (Mineck et al., 2000) and human TA muscle: the direction cosines, lengths, and cross-sectional areas of each muscle. The TA muscle fibers were grouped into five muscle bundles of nearly equal cross-sectional areas (TA total area = 63.8 mm2), based on fiber measures as derived from multiple sources (as stated in the text).
| Direction cosines
|
|||||
|---|---|---|---|---|---|
| Fiber direction | l | m | n | Length (mm) | Cross-sectional area |
| PCA | −0.666 | −0.228 | −0.710 | 11.5 | 34.2 mm2 |
| LCA | −0.158 | 0.902 | −0.403 | 14.4 | 21.2 mm2 |
| IA | −0.692 | −0.627 | −0.358 | 9.4 | 12.1 mm2 |
| TAV | −0.187 | 0.932 | −0.222 | 16.6 | 22% of total |
| −0.135 | 0.945 | −0.213 | 17.9 | 20% of total | |
| −0.129 | 0.963 | −0.169 | 17.8 | 20% of total | |
| TAM | 0.207 | 0.916 | −0.247 | 19.8 | 19% of total |
| 0.288 | 0.9905 | −0.223 | 20.8 | 19% of total | |
The vocal ligament and the TA muscle, both highly fibrous tissues intrinsic to the vocal folds, were designed as fiber–gel composites. The vocal ligament was modeled in a manner similar to the TA submodel discussed above, but with its own parameters (Table I and II) and without active properties. Its position was parallel to the vocal fold’s medial edge (Fig. 7, Volume 1). The TAV (Volume 2) and TAM (Volume 3) were modeled as independent fiber–gel composites. The TAM fibers were oriented in a lateral direction, while the TAV fibers were oriented medially (Table IV).
As was done in the submodel, the total vector forces (from the fiber model) in the TAM, TAV, and vocal ligament had to be reduced by the amount of passive forces already within their finite elements. The cross-sectional areas of the TA fiber–gel in the posturing model (as shown in Fig. 7) were smaller than in the reported literature (Table I); therefore, the passive forces from the finite elements were smaller than the total passive force that should be in the TA. However, because the fiber model already included the total passive forces, the applied vector forces could compensate for these differences.
Like the TA submodel, the solution time sampling was allowed to be variable to maintain stability in the posturing model (consisting of 1721 finite elements with 168 superimposed fiber models). The average time sampling was approximately 1500 Hz, with each time sample costing an average of 36 s of CPU time on an HP B2600 workstation (i.e., one second of a dynamic solution expended approximately 54 000 s of CPU time).
F. Model solution with resulting postural movement measures
Glottal angle, as well as its rate of change, was measured from the model. The glottal angle was chosen as the output measure because it was the only absolute vocal fold measure that could be obtained from humans by the standard clinical endoscopic techniques used to understand vocal fold motion (Omori et al., 1997). As only the right fold was modeled, the glottal angle was defined as twice the angle between the midline and the vocal process excursion with the anterior commissure as the vertex. Locating precise glottal landmark positions is difficult with endoscopic techniques; thus, variations were accounted for by using multiple landmarks from the model to represent a range of potential anterior commissure and vocal process positions. Two possible angle vertices were used, the superior and inferior edges of the anterior commissure [Fig. 2(b), both arrows in point D]; also, two possible vocal process positions were used, the superior edge and the most medial point of the vocal fold at the model’s vocal process (y = 0, at rest) (point E). Therefore, four different glottal half angles were calculated from five points: two possible anterior commissure positions, two possible vocal process positions, and the glottal midline.
III. RESULTS
A. Typical results
Each simulated muscle (i.e., IA, LCA, PCA, TAV, and TAM) was contracted individually with 100% activation. As previously discussed, the fiber model parameters were identical for all of these muscles, even though their anatomical properties were not. The LCA muscle contraction (Fig. 8) demonstrated a typical result of the four glottal angles and angle rates of the other muscles (see all muscle results in Fig. 9). When the LCA contracted, the top surface was deformed, the vocal fold was no longer planar, and the medial surface did not have the uniform curvature of the neutral position [Fig. 8(c)] [see Hunter et al. (in preparation) and Hunter and Titze (2004), for a multimedia representation of the dynamics]. After 100 ms of LCA contraction, the glottis had closed approximately 12.5° from cadaveric [Fig. 8(a)]. Depending on which landmark was used for the angle calculation, the peak angular rate varied between −120° and −150° per second and occurred at about 14.5 ms from LCA muscle activation [Fig. 8(b)]. The same three measures (the total change in glottal angle from the initial or cadaveric position, peak angular rate, and time to peak angular rate) were taken for the other four muscles (Fig. 9).
FIG. 8.
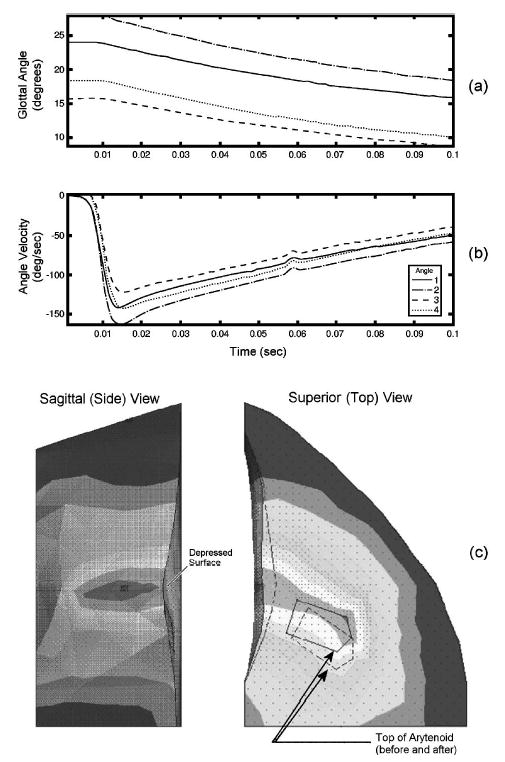
Modeled lateral cricoarytenoid muscle contraction at full activity. Contours of four glottal angle measures taken from different landmark locations shown to 0.1 s (a) glottal angle and (b) the corresponding glottal angle rate (velocity). The magnitude of deformation (c) of the model (shading) showing the topology change from the initial position. Dotted lines represent edges at the initial position. The top of the vocal fold was depressed, as seen on the side view.
FIG. 9.
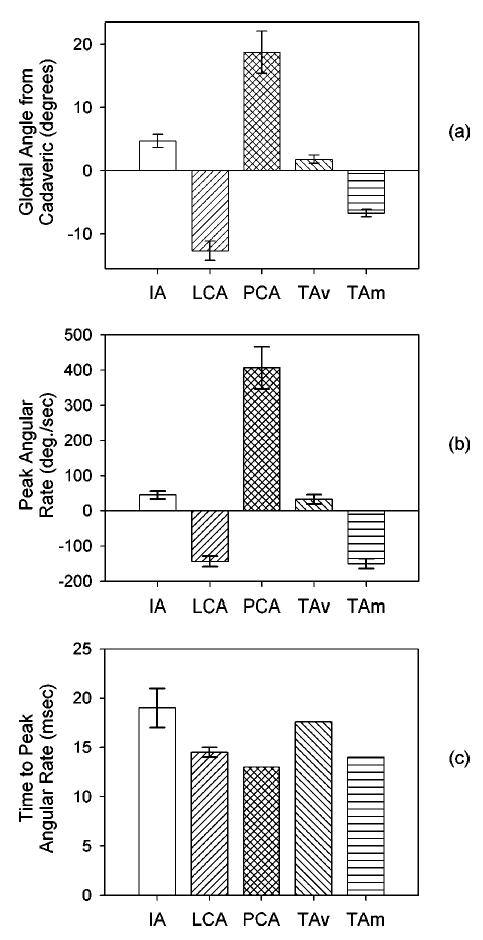
The average of all four possible glottal angles variants depict the results of the individual 100% muscle contraction for 0.1 s: (a) the change in the glottal angle from the cadaveric (initial) position; (b) the peak glottal angle rate; and (c) the time from contraction start to the peak glottal angle rate.
B. Validation
Three studies from the literature were used to validate the model’s results. First, Hirano et al. 1988 found in a study of 20 excised human larynges (10 male) that the maximum glottal angle opening for males was an average of 35° (calculated from the maximum simulated abduction). The model had a comparable average maximum glottal angle opening of 31° (±5), as calculated by combining the results of a LCA and PCA contraction (both measured as a change from the cadaveric angle). Second, the dynamic posturing motions of each muscle in the model was nearly completed in all cases at 150 ms. This duration was within the range that Hillel (2001) measured for most abduction/adduction gesture durations (between 125 and 350 ms).
Finally, and most significantly, Cooke et al. 1997 used an endoscope to examine the vocal fold kinematics prior to various glottal onsets (e.g., breathy, normal, and hard). Using the published data provided in this study, the speed of glottal closure could be extracted. The average beginning glottal angle was 20° for the hard onset, which most likely had 100% LCA contraction. Cooke et al. found that the hard onset gesture duration was an average of approximately 0.1 s, where the abduction gesture duration was the time it took for the glottis to move from 80% to 20% maximum distance (or 60% total extent) and the gesture end was either glottal closure or phonatory onset. Assuming that the gesture end occurred with a glottal angle between 0° and 5°, the total gesture motion would be 15° to 20°. The result would be a gesture extent of 9° to 12°, or 60% total extent× (15° to 20° total glottal motion). The average glottal velocity over a gesture duration would then be 90° to 120°/s, or (9° to 12° glottal extent)/0.1 s gesture duration.
Comparing Cooke et al. 1997 to the posturing model, 80% to 20% of the maximum adductor motion (LCA contraction) occurred in about 0.08 s, with a gesture extent of about 7.5°, or 60% total extent × 12.5° total gesture motion. The average glottal angle velocity over the gesture duration was then 94° per second, or 7.5°/0.08 s. Though the average glottal velocity values were only approximate in both cases, the posturing model did closely predict the speed of adduction seen by Cooke et al.
C. Posturing observations and insights
The current model provided three insights into abduction/adduction. First, it is traditionally accepted that the speed of vocal onset/offset gestures depends on differences in the contractile times of laryngeal muscles. Pure physiological studies of the intrinsic laryngeal muscles via fiber typing experiments have suggested that the PCA should be one of the fastest muscles in the laryngeal system (Malmgren et al., 1985) and that the TA muscle should be even faster (Teig et al., 1978; Guida and Zorzetto, 2000). Although the model did not dispute these histological findings, it did suggest that the timing of abduction/adduction gestures and the resultant speed from muscle contractions in this complex multimuscle system is also affected by the passive mechanics of the vocal folds. As each muscle was contracted individually, the modeled abduction/adduction gestures were most sensitive to the PCA contraction, which resulted in the greatest maximum angular speed and the shortest rise time to that maximum speed when compared to the other muscles. The laryngeal muscles in the model were designed with identical material properties; therefore, the differences between the response speed from individual muscle contractions were the consequence of the anatomical and mechanical properties and not the contractile properties.
Further, the model provided insights into the muscle’s participation in opening and closing the glottis. Full glottal opening in the model was accomplished by a PCA contraction, but full glottal closure was not accomplished by any one muscle in isolation. The LCA came closest to closing the glottis, and the TAM also closed it significantly. These findings substantiated the study by Hillel (2001), in which he showed that the PCA could independently open the glottis and that the LCA, IA, and TAM contracted simultaneously to close the glottis.
The third insight provided by the model was that the TAV and the TAM played different roles in abduction/adduction, with the TAM significantly adducting the folds and the TAV just slightly abducting the folds. These different capabilities corroborate the statement by Sanders et al. 1998 that the TA has more than one functionally different compartment. Further, since the TA is connected to both the thyroid cartilage and the arytenoid cartilage, it might be assumed that the movement of the thyroid by the cricothyroid joint (CTJ) would strongly affect arytenoid motion and, thus, abduction/adduction. However, the orientation of the TAV and TAM (Fig. 7) suggests that the CTJ, which elongates the vocal folds primarily in the anterio-posterior direction (with some vertical change), would thereby elongate the TAV more than the TAM . Thus, because the TAV plays little role in abduction, and because the TAV and TAM had opposite effects on the glottal angle, the CTJ movement (acting primarily through the TAV) should have little effect on abduction/adduction. This finding substantiates and provides mechanical insight into the observation of Woodson et al. 1998 that the cricothyroid muscle (CT) does not abduct or adduct the vocal folds; the model validates this observation because the only way for the CT to abduct/adduct the vocal folds would be through the CTJ. It should be noted that although the model shows that the TAV does not play a significant role in abduction/adduction posturing, it does not negate its role in shortening (via the CTJ) and in vocal fold stiffening. Nevertheless, because these two types of posturing were beyond the scope of the current abduction/adduction study, they were not quantified and were left to future studies.
IV. DISCUSSION
The goal of this research was to design a three-dimensional, biomechanical model of laryngeal abduction/adduction. Because of the potential for significant computational costs in creating such a model, certain simplifying assumptions are necessary in order to make the solution practical; nevertheless, it is crucial to balance this need to simplify with the need to maintain those essential characteristics that would otherwise invalidate the model. The current model seemed to capture key characteristics of laryngeal abduction/adduction in promising ways. The simplifications used, however, did impose limitations that create opportunities for future research. Still, expanding the current model beyond straightforward refinements (e.g., improved material property values and differentiated muscle contraction times) would increase the already significant computational costs of the model.
A. Current limitations and future refinements
The posturing model was dependent on material property data, including active and passive muscle behavior. Much of this data was nonlinear (e.g., passive stress–strain curves); further, vocal folds often shorten 30% or elongate 50% from rest during some types of posturing. Therefore, it would not be unusual for vocal tissues to be in their nonlinear stress–strain region, where small changes in strain would produce large changes in stress. When measuring the stress–strain response of nonlinear tissue, an appropriate reference length is often difficult to measure. Because strain is a function of elongation with respect to reference length, errors in measuring the reference length might cause large misrepresentations of a muscle’s passive stress.
These errors could be exacerbated by the prestrained nature of vocal tissues, which have seldom (if ever) been mentioned in literature when defining reference length. Perlman et al. 1984 observed that thyroarytenoid muscles became 22.5% to 41% shorter following dissection from viable tissue samples; other laryngeal muscles showed similar prestrained effects. Therefore, prestrained fibrous vocal tissues at equilibrium within the vocal system are already close to their nonlinear stress–strain region. This issue is particularly significant when modeling the vocal ligament, which has been observed to be more nonlinear than other vocal soft tissues (Min et al., 1995). The posturing model used the ligament data from Min et al., which did not mention prestraining or explain how the reference length, was defined. Given the highly nonlinear nature of the ligament stress–strain curve, misquantifying the prestraining could have had a large effect on the model’s ability to predict the ligament’s contribution to posturing. This limitation becomes particularly important if subsequent laboratory experiments confirm the preliminary observations of vocal ligament prestrain (between 40% and 50%). Until the sensitivity to such errors is known, the posturing model (as well as any other model depending on muscle data), is incomplete.
There are potentially many other ways to refine this model. First, the force representation of the interarytenoid muscle might not have been ideal and, thus, should be refined. All laryngeal muscle forces (except the thyroarytenoid) were simplified to single vector forces acting at a point on the arytenoid cartilage. The human interarytenoid muscle has two parts, the transverse and oblique portions, with the transverse part covering the entire posterior surface of the arytenoid; however, the modeled interarytenoid was based on a canine model that does not have these two portions. Because the two human interarytenoid portions probably have different roles in posturing, the average of the two may be quite different from the average canine interarytenoid orientation.
This limitation might be addressed if future refinements included multiple muscle fiber origin and insertion points for the interarytenoid and muscles other than the already included thyroarytenoid. The raw muscle bundle data studies by Cox et al. 1999 (human and canine thyroarytenoid and cricothyroid muscles) and Mineck et al. 2000 (canine abductory and adductory muscles) have recently become available to the authors for further analysis (only the overall averages were originally reported). The future analysis of these data will provide more details about the individual fibers, rather than just the overall averages; these more complete details would be beneficial to the community for use in models of the vocal folds. In addition, Selbie et al. 2002 used MRI scanning techniques to obtain three-dimensional human laryngeal cartilage geometries; however, only landmark distances were reported. The eventual availability of a full database of geometries and muscle strand measures from these studies would accelerate the refinement and realism of the FEM model.
Furthermore, the complex motion and properties of the cricoarytenoid joint were simplified to a rocking–sliding axis. Although the model captured most of the characteristics of this joint, a rocking–sliding axis is only a first-order approximation and might not have optimally demonstrated the interarytenoid muscle’s contributions to posturing. It is possible that the interarytenoid requires degrees of freedom for the cricoarytenoid joint not represented by the rocking–sliding axis. However, such a revision could not be implemented without more experimental studies of movement restraints.
Future refinements of the model should also include motions other than abduction/adduction posturing, such as vocal fold elongation via the cricothyroid joint. This inclusion would nevertheless add a significant calculation time to an already computationally intensive model unless appropriate simplifications could be made. One possible simplification would be to reduce cricothyroid joint motion to a single degree of freedom like the rigid-body model described by Titze et al. 1988. However, this simplification (which could only elongate the folds) would not take into account the change in the thyroarytenoid’s fiber direction (up and down) as the thyroid rotates with respect to the cricoid. Another option would be to model the entire joint (e.g., thyroid cartilage, cricoid cartilage, and surrounding structure) with finite elements. Nonetheless, adding just the thyroid cartilage to the current model would substantially increase the complexity of the model because of the need to also address the structures and tissues external to the thyroid, as well as their effects on the thyroid (e.g., tissue drag). Therefore, this development was left to a future study.
Another refinement might be to include the respective behavioral differences of the laryngeal muscles. Of the muscles used in this model, only the thryoarytenoid has been sufficiently measured and quantified to fill all of the modified-Kelvin fiber model parameters. The absence of these property differences, however, might have caused some overall misrepresentation of muscle effects. Nevertheless, a necessary first step was to test the physical plant independent of active muscle property differences. Currently, the muscle properties of the lateral cricoarytenoid, posterior cricoarytenoid, and interarytenoid are being studied (Alipour et al., in preparation). Future versions of the model might include differences in muscle contraction and relaxation times.
B. Applications of the model
It is expected that future versions of the model could have applications to vocal pathology and vocal training. For example, one application would be to examine how mechanical stress is distributed throughout the tissue for a given posture (Gunter, 2003). This would be particularly important in studies of abnormalities in which stress is believed to be a contributing factor (e.g., hyperadduction, bowing, and excessive glottalization). Another application might be to model a scar or a tissue augmentation, for which the material properties or local volume could be selectively changed.
Finally, a future model could be used to improve phonosurgical procedures. For example, the model could simulate an arytenoid adduction or thyroplasty, which is used to medialize a paralyzed vocal fold. An optimization might be attempted to find out which technique (or combination of techniques) would deliver the best vocal quality and answer two important questions posed by Neuman et al. 1994: (1) Does variation in suture placement anterior to the thyroid cartilage affect forward tilting of the arytenoid cartilage, thereby allowing for a correction of vocal fold posturing at different vertical levels?; and (2) how do other medialization procedures (e.g., thyroplasties, where an implant pushes the vocal folds medially) affect arytenoid movement?
Acknowledgments
This work was supported by NIDCD grant No. DC04347-03 from the National Institutes of Health.
Contributor Information
Eric J. Hunter, National Center for Voice and Speech, The Denver Center for the Performing Arts, Denver, Colorado 80204.
Ingo R. Titze, National Center for Voice and Speech, Department of Speech Pathology and Audiology, The University of Iowa, Iowa City, Iowa 52242, and National Center for Voice and Speech, The Denver Center for the Performing Arts, Denver, Colorado 80204
Fariborz Alipour, National Center for Voice and Speech, Department of Speech Pathology and Audiology, The University of Iowa, Iowa City, Iowa 52242.
References
- Alipour, F., Titze, I. R., Hunter, E. J., and Tayama, N., (in preparation), “Active and passive properties of canine abduction/adduction laryngeal muscles,” Ann. Otol. Rhinol. Laryngol.
- Alipour F, Titze IR. “Active and passive characteristics of the canine cricothyroid muscles,”. J Voice. 1999;13:1–10. doi: 10.1016/s0892-1997(99)80056-3. [DOI] [PubMed] [Google Scholar]
- Alipour-Haghighi F, Titze IR. “Elastic models of vocal fold tissues,”. J Acoust” Soc Am. 1991;90:1326–1331. doi: 10.1121/1.401924. [DOI] [PubMed] [Google Scholar]
- Alipour F, Berry DA, Titze IR. “A finite-element model of vocal-fold vibration,”. J Acoust” Soc Am. 2000;108:3003–3012. doi: 10.1121/1.1324678. [DOI] [PubMed] [Google Scholar]
- Bathe, K. J. (1996). Finite Element Procedure (Prentice–Hall, Englewood Cliffs, NJ).
- Berry DA, Moon JB, Kuehn DP. “A finite element model of the soft palate,”. Cleft Palate Craniofac J. 1999;36:217–223. doi: 10.1597/1545-1569_1999_036_0217_afemot_2.3.co_2. [DOI] [PubMed] [Google Scholar]
- Broad, D. J. (1968). “Some physiological parameters for prosodic description,” SCRL Monograph Number 3, Speech Communications Research Laboratory, Santa Barbara, CA.
- Chan, R. W., and Titze, I. R. (1998). “Viscosities of implantable biomaterials in vocal fold augmentation surgery,” Laryngoscope 108, 725–731. [DOI] [PubMed]
- Cook, R. D., Malkus, D. S., and Plesha, M. E. (1989). Concepts and Applications of Finite Element Analysis (Wiley, New York).
- Cooke A, Ludlow CL, Hallett N, Selbie WS. “Characteristics of vocal fold adduction related to voice onset,”. J Voice. 1997;11:12–22. doi: 10.1016/s0892-1997(97)80019-7. [DOI] [PubMed] [Google Scholar]
- Cooper DS, Shindo M, Sinha U, Hast MH, Rice DH. “Dynamic properties of the posterior cricoarytenoid muscle,”. Ann” Otol Rhinol Laryngol. 1994;103:937–943. doi: 10.1177/000348949410301203. [DOI] [PubMed] [Google Scholar]
- Cox KA, Alipour F, Titze IR. “Geometric structure of the human and canine cricothyroid and thyroarytenoid muscles for biomechanical applications,”. Ann” Otol Rhinol Laryngol. 1999;108:1151–1158. doi: 10.1177/000348949910801210. [DOI] [PubMed] [Google Scholar]
- Dang, J., and Honda, K. (1998). “A physiologic model of a dynamic vocal tract for speech production,” Technical Report No. 43.70.Aj, 43.70.Bk, ATR Human Information Processing Research Laboratories.
- Eckel HE, Sittel C, Zorowka P, Jerke A. “Dimensions of the laryngeal framework in adults,”. Surg” Radiol Anat. 1994;16:31–36. doi: 10.1007/BF01627918. [DOI] [PubMed] [Google Scholar]
- Eckel HE, Sittel C. “Morphometry of the larynx in horizontal sections,”. Am” J Otol. 1995;16:40–48. doi: 10.1016/0196-0709(95)90008-x. [DOI] [PubMed] [Google Scholar]
- Farley GR. “A biomechanical laryngeal model of voice F-0 and glottal width control,”. J Acoust” Soc Am. 1996;100:3794 –3812. doi: 10.1121/1.417218. [DOI] [PubMed] [Google Scholar]
- Guida HL, Zorzetto NL. “Morphometric and histochemical study of the human vocal muscle,”. Ann” Otol Rhinol Laryngol. 2000;109:67–71. doi: 10.1177/000348940010900113. [DOI] [PubMed] [Google Scholar]
- Gunter HE. “A mechanical model of vocal-fold collision with high spatial and temporal resolution,”. J Acoust” Soc Am. 2003;113:994 –1000. doi: 10.1121/1.1534100. [DOI] [PubMed] [Google Scholar]
- Hillel AD. “The study of laryngeal muscle activity in normal human subjects and in patients with laryngeal dystonia using multiple fine-wire electromypgraphy,”. Laryngoscope. 2001;111:1–47. doi: 10.1097/00005537-200104001-00001. [DOI] [PubMed] [Google Scholar]
- Hirano M., Kiyokawa, K., and Kurita, S. (1988). “Laryngeal muscles and glottic shaping,” in Vocal Physiology: Voice Production, Mechanisms, and Functions, edited by O. Fujimura (Raven Press, Ltd., New York).
- Hirano, M., and Sato, K. (1993). Histological Color Atlas of the Human Larynx (Singular Pub. Group Inc., San Diego).
- Hirano M, Vennard W, Ohala J. “Regulation of register, pitch and intensity of voice”. An electromyographic investigation of intrinsic laryngeal muscles,”. Folia Phoniatr. 1970;22:1–20. doi: 10.1159/000263363. [DOI] [PubMed] [Google Scholar]
- Honda, K. (1983). “Variability analysis of laryngeal muscle activities,” in Vocal Fold Physiology: Biomechanics, Acoustics and Phonatory Control, Denver, CO: The Denver Center for the Performing Arts, edited by I. Titze and R. Scherer.
- Hunter, E. J. (2001). “Three-dimensional biomechanical model of vocal fold posturing,” Ph.D. dissertation, University of Iowa. [DOI] [PMC free article] [PubMed]
- Hunter, E. J., Titze, I. R., and Alipour, F. (in preparation). “Review of range of arytenoid motion compared to models of vocal abduction/abduction,” ARLO.
- Hunter, E. J., Titze, I. R., (2004). “Dynamics of a three-dimensional model of vocal fold abduction/adduction,” NCVS Online Technical Reports, February 2004. Available from URL: http://www.nevs.org/nevs/library/tech
- Kotby MN, Basiouny SE, Amin M, Garrett D, Kirchner JA, Kahane JC. “Pattern of gross displacement of the vocal fold in adduction and abduction movements,”. Acta Oto-Laryngol. 1992;112:349–352. doi: 10.1080/00016489.1992.11665431. [DOI] [PubMed] [Google Scholar]
- Li, S. T. (1995). “Biologic biomaterials: Tissue-derived biomaterials (collagen),” in The Biomedical Engineering Handbook, edited by J. D. Bronzino (CRC Press, Boca Raton), pp. 627–647.
- Malmgren, L. T., Gacek, R., and Etzler, C. A. (1985). “Muscle fiber types in the human posterior cricoarytenoid muscle: A correlated histochemical and ultrastructure morphometric study,” in Vocal Fold Physiology: Biomechanics, Acoustics and Phonatory Control, Denver, CO, The Denver Center for the Performing Arts, edited by I. Titze and R. Scherer, pp. 41–56.
- Min YB, Titze IR, Alipour-Haghighi F. “Stress–strain response of the human vocal ligament,”. Ann” Otol Rhinol Laryngol. 1995;104(7):563–569. doi: 10.1177/000348949510400711. [DOI] [PubMed] [Google Scholar]
- Mineck CW, Tayama N, Chan R, Titze IR. “Three-dimensional anatomic characterization of the canine laryngeal abductor and adductor musculature,”. Ann” Otol Rhinol Laryngol. 2000;109:505–513. doi: 10.1177/000348940010900512. [DOI] [PubMed] [Google Scholar]
- Murry T, Xu JJ, Woodson GE. “Glottal configuration associated with fundamental frequency and vocal register,”. J Voice. 1998;12:44–49. doi: 10.1016/s0892-1997(98)80074-x. [DOI] [PubMed] [Google Scholar]
- Neuman TR, Hengesteg A, Lepage RP, Kaufman KR, Woodson GE. “Three-dimensional motion of the arytenoid adduction procedure in cadaver larynges,”. Ann” Otol Rhinol Laryngol. 1994;103:265–270. doi: 10.1177/000348949410300402. [DOI] [PubMed] [Google Scholar]
- Omori K, Slavit DH, Matos C, Kojima H, Kacker A, Blaugrund SM. “Vocal fold atrophy: quantitative glottic measurement and vocal function,”. Ann” Otol Rhinol Laryngol. 1997;106:544 –551. doi: 10.1177/000348949710600702. [DOI] [PubMed] [Google Scholar]
- Perlman, A. L. (1985). “A technique for measuring the elastic properties of vocal fold tissue,” Ph.D. dissertation. The University of Iowa.
- Perlman AL, Titze IR, Cooper DS. “Elasticity of canine vocal fold tissue,”. J Speech Hear” Res. 1984;27:212–219. doi: 10.1044/jshr.2702.212. [DOI] [PubMed] [Google Scholar]
- Sanders I, Rao F, Biller HF. “Arytenoid motion evoked by regional electrical stimulations of the canine posterior cricoarytenoid muscle,”. Laryngoscope . 1994;104:456–462. doi: 10.1288/00005537-199404000-00010. [DOI] [PubMed] [Google Scholar]
- Sanders I, Han Y, Wang J, Biller H. “Muscle spindles are concentrated in the superior vocalis subcompartment of the human thyroarytenoid muscle”. [Review] [45 refs],”. J Voice. 1998;12:7–16. doi: 10.1016/s0892-1997(98)80070-2. [DOI] [PubMed] [Google Scholar]
- Selbie WS, Zhang L, Levine WS, Ludlow CL. “Using joint geometry to determine the motion of the cricoarytenoid joint,”. J Acoust” Soc Am. 1998;103:1115–1127. doi: 10.1121/1.421223. [DOI] [PubMed] [Google Scholar]
- Selbie WS, Gewalt SL, Ludlow CL. “Developing an anatomical model of the human laryngeal cartilages from magnetic resonance imaging,”. J Acoust” Soc Am. 2002;112:1077–1090. doi: 10.1121/1.1501586. [DOI] [PubMed] [Google Scholar]
- Tayama N, Chan RW, Kaga K, Titze IR. “Geometric characterization of the laryngeal cartilage framework for the purpose of biomechanical modeling,”. Ann” Otol Rhinol Laryngol. 2001;110:1154 –1161. doi: 10.1177/000348940111001213. [DOI] [PubMed] [Google Scholar]
- Tayama N, Chan RW, Kaga K, Titze IR. “Functional definitions of vocal fold geometry for laryngeal biomechanical modeling,”. Ann” Otol Rhinol Laryngol. 2002;111:83–92. doi: 10.1177/000348940211100114. [DOI] [PubMed] [Google Scholar]
- Teig E, Dahl HA, Thorkelsen H. “Actomyosin ATPase activity of human laryngeal muscles,”. Acta Oto-Laryngol. 1978;85:272–281. doi: 10.3109/00016487809111935. [DOI] [PubMed] [Google Scholar]
- Titze IR. “The physics of small-amplitude oscillation of the vocal folds,”. J Acoust” Soc Am. 1988;83:1536–1552. doi: 10.1121/1.395910. [DOI] [PubMed] [Google Scholar]
- Titze, I. R. (1996). “Coupling of neural and mechanical oscillators in control of pitch, vibrato, and tremor,” in Vocal Fold Physiology: Controlling Complexity and Chaos, edited by P. J. Davis and N. H. Fletcher (Singular Pub. Group, San Diego), pp. 47–62.
- Titze IR, Jiang J, Druker DG. “Preliminaries to the body-cover model of pitch control,”. J Voice. 1988;1:314–319. [Google Scholar]
- Titze IR, Sundberg J. “Vocal intensity in speakers and singers,”. J Acoust” Soc Am. 1992;91:2936–2946. doi: 10.1121/1.402929. [DOI] [PubMed] [Google Scholar]
- Tomori Z, Benacka R, Donic V. “Mechanisms and clinico-physiological implications of the sniff- and gasp-like aspiration reflex,”. Respir” Physiol. 1998;114:83–98. doi: 10.1016/s0034-5687(98)00077-2. [DOI] [PubMed] [Google Scholar]
- Wilhelms-Tricarico R. “Physiological modeling of speech production: Methods for modeling soft-tissue articulators,”. J Acoust” Soc Am. 1995;97:3085–3098. doi: 10.1121/1.411871. [DOI] [PubMed] [Google Scholar]
- Woodson G, Murry MP, Schweizer V, Hengesteg A, Chen N, Yeung D. “Unilateral cricothyroid contraction and glottic configuration,”. J Voice. 1998;12:335–339. doi: 10.1016/s0892-1997(98)80023-4. [DOI] [PubMed] [Google Scholar]
- Yoshioka H. “Laryngeal adjustments in the production of the fricative consonants and devoiced vowels in Japanese,”. Phonetica . 1981;38:236–251. doi: 10.1159/000260027. [DOI] [PubMed] [Google Scholar]