Abstract
Rayleigh-Plesset analysis, ultra-high speed photography, and single bubble acoustical recordings have previously been applied independently to characterize the radial oscillation and resulting echoes from a microbubble in response to an ultrasonic pulse. In addition, high speed photography has shown that microbubbles are destroyed over a single pulse or pulse train by diffusion and fragmentation. In order to develop a single model to characterize microbubble echoes based on oscillatory and destructive characteristics, an optical-acoustical system was developed to simultaneously record the optical image and backscattered echo from each microbubble. Combined observation provides the opportunity to compare predictions for oscillation and echoes with experimental results and identify discrepancies due to diffusion or fragmentation. Optimization of agents and insonating pulse parameters may be facilitated with this system. The mean correlation of the predicted and experimental radius-time curves and echoes exceeds 0.7 for the parameters studied here. An important application of this new system is to record and analyze microbubble response to a long pulse where diffusion is shown to occur over the pulse duration. The microbubble response to an increasing or decreasing chirp is evaluated using this new tool. For chirp insonation beginning with the lower center frequency, low frequency modulation of the oscillation envelope was obvious. However, low frequency modulation was not observed in the radial oscillation produced by decreasing chirp insonation. Comparison of the echoes from similar sized microbubbles following increasing and decreasing chirp insonation demonstrated that the echoes were not time-reversed replicas. Using a transmission pressure of 620 kPa, the −6 dB echo length was 0.9 and 1.1 μs for increasing and decreasing chirp insonation, respectively (P = 0.02). The mean power in the low frequency portion of the echoes was 8 (mV)2 and 13 (mV)2 for increasing and decreasing chirp insonation, respectively, (P = 0.01).
I. Introduction
Ultrasound contrast agents are microbubbles composed of a lipid, albumin or polymer shell with air or a high molecular weight gas core. Optical studies have been used to record the oscillation of contrast agents and investigate destructive mechanisms [1–4]. Acoustical observations of single microbubbles have been used to design new detection and imaging strategies [5–8], however, a system which records optical and acoustical observations simultaneously has not previously been reported and was the subject of this study.
Without access to simultaneous optical and acoustical recordings, our previous experiments combined optical images acquired before insonation (providing initial diameter) with acoustical recordings of echoes from the same bubble, in order to inform theoretical predictions of the received echo [9]. Other studies involved high speed optical recordings of the radius-time (R-T) curve but lacked access to the echo from that bubble [10]. Here, we have modified the experimental system to allow truly simultaneous optical and acoustical recordings and describe these system modifications and the resulting performance.
The system presented here collects high speed optical images, measuring initial diameter and time-dependent volumetric oscillation while simultaneously recording scattered echoes. The resulting observations are compared with predictions for encapsulated microbubbles, using a modified Rayleigh-Plesset equation with experimentally-determined shell parameters [9, 11, 12]. Development of a model to predict microbubble echoes based on their physical characteristics and those of the ultrasound field has been a goal of many researchers. While Rayleigh-Plesset analysis has facilitated prediction of received echoes for lipid-shelled agents when a low pressure pulse is transmitted, development of a model that incorporates the effects of diffusion and fragmentation has not yet been accomplished. Optical observation of the radius-time curve alone is helpful, however, the prediction of the received echo requires the first and second derivative of the R-T curve and this cannot be accurately estimated from current optical imaging tools. Given that oscillatory dynamics and fragmentation characteristics vary substantially according to the initial microbubble radius, without simultaneous recordings, many separate optical and acoustical recordings must be made in order to truly characterize these processes.
In medical imaging, microbubbles are used to increase the backscattered echoes from the vasculature, in comparison with the surrounding tissue, and therefore nonlinear microbubble oscillation is desirable. Many microbubble imaging schemes have been developed using a nonlinear microbubble response to varied pulse amplitude, phase, or frequency to differentiate microbubble and tissue echoes. In this study, a transmitted pulse with linearly increasing or decreasing frequency was applied as the driving pulse. A hypothesized imaging scheme could exploit any differences in the response to these excitations. Chirped excitation has been investigated in order to increase the signal-to-noise ratio (SNR) with [13–15] and without [16–18] contrast agents, however, long pulses also increase the effect of diffusion on the microbubble. The new simultaneous optical and acoustical system for observation of microbubbles was used here to evaluate the nonlinear components in the received echoes, the similarities and differences between echoes from increasing and decreasing frequency excitation, and the effect of diffusion on the quality of the predicted echoes. This system could have particular utility in characterizing microbubble response to long transmitted pulses, since diffusion alters the microbubble oscillation during such waveforms.
II. Methods
A. Experimental methods
The optical portion of the system (Fig. 1) was comprised of an inverted microscope (Olympus IX70, Melville, NY) with a 100X objective (Zeiss Achroplan 100X, Carl Zeiss, Inc., Thornwood, NY). The images were captured with a high speed digital camera capable of 100 million frames/s (Imacon 468, DRS Hadland, Cupertino, CA). The camera generated seven 2-D frame images of a bubble with adjustable shutter duration and time delay from insonation and the eighth streak image displayed the diameter of the bubble as a function of time. The light source was a xenon strobe that illuminated the microbubble via a fiber optic cable. The temporal resolution of the streak image was approximately 10 ns, and the spatial resolution was on the order of 500 nm. The streak image was traced in Photoshop (Adobe, San Jose, CA) to create a R-T curve which was converted in Matlab (MathWorks, Natick, MA) for analysis and comparison with the predicted curve.
Fig. 1.
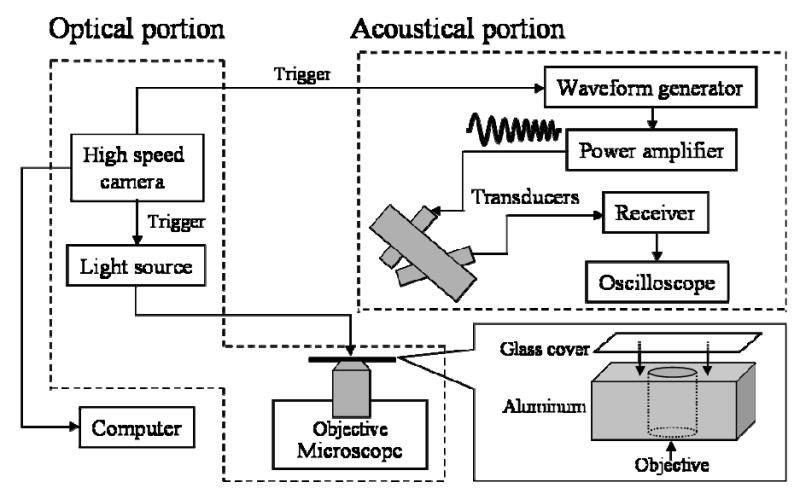
Diagram of the simultaneous optical-acoustical system.
The acoustical portion of the system (Fig. 1) consisted of two transducers mutually-focused on a 200 μm diameter cellulose tube (Spectrum Laboratories, Inc., Rancho Dominguez, CA). A fifteen-degree angle between the transducers and horizontal plane where the tube was placed reduced clutter from the microscope lens. Two 5-MHz center frequency transducers (IM0502HR, Valpey Fisher, Hopkinton, MA) with an element diameter of 6.3 mm, a focal distance of 25.4 mm (f/4), and −6 dB bandwidth of 74% were used to transmit and receive signals and were attached in a confocal holder. The transmitted pulse was linearly frequency-modulated, increasing from 2 to 6 MHz (referred to in this paper as an increasing chirp), or decreasing from 6 to 2 MHz (referred to in this paper as a decreasing chirp). In order to emit a chirp with a constant amplitude over frequency, the excitation waveform was amplitude modulated. The waveform was generated by an arbitrary waveform generator (Tektronix AWG2021, Tektronix, Beaverton, OR) and then amplified with an RF power amplifier (ENI 325LA, Rochester, NY). Two transmitted pressures of 330 and 620 kPa were used in the experiments. The echoes were received with a broadband receiver (Ritec BR-640, Warwick, RI) and digitized by an oscilloscope (LeCroy 9310, Chestnut Ridge, NY) with a sampling frequency of 100 million samples per second and stored for data analysis using Matlab. The transmitted signals were calibrated with a 400-μm needle hydrophone which was calibrated from 1 to 20 MHz (HNZ-0400, ONDA, Inc., Sunnyvale, CA).
The contrast agents used in the experiments were made in our laboratory as previously described [19] and have a lipid shell and decafluorobutane gas core. The microbubbles, with a maximum concentration of 1010 bubbles/mL, were diluted in distilled water by a factor of 106. The average number of bubbles per 100 micron length of tubing should be no greater than 0.03 to insure that only one microbubble was in both the optical field and acoustical sample volume at a given time. The diluted microbubble solution was pumped into the cellulose microtube with a manual microinjector. Both the light source and the arbitrary waveform generator were triggered by the high-speed camera. The range of frequencies within the transmitted pulse corresponds to the linear resonance of microbubbles with diameters from approximately 1.5 to 3.5 μm, and such microbubbles were included in the experimental data set.
The major challenge in combining the optical and acoustical systems is that strong reflections from a high resolution water immersion objective (0.9 mm working distance) distort and saturate the bubble echoes. Commercial 100X long-working-distance water-immersion objectives are not standardly available. Here, an aluminum plane with a microscope glass cover was attached to reflect energy away from the receiver (Fig. 1). Transmission and reception through two confocal transducers with a small angle between the beam axes further decreased reflected energy from the objective. After subtracting the fixed echoes, the resulting SNR was 20 dB with a transmission pressure of 620 kPa. Optical streak images were then recorded simultaneously.
B. Numerical methods
The model developed by Morgan et al. [9], which was based on the Rayleigh-Plesset equation, was used to predict the dynamics of microbubble oscillation. Since the same contrast agent type was used in this paper, the shell parameters were those experimentally determined by Morgan et al., where the shell elasticity modulus was near 0, and the shell viscosity was estimated to be 1.49R0 − 0.86 (Pa·s), where R0 was the initial radius in microns. The driving pulse was the waveform as recorded by the hydrophone and corrected by the impulse response of the hydrophone. The predicted echo was filtered using a similar response to the receiver. The model does not incorporate diffusion of the gas from the microbubble during the pulse.
C. Statistical comparison
The normalized correlation of the predicted and experimental R-T curves and echoes were calculated as Eq. (1), where Rxy is the normalized correlation, x is the predicted and y is the experimental data.
| (1) |
The formula used to calculate the root mean-square-error between the predicted and experimental R-T curve is shown in Eq. (2), where Z is the error, x is the predicted data and y is the experimental data. For the R-T curves, estimates of both the predicted and experimental radius (in microns) are available and therefore an absolute error can be estimated. For the experimental echoes, it is more difficult to experimentally estimate the absolute pressure in the liquid and thus only the correlation is calculated.
| (2) |
A student’s t-test (two-sample assuming equal variances) was used to determine statistical significance for the two pressures and different size ranges, with a P value threshold of 0.05.
III. Results
Forty-five streak images and echoes have been collected and analyzed, 30 and 15 were received following transmission pressures of 620 kPa and 330 kPa, respectively. The 30 datasets collected following transmission of 620 kPa were divided into two size ranges, where 15 samples corresponded to microbubbles between 1.7 and 3.3 μm, and an additional 15 corresponded to microbubbles between 3.4 and 4.9 μm. The 15 samples collected following transmission of 330 kPa corresponded to microbubbles between 1.7 and 3.3 μm. The normalized correlation and the root-mean-square error between the predicted and experimental R-T curves and echoes have been calculated based on (1) and (2) to evaluate the performance of the system and predictions.
A. Effect of acoustically-driven diffusion
In the set of images analyzed in this paper, fragmentation was not observed. Acoustically-driven diffusion can change the microbubble diameter during the transmitted pulse [1], particularly for the high time-bandwidth pulses employed here. As noted above, the diameter of microbubbles decreases by an amount that varies with the initial diameter, but also depends on the transmission pressure.
With chirp insonation at a transmission pressure of 620 kPa, a decreased correlation was demonstrated between the predicted and experimental R-T curves and echoes, due to acoustically-driven diffusion (Fig. 2). Starting with an initial diameter of 3 μm in Fig. 2(a), the correlation between the streak image and the overlaid predicted R-T curve decreases after the sixth cycle of oscillation [Fig. 2(c)]. The diameter of the bubble after insonation was 2.4 μm [Fig. 2(b)]. A similar decrease was observed in the correlation of the predicted and experimental echoes, where the correlation of the predicted and experimental echoes before the sixth cycle of the echoes was 0.88 and decreases to 0.68 afterwards [Fig. 2(d)].
Fig. 2.
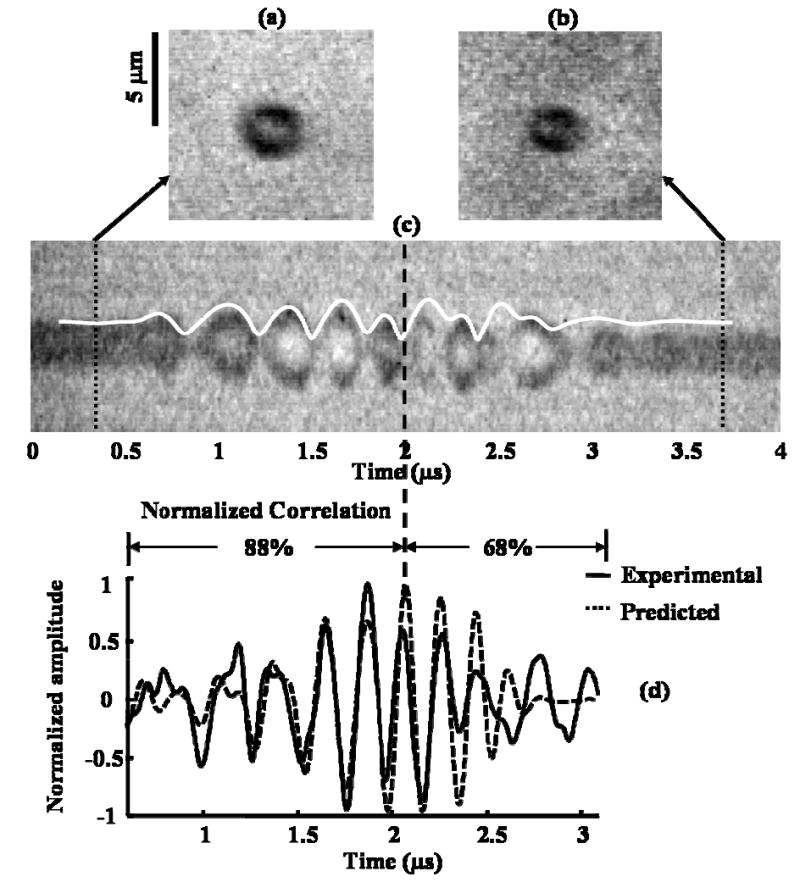
Decrease in correlation of predicted and experimental RT curves and echoes due to acoustically-driven diffusion. (a) 2-D frame image of a microbubble with an initial diameter of 3 μm before insonation; (b) 2-D frame image of the microbubble with a diameter of 2.4 μm after insonation; (c) streak image of the bubble and overlaid predicted RT curve with decreased correlation from the sixth cycle; (d) decrease in correlation of predicted and experimental echoes. The transmission pressure was 620 kPa.
For analysis of the entire data set, the effect of transmission pressure on the R-T curve was first evaluated for a range of initial diameters between 1.7 and 3.3 μm at two transmission pressures (Table I). The normalized correlation between the predicted and experimental R-T curves was 0.76 and 0.70 for transmission pressures of 330 and 620 kPa, respectively. The mean square error in the R-T estimates similarly increases between these transmission pressures, with errors of 0.13 and 0.29 μm calculated for the pressures of 330 and 620 kPa, respectively. Both the decrease in the correlation (P = 0.03) and increase in the error (P = 2e-13) were statistically significant. When the pressure increases from 330 to 620 kPa, the relative expansion, defined as the ratio of the maximum diameter over initial diameter, increases from 1.5 to 2.0 and the change in diameter after insonation due to acoustically-driven diffusion increases from 14% to 36%. Both the increase in relative expansion (P = 4e-6) and increase in acoustically-driven diffusion (P = 1e-8) were statistically significant.
Table I.
Comparison of correlation, error, relative expansion and decrease in diameter for two transmitted pressures and microbubbles with an initial diameter between 1.7 and 3.3 microns. * The signal to noise ratio did not permit accurate estimation of the echo correlation at the lower pressure.
| Transmission pressure (kPa) | R-T correlation between theory and experiment based on (1) | R-T error (μm) between theory and experiment based on (2) | Echo correlation between theory and experiment based on (1) | Relative expansion (Dmax/D0) | Decrease in diameter (%) during pulse |
|---|---|---|---|---|---|
| 330 (n=15) | 0.76 ± 0.05 | 0.13 ± 0.02 | n/a* | 1.5 ± 0.3 | 14 ± 6 |
| 620 (n=15) | 0.70 ± 0.08 | 0.29 ± 0.04 | - | 2.0 ± 0.2 | 36 ± 9 |
| P value | 0.03 | 2e-13 | - | 4e-6 | 1e-8 |
For the transmission pressure of 620 kPa, the effect of initial microbubble diameter on the R-T curve and echo was then evaluated (Table II). The normalized correlation between the predicted and experimental R-T curves was 0.76 and 0.70 for the bubbles with mean initial diameter of 4.1 μm (from 3.4 to 4.9 μm) and 2.5 μm (from 1.7 to 3.3 μm), respectively. The mean square error in the R-T estimates similarly increases when the average bubble size deceases, with errors of 0.16 and 0.29 μm calculated for the mean initial diameter of 4.1 and 2.5 μm, respectively. Both the decrease in the correlation (P = 0.02) and increase in the error (P = 2e-11) for R-T curves were statistically significant. The normalized correlation between the predicted and experimental echoes was 0.88 and 0.83 for the mean initial diameter of 4.1 and 2.5 μm, respectively (P = 0.04). For a mean initial diameter of 4.1 and 2.5 μm, the relative expansion was 1.3 and 2.0, and the decrease in diameter after insonation was 9% and 36% respectively. Both the change in relative expansion (P = 8e-11) and change in acoustically-driven diffusion (P = 2e-10) were statistically significant.
Table II.
Comparison of correlation, error, relative expansion and decrease in diameter for two mean initial diameters with a transmission pressure of 620 kPa.
| Mean initial diameter (μm) | R-T correlation between theory and experiment based on (1) | R-T error (μm) between theory and experiment based on (2) | Echo correlation between theory and experiment based on (1) | Relative expansion (Dmax/D0) | Decrease in diameter (%) during pulse |
|---|---|---|---|---|---|
| 4.1 (n=15) | 0.76 ± 0.04 | 0.16 ± 0.02 | 0.88 ± 0.05 | 1.3 ± 0.2 | 9 ± 6 |
| 2.5 (n=15) | 0.70 ± 0.08 | 0.29 ± 0.04 | 0.83 ± 0.06 | 2.0 ± 0.2 | 36 ± 9 |
| P value | 0.02 | 2e-11 | 0.04 | 8e-11 | 2e-10 |
B. Microbubble response to chirp insonation
This new system can also be used to determine the effect of varied transmission pulses on the received echo, while using the optically observed and predicted R-T curve to determine the mechanisms for variations in the received echo as the pulse changes. We start with a case in which the oscillation can be predicted and characterized through Rayleigh-Plesset analysis and then examine the echoes produced by increasing and decreasing chirp excitation.
With chirp insonation at a peak negative transmission pressure of 620 kPa, agreement was first demonstrated between the predicted R-T curve and the experimental observations through several examples (Fig. 3). With an initial diameter of 3.4 μm, microbubble oscillation follows the increasing transmitted center frequency from approximately 2 to 6 MHz [Fig. 3(a)]. For decreasing chirp insonation [Fig. 3(b)], the oscillation frequency of a microbubble with an initial diameter of 3.5 μm decreases from approximately 6 to 2 MHz. The normalized correlation of the predicted and experimental R-T curves was 0.77 and 0.83 for Fig. 3(a) and (b), respectively.
Fig. 3.
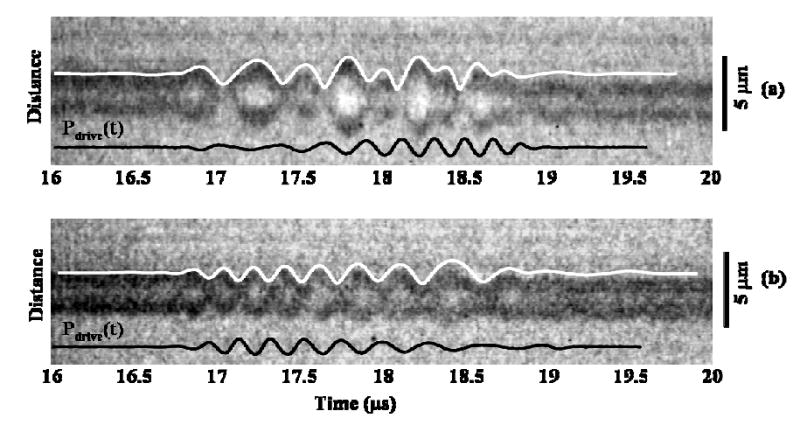
Streak image of a microbubble with overlaid predicted RT curve and driving pulse. (a) Oscillation of a microbubble with initial diameter of 3.4 μm to increasing chirp insonation; (b) oscillation of a microbubble with initial diameter of 3.5 μm to decreasing chirp insonation. The chirp was from 2 to 6 MHz or vice versa, 2 μs long and with peak negative transmission pressure of 620 kPa.
Comparing increasing and decreasing chirp insonation for these two microbubbles with a similar initial diameter, there were observed differences in the radial oscillation. For insonation beginning with the lower center frequency, low frequency (2 MHz) modulation of the oscillation envelope was obvious [Fig. 3(a)]. However, low frequency modulation was not observed in the radial oscillation produced by decreasing chirp insonation [Fig. 3(b)]. Given this difference in the R-T curve produced following increasing and decreasing chirp excitation, the echoes produced by these excitation pulses were then examined.
The simultaneously recorded echoes scattered by the two microbubbles in Fig. 3, were compared to the corresponding predicted echoes in Fig.4. The experimental echo received from the bubble in Fig. 3(a) and predicted echo from increasing chirp insonation were shown in Fig. 4(a) and (b), respectively. The echo received from the bubble in Fig. 3(b) and predicted echo from decreasing chirp insonation were shown in Fig. 4(c) and (d), respectively. The Stockwell transform (S-transform) proposed by R. G. Stockwell et al. [20] was used to decompose the signals. The window length was not fixed but instead varied with frequency (equivalent to one cycle at each frequency). From the time-frequency analysis (displaying 25 dB of dynamic range), a similarly increasing or decreasing instantaneous frequency was noted between the predicted and experimental echoes. The normalized correlation between the predicted and experimental echoes was 0.93 and 0.94 for increasing [Fig. 4(a), (b)] and decreasing chirp insonation [Fig. 4(c), (d)], respectively.
Fig. 4.
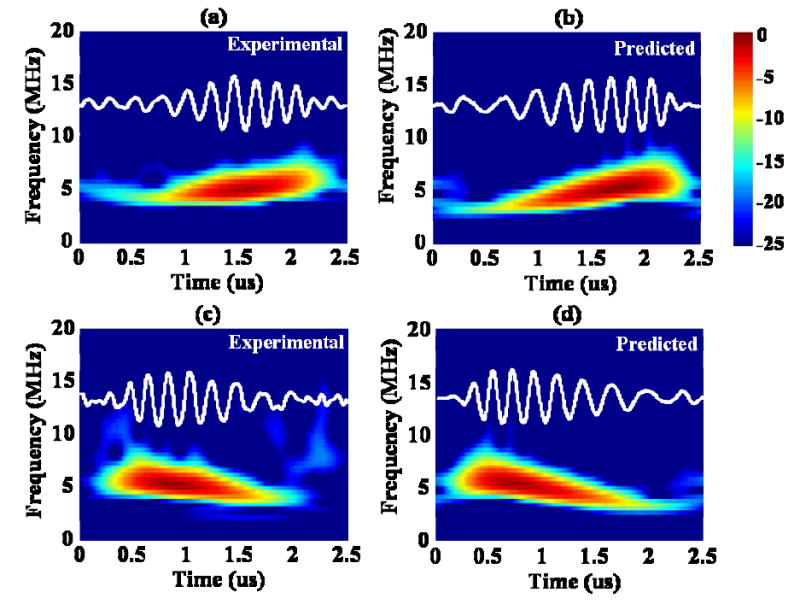
Time-frequency analysis of (a) the experimental echo received from the bubble in Fig. 3(a); (b) predicted echo corresponding to (a); (c) experimental echo received from the bubble in Fig. 3(b); (d) predicted echo corresponding to (c). The transmitted chirp pulse had the same parameters as in Fig.3.
Our experimental system has a limited bandwidth, suppressing some differences between the echoes resulting from varied excitation pulses, and therefore we also compared the predictions without filtering for increasing and decreasing chirp excitation to demonstrate the differences. Comparison of the predicted echoes from similar sized microbubbles following increasing and decreasing chirp insonation demonstrated that the echoes were not time-reversed replicas (Fig. 5). The initial diameter of the bubbles was 2 μm, with a linear resonance frequency of 4 MHz. The predicted echoes from increasing chirp insonation and time-reversed echo from decreasing chirp insonation were aligned [Fig. 5(a)] and differences are apparent [Fig. 5(b)]. In addition to the spectral changes, the −6 dB echo length of the echo from decreasing chirp insonation was longer than the echo length from increasing chirp insonation.
Fig. 5.
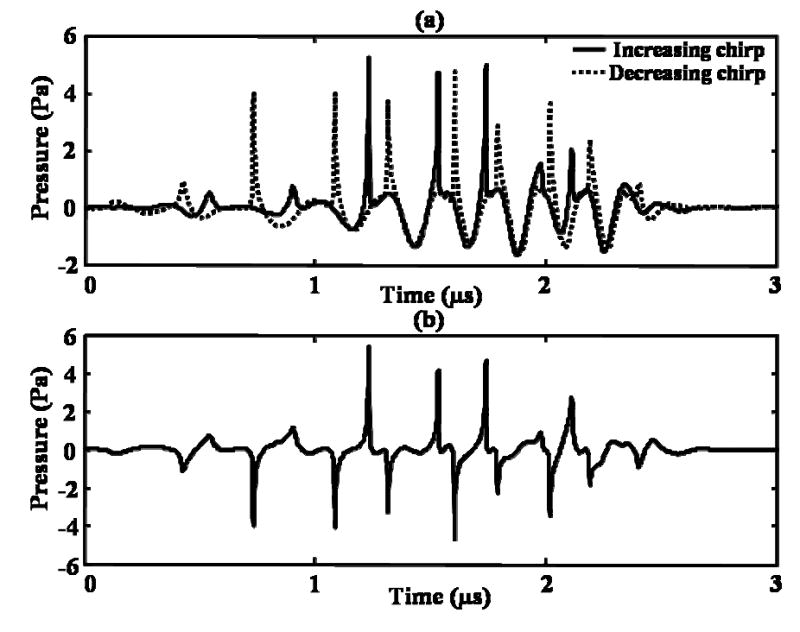
Comparison of the predicted echoes from microbubbles with the same initial diameter of 2 μm to increasing and decreasing chirp insonation. (a) Predicted echo from increasing chirp insonation (solid) and time-reversed predicted echo from decreasing chirp insonation (dashed); (b) difference between the two echoes in (a). The transmission pressure was 620 kPa.
In order to evaluate the temporal symmetry of the microbubble response to increasing and decreasing chirp insonation, echo features have been quantified for the entire data set using a transmission pressure of 620 kPa (Table III). The −6 dB echo length was 0.9 and 1.1 μs for increasing and decreasing chirp insonation, respectively (P = 0.02). The power in the low frequency portion of the echoes (the first and last microsecond of the echoes resulting from increasing and decreasing chirp insonation, respectively), were further compared with transmission pressure of 620 kPa (Table III). The mean power in the low frequency portion of the echoes was 8 (mV)2 and 13 (mV)2 for increasing and decreasing chirp insonation, respectively, (P = 0.01).
Table III.
Comparison of echoes from increasing and decreasing chirp insonation with a transmission pressure of 620 kPa
| Increasing chirp (n=10) | Decreasing chirp (n=10) | P value | |
|---|---|---|---|
| −6 dB echo length (μs) | 0.9 ± 0.2 | 1.1 ± 0.2 | 0.02 |
| Power of low frequency portion (mV2) | 8 ± 4 | 13 ± 4 | 0.01 |
To characterize the nonlinear components in the received echoes, additional time-frequency analysis was performed for the transmitted pulse and echoes (Fig. 6). With a transmission pressure of 620 kPa and displaying a dynamic range of 30 dB, harmonic energy can be observed in the spectrum of the transmitted increasing or decreasing chirp [Fig. 6(a), (h)]. Two initial diameters (2.4 and 4.1 μm, corresponding to linear resonance frequencies of 3.2 MHz and 1.8 MHz) were chosen to characterize the effect of initial diameter on the echo. Microbubbles with an initial diameter of 2.5 μm [Fig. 6(b)] and 2.4 μm [Fig. 6(i)] were insonified with increasing and decreasing frequency insonation, respectively. The echoes received from these two microbubbles both contain a large fraction of harmonic energy, as compared to the transmitted pulses [Fig. 6(c), (j)]. Larger microbubbles with initial diameters of 4.1 and 4.3 μm were shown in Fig. 6(e) and (l), and insonified with increasing and decreasing frequency pulses, respectively. The fraction of harmonic components in the echoes received from the larger bubbles [Fig. 6(f), (m)] was reduced, compared with the smaller initial diameter in Fig. 6(c) and (j). For these transmitted parameters, the diameter of the smaller bubbles [Fig. 6(b), (i)] decreases to 1.8 and 1.7 μm (corresponding to a decrease of 28% and 29%), respectively after insonation [Fig. 6(d), (k)] due to acoustically-driven diffusion. The diameters of the larger bubbles [Fig. 6(e), (l)] were 4.0 and 4.1 μm respectively after insonation, corresponding to a decrease of 2% and 5% [Fig. 6(g), (n)].
Fig. 6.
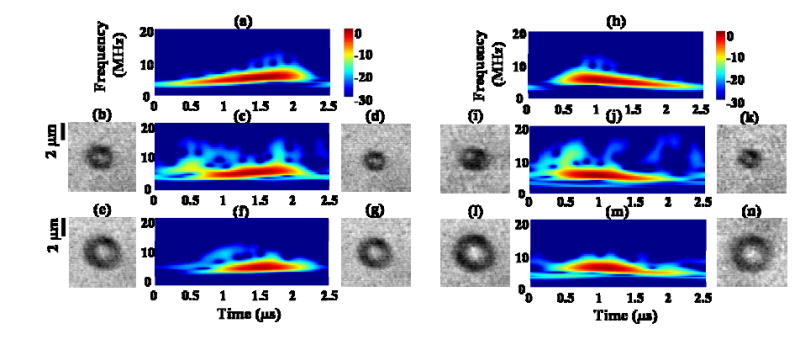
Nonlinear phenomenon in echoes. (a) Time-frequency analysis of a transmitted increasing chirp with transmission pressure of 620 kPa; (b) 2-D frame image of a microbubble with initial diameter of 2.5 μm; (c) time-frequency analysis of the echo from the bubble in (b); (d) frame image of the bubble in (b) after insonation with a decreased diameter of 1.8 μm; (e) frame image of a microbubble with initial diameter of 4.1 μm; (f) time-frequency analysis of the echo from the bubble in (e); (g) frame image of the bubble in (e) after insonation with a diameter of 4.0 μm. (h) Time-frequency analysis of a transmitted decreasing chirp with transmission pressure of 620 kPa; (i) frame image of a microbubble with initial diameter of 2.4 μm; (j) time-frequency analysis of the echo from the bubble in (i); (k) frame image of the bubble in (i) after insonation with a decreased diameter of 1.7 μm; (l) frame image of a microbubble with initial diameter of 4.3 μm; (m) time-frequency analysis of the echo from the bubble in (l); (n) frame image of the bubble in (l) after insonation with a diameter of 4.1 μm.
IV. Discussion
Previously reported work has included optical studies [1–4] and acoustical observations [5–8], and these techniques are integrated in this new instrument. The use of simultaneous optical and acoustical recording techniques facilitates the analysis of microbubble response to high time-bandwidth transmitted pulses. Predicted R-T curves and echoes were compared to experimental results with the goal of improving our understanding of the limitations of the Rayleigh-Plesset model we have employed and identifying features that might be exploited in medical imaging. Optical observation of the radius-time curve alone can characterize the oscillation of the microbubble, however, characterization of the effect of diffusion on the received echo requires both the optical and acoustic observations. Acoustical echo analysis cannot characterize changes in microbubble diameter due to diffusion, and optical recordings cannot provide sufficient knowledge of the radial velocity and acceleration to accurately predict the effect on the echo.
The results in Table I and II verify that for the parameter range explored here, substantial changes in the microbubble and echo were produced by diffusion during the microbubble oscillation. The higher transmission pressure of 620 kPa results in acoustically-driven diffusion and decreased bubble diameter. A model that incorporates diffusion during the pulse has not yet been developed, but would be of particular value for a lipid-shelled agent. Diffusion occurred most noticeably over a range of microbubble diameter for which the relative expansion and volumetric oscillation were greatest, and in this range of diameter the correlation between the predicted and observed echo was also smaller. Specifically, microbubbles with a resting diameter corresponding to a linear resonance in the range of frequencies transmitted demonstrated a larger decrease in size due to diffusion over the pulse length.
At the low transmission pressure of 330 kPa, the agreement between predicted and experimental oscillation following chirp excitation was very good. As might be anticipated, microbubbles with a linear resonance frequency within the range of frequencies transmitted demonstrated non-linear oscillation with greater harmonic echo components, greater relative expansion, and a greater decrease in diameter. No significant differences between the increasing and decreasing chirp insonation were observed for the relative expansion, decrease in diameter, and decorrelation. The difference in maximum expansion between increasing and decreasing chirp insonation was predicted to be less than 0.1 μm for the same parameters, which was less than the spatial resolution of the optical measurement.
The new simultaneous optical and acoustical observation system was also applied to characterize the mechanism behind changes in echoes with new transmission waveforms. One observed difference in the predicted and experimental R-T curves from the increasing and decreasing chirp excitation was a low frequency modulation of the waveform (observed only for the increasing chirp excitation).
Low frequency content in the received echoes was therefore examined. The echoes resulting from increasing and decreasing frequency pulses were not time-reversed replicas. However, the low frequency modulation of the R-T envelope following the increasing chirp (Fig. 2) was not evident in the received echo following the increasing chirp, likely due to its relatively slow variation. Since mapping of the R-T curve to the echo also depends on the wall velocity and acceleration, slow variations in the R-T curve itself are not necessarily reflected in the received echo. Instead, the power in the low frequency portion of the echoes following decreasing chirp insonation was significantly greater than the power from increasing chirp insonation. In particular the amplitude of the low frequency part following decreasing chirp insonation was greater than the amplitude from increasing chirp insonation resulting in longer echo length for decreasing chirp insonation.
Sources of measurement error can be identified for both the optical and acoustical portions of the experimental system. The microbubble’s position in the optical plane was optimized through placement in the optical focus and the center of the image, however, this position can change during insonation. The optical image transition at the microbubble edge in the R-T curve was approximately 2 pixels or 0.28 μm, however, measurements were made at a consistent point in the center of the image transition in order to minimize the error.
Acoustical data acquisition used an 8-bit digitizer, resulting in low level noise in the echoes after fixed reflections from the lens were subtracted. Also, since the transducers employed in this study had a limited −6 dB bandwidth of 74% (3.7 MHz), harmonic energy may be underestimated in this system.
V. Conclusion
This initial study with simultaneous optical and acoustical observation demonstrated that the new instrument can: characterize the effect of diffusion on microbubble oscillations, define a range of pressure and microbubble size for which Rayleigh-Plesset analysis alone can predict the oscillation and received echo, enable more sophisticated models which combine oscillatory dynamics and diffusion mechanisms, and evaluate whether differences observed in R-T curves for new transmitted pulse trains are reflected in the resulting received echoes. Further work is required to demonstrate that the specific features of time-reversed pulses could be exploited in an imaging strategy to recognize microbubble echoes.
Acknowledgments
The authors acknowledge Dustin E. Kruse and Mark A. Borden for many helpful discussions on this project. This work was supported by the National Institutes of Health R01 CA76062.
References
- 1.Chomas JE, Dayton P, Allen J, Morgan K, Ferrara KW. “Mechanisms of contrast agent destruction,”. IEEE Trans Ultrason Ferroelect Freq Contr. 2001;48:232–248. doi: 10.1109/58.896136. [DOI] [PubMed] [Google Scholar]
- 2.Shi WT, Forsberg F, Tornes A, Ostensen J, Goldberg BB. “Destruction of contrast microbubbles and the association with inertial cavitation,”. Ultrasound Med Biol. 2000;26:1009–1019. doi: 10.1016/s0301-5629(00)00223-4. [DOI] [PubMed] [Google Scholar]
- 3.de Jong N, Frinking PJ, Bouakaz A, Goorden M, Schourmans T, Jingping X, Mastik F. “Optical imaging of contrast agent microbubbles in an ultrasound field with a 100-MHz camera,”. Ultrasound Med Biol. 2000;26:487–492. doi: 10.1016/s0301-5629(99)00159-3. [DOI] [PubMed] [Google Scholar]
- 4.Postema M, van Wamel A, Lancee CT, de Jong N. “Ultrasound-induced encapsulated microbubble phenomena,”. Ultrasound Med Biol. 2004;30:827–840. doi: 10.1016/j.ultrasmedbio.2004.02.010. [DOI] [PubMed] [Google Scholar]
- 5.Postema M, Bouakaz A, Versluis M, de Jong N. “Ultrasound-induced gas release from contrast agent microbubbles,”. IEEE Trans Ultrason Ferroelect Freq Contr. 2005;52:1035–1041. doi: 10.1109/tuffc.2005.1504026. [DOI] [PubMed] [Google Scholar]
- 6.Dayton PA, Morgan KE, Klibanov AL, Brandenburger GH, Ferrara KW. “Optical and acoustical observations of the effects of ultrasound on contrast agents,”. IEEE Trans Ultrason Ferroelect Freq Contr. 1999;46:220–232. doi: 10.1109/58.741536. [DOI] [PubMed] [Google Scholar]
- 7.de Jong N, Bouakaz A, Frinking P. “Basic acoustic properties of microbubbles,”. Echocardiography. 2002;19:229–240. doi: 10.1046/j.1540-8175.2002.00229.x. [DOI] [PubMed] [Google Scholar]
- 8.Sboros V, Pye SD, Macdonald CA, Gomatam J, Moran CM, McDicken WN. “Absolute measurement of ultrasonic backscatter from single microbubbles,”. Ultrasound Med Biol. 2005;31:1063–1072. doi: 10.1016/j.ultrasmedbio.2005.04.018. [DOI] [PubMed] [Google Scholar]
- 9.Morgan KE, Allen JS, Dayton PA, Chomas JE, Klibanov AL, Ferrara KW. “Experimental and theoretical evaluation of microbubble behavior: Effect of transmitted phase and bubble size,”. IEEE Trans Ultrason Ferroelect Freq Contr. 2000;47:1494–1509. doi: 10.1109/58.883539. [DOI] [PubMed] [Google Scholar]
- 10.Chomas JE, Dayton PA, May D, Allen J, Klibanov A, Ferrara K. “Optical observation of contrast agent destruction,”. Appl Phys Lett. 2000;77:1056–1058. [Google Scholar]
- 11.Church CC. “The effects of an elastic solid surface layer on the radial pulsations of gas-bubbles,”. J Acoust Soc Amer. 1995;97:1510–1521. [Google Scholar]
- 12.Hoff L, Sontum PC, Hovem JM. “Oscillations of polymeric microbubbles: effect of the encapsulating shell,”. J Acoust Soc Amer. 2000;107:2272–2280. doi: 10.1121/1.428557. [DOI] [PubMed] [Google Scholar]
- 13.Behar V, Adam D. “Parameter optimization of pulse compression in ultrasound imaging systems with coded excitation,”. Ultrasonics. 2004;42:1101–1109. doi: 10.1016/j.ultras.2004.02.020. [DOI] [PubMed] [Google Scholar]
- 14.Chiao RY, Hao X. “Coded excitation for diagnostic ultrasound: a system developer's perspective,”. IEEE Trans Ultrason Ferroelect Freq Contr. 2005;52:160–170. doi: 10.1109/tuffc.2005.1406543. [DOI] [PubMed] [Google Scholar]
- 15.Pedersen MH, Misaridis TX, Jensen JA. “Clinical evaluation of chirp-coded excitation in medical ultrasound,”. Ultrasound Med Biol. 2003;29:895–905. doi: 10.1016/s0301-5629(02)00784-6. [DOI] [PubMed] [Google Scholar]
- 16.Borsboom JM, Chin CT, de Jong N. “Nonlinear coded excitation method for ultrasound contrast imaging,”. Ultrasound Med Biol. 2003;29:277–284. doi: 10.1016/s0301-5629(02)00712-3. [DOI] [PubMed] [Google Scholar]
- 17.Borsboom J, Ting Chin C, de Jong N. “Experimental evaluation of a non-linear coded excitation method for contrast imaging,”. Ultrasonics. 2004;42:671–675. doi: 10.1016/j.ultras.2003.12.013. [DOI] [PubMed] [Google Scholar]
- 18.Borsboom JM, Chin CT, Bouakaz A, Versluis M, de Jong N. “Harmonic chirp imaging method for ultrasound contrast agent,”. IEEE Trans Ultrason Ferroelect Freq Contr. 2005;52:241–249. doi: 10.1109/tuffc.2005.1406550. [DOI] [PubMed] [Google Scholar]
- 19.Borden MA, Longo ML. “Dissolution behavior of lipid monolayer-coated, air-filled microbubbles: effect of lipid hydrophobic chain length,”. Langmuir. 2002;18:9225–9233. [Google Scholar]
- 20.Stockwell RG, Mansinha L, Lowe RP. “Localization of the complex spectrum: The S transform,”. IEEE Trans Signal Process. 1996;44:998–1001. [Google Scholar]


