

Abstract
Anatomical and physiological changes were evaluated in the median nerves of rats trained to perform repetitive reaching. Motor degradation was evident after 4 weeks. ED1-immunoreactive macrophages were seen in the transcarpal region of the median nerve of both forelimbs by 5–6 weeks. Fibrosis, characterized by increased immunoexpression of collagen type I by 8 weeks and connective tissue growth factor by 12 weeks, was evident. The conduction velocity (NCV) within the carpal tunnel showed a modest but significant decline after 9–12 weeks. The lowest NCV values were found in animals that refused to participate in the task for the full time available. Thus, both anatomical and physiological signs of progressive tissue damage were present in this model. These results, together with other recent findings indicate that work-related carpal tunnel syndrome develops through mechanisms that include injury, inflammation, fibrosis and subsequent nerve compression.
Keywords: carpal tunnel syndrome, connective tissue growth factor, ED1 macrophage, fibrosis, nerve conduction velocity, work-related MSD
INTRODUCTION
Work-related musculoskeletal disorders (MSD) are the result of prolonged repetitive, forceful, or awkward movements. Repetitive work has been associated with discomfort in the wrist, hand, or fingers (such as tendinitis or carpal tunnel syndrome; CTS). Increased exposure to physical stressors has been linked to an increased risk of MSDs (Bernard, 1997; Crumpton-Young et al., 2000; Latko et al., 1999; OSHA, 2000; Stock, 1991). Repetitive motion injuries such as CTS pose a significant source of worker pain and discomfort as well as potential long term disability and high economic toll. Injuries of the wrist and hand, the most commonly affected regions in repetitive motion injuries, contribute significantly to worker disability and direct medical costs.
CTS is a common form of MSD (Feuertein et al., 1998; Fogelman and Brogmus, 1995; Hagberg et al., 1992). It is characterized by numbness and paraesthesia along the course of the median nerve due to entrapment of the median nerve within the carpal tunnel (Kanaan and Sawaya, 2001). The entrapment may also include motor symptoms, notably weakness in thumb abduction (D’Arcy and McGee, 2000). Functional deficits, such as clumsiness in fine motor skills, result from combined sensory and motor impairments (Jeng et al., 1994). Patients with CTS typically exhibit slowed sensory and motor conduction of the median nerve at the wrist (Kimura, 1979).
Although epidemiological and field studies have demonstrated an association between repetitive tasks and the development of peripheral nerve injuries (Novak and Mackinnon, 1998), a clear relationship between exposure and tissue pathology has not been established. Injuries to peripheral nerves often result in axonal degeneration and removal of their surrounding myelin sheaths by hematogenous, ED1+ (immunoreactive) macrophages (Bruck, 1997; Perry et al., 1987), proliferation of Schwann cells (Siironen et al., 1994), increased expression of collagen RNAs (Siironen et al., 1994, 1996), and eventually, per-ineurial and epineurial thickening as a result of increased deposition of collagen and other extracellular matrix components (Siironen et al., 1992, 1996). Many of the signals driving these processes remain unknown.
To further investigate the pathophysiology associated with work-related MSD, we have developed an animal model (Barbe et al., 2003; Barr and Barbe, 2002; Barr et al., 2000). Unlike other animal models of nerve pathology, such as nerve ligation or compression (Mackinnon et al., 1984, 1985; O’Brien et al., 1987), electrically stimulated contraction (Backman et al., 1990) or the spontaneous compressions seen in aged guinea pigs (Fullerton and Gilliatt, 1967), our model involves animals (rats) trained to perform a voluntary repetitive reaching and grasping task that reflects the postural and work pace demands derived from the epidemiological literature, thus allowing us to link performance of a work-like task to behavioral changes and tissue injury. We have previously shown that performance of this task induces changes associated with inflammation (increases in ED1+ and ED2+ macrophages) in muscle, tendon, loose areolar connective tissue, and synovial connective tissues throughout the reach limb, as well as signs of tendon fray in the flexors of the distal reach limb (Barbe et al., 2003). There was also evidence that the inflammation was widespread: compared to controls, ED1+ macrophages were increased in regions not involved in performing the task, such as the hind limb and nonreach forelimb. In addition, a pro-inflammatory cytokine, interleukin 1–α (IL-α), was increased in serum. Performance of the task also led to behavioral changes after 4–5 weeks, including increased refusal to participate, as well as the emergence of inefficient scooping and raking behaviors, in which the digits failed to close on the food pellet reward.
The goals of the present study are to characterize changes in the median nerve associated with this task. Nerve conduction velocity (NCV) was measured by direct recording from the median nerve across the carpal tunnel. The levels of macrophages in the nerves of both reach and nonreach limbs were quantified histologically. In addition, we examined immunoexpression of collagen type I, connective tissue growth factor (CTGF) (Igarashi et al., 1993, 1996), myelin basic protein (MBP), and degraded MPB (Matsuo et al., 1998). Since intraneural fibrosis occurs with chronic nerve compression (Mackinnon et al., 1984; O’Brien et al., 1987), we hypothesized that proteins associated with fibrosis such as CTGF will be upregulated in peripheral neural tissues in our model.
We found that the microtrauma elicited by this highly repetitive task resulted in increased numbers of infiltrating macrophages (ED1+ ), increased extracellular collagen type I immumoreactivity and cellular CTGF immumoreactivity within the nerve, especially within the extrafascicular epineurium. Median nerve NCV across the wrist showed a modest but significant decrease. These changes in the median nerve demonstrate the utility of this animal model in posing questions about the development of nerve pathology in human MSD.
MATERIALS AND METHODS
Subjects
All studies were conducted in accordance with the National Research Council Guide for the Care and Use of Laboratory Animals and the policies of the Temple University Institutional Animal Care and Use Committee. A total of 78 female 12–14-week-old Sprague-Dawley rats was used. Thirty-nine rats were trained to perform a highly repetitive forelimb feeding task in which they retrieved food pellets from an elevated tube for periods of up to 12 weeks. The remaining 39 animals were either normal (n = 33) or shaped-only (n = 6; trained to perform the task but sacrificed after the shaping period) controls. The trained and shaped-only animals were food-deprived to 90% body weight throughout training and task regimen periods.
Repetitive Movement Task
Forty-five rats were trained to perform a high-repetition, negligible-force task for periods of 3–12 weeks. The rats were placed in operant test chambers for rodents (Med. Associates, St. Albans, VT) with a portal located in one end. The portal was fitted with a 1.5-cm-wide tube that sloped downward 10° with respect to the chamber floor and was located at the animal’s shoulder height. The tube was 2.5 cm in length so the elbow had to be fully extended in order for the animal to reach pellets of food. Food pellets (45 mg; Biosource) were dispensed (pellet dispenser, Med. Associates) every 15 sec during the reach task. An auditory indicator (stimulus clicker, Med. Associates) provided a cue that a pellet had been dispensed, thereby cueing the animal to attempt a reach.
The experimental (n = 39) and shaped-only control (n = 6) rats learned to reach for the food during an initial 10–12-day shaping period. During this period, the rats were first encouraged to reach through open bars for food pellets placed on an elevated platform for 5 min/day. When they began to reach freely for the food, they were transferred to the test chamber until they could reach into the tube dispenser with no specified reach rate for 10–20 min per day. When they were able to perform the task consistently, the 39 experimental animals were begun on the task regimen at the defined target rate of 4 reaches/min for 2 h/day, 3 days/week for 3–12 weeks. The daily task was divided into four, 0.5-h training sessions separated by 1.5 h. Rats were allowed to use their preferred limb to reach, hereafter referred to as the “reach limb.” The side used to reach was recorded in each session. There were 17 right-handed animals and 13 left-handed animals. Nine animals demonstrated ambidexterity either by using the non-preferred limb only occasionally (usually if a pellet was missed on the first reach attempt, n = 5) or by switching to more frequent use of the non-preferred limb after several weeks of task performance (n = 4). In these nine cases, reach rate and task duration data were used in this analysis as a measure of overall task performance regardless of which limb the animals used to reach. Because groups of animals were sacrificed at weekly endpoints for histological or NCV analyses, the numbers of animals declined over the weeks of the task regimen, leaving four animals in weeks 10–12.
Behavioral Analysis
Reach rate was determined by direct observation of reaches meeting preset criteria: the forepaw was extended and then withdrawn beyond a line 0.5 cm inside the elevated tube. The total number of actual reaches was recorded on a hand counter. Reach rate was defined as the average number of reaches performed per minute on the last day of each task week. Because reaches were often unsuccessful, animals made multiple attempts to retrieve a pellet, thus the observed reach rate typically exceeded the rate at which pellets were dispensed. Task duration was defined as the number of hours/day the rats participated in the task and was averaged over the 3 days within each task week. Gross movement patterns were also examined for deviations from the normal movements comprising reaching in rats (Whishaw and Pellis, 1990). From previous studies (Barbe et al., 2003; Barr et al., 2000), two distinct alternative reach movement patterns were defined. Scooping is a pattern in which the semi-open forepaw is placed over the food pellet and the pellet is dragged along the bottom or side surface of the tube and “scooped” into the mouth. Raking is an inefficient extreme of scooping in which repeated unsuccessful attempts to contact the food pellet with the semi-open forepaw result in repeated back and forth movements that resemble a raking motion. These behaviors were noted as present (>1/min) or absent on the last day of each task week. A mixed model ANOVA for repeated measures was used to analyze differences in reach rate and task duration by week. Generalized estimating equations for binary longitudinal data were used to analyze the relationship between time (weeks) and presence or absence of scooping and raking behavior.
NCV Analysis
Median nerve NCV was measured in 32 control limbs (six shaped-only, 26 normal controls) and in both the reach and nonreach limbs of eight rats that had performed the task for 9–12 weeks. In order to test focal slowing of conduction (Kimura, 1979; Walters and Murray, 2001) NCV was determined for the segment of the median nerve that passes beneath the transcarpal ligament. Under halothane anesthesia, the median nerve was dissected free from the surrounding fascia in the forearm, and a 12-mm-long cuff of polyethylene tubing supporting four silver wire leads (diameter 0.13 mm) was carefully positionedunder the median nerve as it spanned through the forearm into the palm. The entire forelimb was immersed in a mineral oil bath (36–38°C). The distal and proximal stimulating monopolar electrodes (fixed 3.3 mm from each other) were positioned under the span of the median nerve that crosses the carpal tunnel. The recording electrodes were mounted into the cuff near the elbow. Stimuli (20-μsec pulses, −5 to −10 V; 1.1–1.2 × threshold) were delivered alternately via the proximal and distal electrodes at 0.8 Hz. For each rat, at least six sets of averaged compound action potentials elicited from proximal and distal stimulation were digitized (12 bits; 500,000/sec), with eight sweeps per average. Stimulus artifacts and changing shape of the compound action potentials precluded latency estimation based on onset or peak of the wave form. Therefore, conduction latencies were calculated based on the steepest portion of the rising phase of depolarization, which was estimated from the zero-crossings of smoothed second derivatives (Usui and Amidror, 1982) of the recordings. NCV was calculated from the ratio of inter-electrode distance to the difference in conduction latencies elicited with proximal and distal stimuli. A single factor ANOVA was used to compare reach, nonreach and control limbs. Comparison of reach and nonreach limb NCV to controls was performed using the Bonferroni method.
Immunohistochemistry
Immunohistochemical analysis was performed on five normal control, three shaped-only control and 20 experimental rats (the latter studied in groups of three to seven after 3–12 weeks of task performance). Following euthanasia, animals were perfused transcardially with 4% paraformaldehyde. The flexor forelimb mass was equilibrized in 30% sucrose, frozen en bloc, sectioned into 16-μm longitudinal slices, and mounted onto coated slides (Ultrastick; Corning). Tissue sections were treated with 3% H2O2 in methanol for 30 min (omitted for fluorescent staining), washed, treated with 0.05% pepsin in 0.01 N HCl for 20 min at room temperature and then blocked with goat serum (4%) for 30 min at room temperature. Sections were incubated for 48 h at 4°C with the following primary antibodies diluted with 4% goat serum/PBS/anti-ED1 (1:250, Chemicon), anti-CTGF antibody clone 91 (anti-CTGF antibody was custom made against amino acids 243–254, Cambridge Research Biochemicals, Stocktonon Tees, U.K.) (6 μg/mL), anti-collagen type I (1:500, Sigma), neurofilament 200 kD (1:100, Chemicon), and anti-S100β (1:200, Sigma), a Schwann cell marker (Cocchia et al., 1981; Takahashi et al., 1984). After washing, all sections were incubated in the appropriate secondary antibodies conjugated to HRP, Cy2, Cy3, or AMCA (Jackson Immuno) diluted 1:100 for 2 h at room temperature. HRP, when used as the conjugate, was visualized using enzymatic FAST Sigma di-aminobenzidene (DAB) with cobalt enhancement.
Double-immunostaining with anti-MBP (Oncogene #CP32 antibody, which recognizes a highly conserved MBP localized to the myelin cytoplasm) and anti-degraded MBP (Chemicon AB5864 antibody, made against amino acids 69–86 of the guinea pig MBP, which recognizes degenerated Schwann cells in lesioned peripheral nerve) was performed. Sections mounted on slides were blocked with 4% Carnation Milk in PBS for 20 min, then incubated in anti-degraded MBP (1:500) and anti-neurofilament 200kD (1:100, Chemicon) for 72 h at 4oC. The sections were washed, incubated with anti-rabbit IgG conjugated to Cy3 (red) and anti-mouse IgG conjugated to AMCA (blue) as described above, washed again, and incubated for 5 min in 4% paraformaldehyde. Following another wash, sections were incubated with 0.3% triton X-100 in 4% goat serum for 20 min, and then with anti-MBP (1:500) in 0.3% triton/4% serum for 14 h at room temperature. After washing, sections were incubated with anti-mouse IgG-Cy2 (green) as described earlier.
Histological Analysis
The numbers of ED1+ macrophages in the median nerve at the level of the carpal tunnel as well as immediately distal or proximal to the carpal ligament were quantified bilaterally using a microscope interfaced with a bioquantitation system (Bioquant TCW 98). Cells with a defined threshold of peroxidase staining were counted within the boundaries of the sectioned nerve and surrounding epineurium using a ×40 objective. Three fields were measured per wrist. Group means and standard deviations (n = 3–7/group) were plotted against week of task performance and are expressed as the mean number of ED1+ cells/mm2.
To determine the changes in CTGF and collagen type I immunoreactive product with task performance, immunofluorescent stained slides were analyzed using the videocount area and field mode options of Bioquant TCW 98. Videocount area is the number of pixels in a field that meet a user defined criterion multiplied by the area of a pixel at the selected magnification (×40 in our analyses). The mean area fraction of immunoreactive product in a 0.0768 mm2 field (e.g., white boxes in Fig. 5 below) was determined by dividing the videocount area of pixels above background thresholds by the videocount area of the entire field. This determination was made at three locations along the median nerve immediately proximal, distal, and within the carpal tunnel. Both the reach and the nonreach limbs were analyzed. Group means and standard deviations of area fraction (n = 3–4/group) were plotted against week of task performance.
FIG. 5.
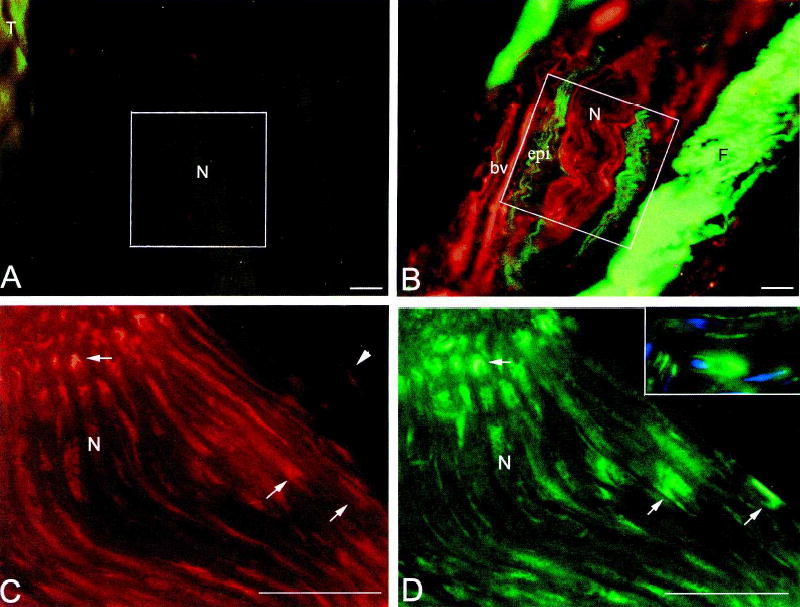
Expression of collagen type I (A,B; green), and CTGF (A,B,C,D inset; red) increase in the median nerve at the level of the wrist with task performance. Immunofluorescence co-localization of CTGF and S100β (D,C inset; green) was used to detect cell-type specific expression of CTGF. (A) Little or no deposition of collagen type I is seen in the epineurium of the median nerve (N) at 0 weeks. (B) Increased collagen type I immunoreactivity is seen in the epineurium (epi) of the median nerve in the reach limb of a 12-week rat. F, fibrotic connective tissue with increased collagen type I staining. (C) CTGF is expressed by Schwann cells (representative profiles indicated by arrows) located within the nerve fascicles of a median nerve from the reach limb of 12-week rat. It may also be present in axons. Arrowheads indicate CTGF+ (S100β-; D) cells that may be epineurial fibroblasts. (D) The same section as C showing S100β expression by Schwann cells (representative profiles indicated by arrows) in the nerve fascicles. The thickness (16 μm) of these longitudinal sections captures both cross-sectional and surface profiles of Schwann cell cytoplasm. Inset shows no co-localization between S100β and neurofilament (blue) immunoreactivity. bv, blood vessel; epi, epineurium; F, fibrotic connective tissue; N, nerve, T, tendon. *The same cell in C, C inset, and D. Bar = 50 μm.
Univariate ANOVAs were used to determine whether week of task performance or limb (reach vs. nonreach) had any effect on the number of ED1+ cells, area fraction of CTGF immunoreactive product and area fraction of collagen type I immumoreactivity in the median nerve at the wrist. The differences in the number of ED1+ macrophages were analyzed by week (4 levels) and by limb (reach and nonreach). A p value of <0.05 was considered significant for all analyses. Microscopic field (3 observations/nerve) was used as a blocking factor in the analyses. Post hoc analyses were carried out by the Bonferroni method for multiple comparisons, and adjusted p values are reported. Post hoc analyses compared the number of macrophages in control tissues (week 0) to those in subsequent weeks (3/4, 5/6, 8, and 12), and also compared reach to nonreach limbs. CTGF immunoreactivity and collagen type I immumoreactivity area fraction were analyzed similarly.
RESULTS
Behavioral Changes
The present observations include and extend results previously reported by Barbe et al. (2003). Over the period of task performance, the motor performance of rats declined, as shown by decreases in reach rate and task duration (Fig. 1). Reach rate was significantly different across weeks (p < 0.05). Post hoc analysis showed a significant decrease in reach rate in weeks 5 and 6 (p < 0.05) as compared to week 1. There was a rebound toward baseline reach rate by week 8 (p > 0.05), followed by an apparent decline in weeks 9–11 (not significant, possibly a result of diminishing numbers of subjects over time). Task duration was significantly different across weeks (p < 0.05). Post hoc analysis showed that task duration declined in weeks 3 and 5 (p < 0.05) as compared to week 1. Duration returned toward the baseline level thereafter (p > 0.05), although the fluctuations in duration are inconclusive, possibly due to diminishing numbers of subjects over time.
FIG. 1.

Behavioral outcomes at weekly endpoints from the first week of the task regimen (week 1) through week 11, expressed as mean + SEM. (A) Observed reach rate versus week. There was a significant decrease in reach rate in weeks 5 and 6 compared to week 1 (p < 0.05). There was a rebound toward baseline (week 1) reach rate in week 8, followed by another decline in weeks 9–11 (not significant, possibly due to the decreasing numbers of subjects over time). (B) Task duration versus week. There was a significant decline in task duration in weeks 3 and 4 (p < 0.05), with a return toward baseline thereafter. Again, the lack of statistical significance in later weeks is possibly the result of decreasing numbers of subjects over time. *Significantly different from week 1 (p < 0.05). Numbers (n) of animals: week 1, n = 39; week 2, n = 38; week 3, n = 36; week 4, n = 33; week 5, n = 30; week 6, n = 27; week 7, n = 21; week 8, n = 19; week 9, n = 8; and weeks 10–11, n = 4.
As described in Barbe et al. (2003), animals developed scooping and raking movement patterns over time. There was not a significant relationship between time and the occurrence of scooping behavior (p = 0.7930), although there was a trend for this behavior to emerge earliest, peak in 47% of animals in week 5 and return toward baseline in weeks 6–11. The relationship between time and the occurrence of raking behavior was highly significant (p < 0.0001). The odds ratio for raking behavior was 1.99 (95% confidence limits: 1.67–2.39), which is an estimate of the change of raking behavior per week. From weeks 1–7, there was a monotonic increase in the proportion of animals that raked (from 18% to 100%), and all animals exhibited raking from weeks 7 to 11. This increase in raking could explain the apparent decline of reach rate in weeks 9–11, as the individual raking motions were not scored as separate reaches (i.e., the forelimb was not withdrawn far enough to meet the criterion for the end of a reach sequence).
The behavioral parameters described above were also measured separately for the subset of eight animals subjected to NCV study. This subset exhibited changes in all behavioral measures (reach rate, duration, movement pattern) that were similar to the complete sample (data not shown). Comparison of behavior with NCV changes of this subset is described below.
Increase in Infiltrating Macrophages
Few if any ED1+ macrophages (activated macrophages) were present in the median nerves of control rats (Figs. 2A and 3A). ED1+ macrophages infiltrated the section of median nerve located within the carpal tunnel region with task performance (Fig. 2B). Increases in ED1+ macrophages were also visible in smaller palmar branches of the median nerve and surrounding connective tissues by week 6 of task performance (Fig. 2C). Those increases were observed in epineurial and per-ineurial connective tissues, as well as adjacent to axons of the nerve (Fig. 2B,C). Quantification of the recruited and resident macrophages supports this observation. There was a significant difference in the number of ED1+ macrophages across weeks (p < 0.0001) and between limbs (p < 0.0001). The week × limb interaction was also significant (p = 0.0119). Post hoc analysis revealed that the numbers of ED1+ macrophages were significantly above control levels (week 0) in weeks 5/6 (p = 0.0020), week 8 (p < 0.0001) and week 12 (p = 0.0016) (Fig. 3A). In addition, the overall number of ED1+ macrophages was greater in the reach limb than in the nonreach limb (p = 0.0003).
FIG. 2.

Increase in ED1+ macrophages and degraded MBP in median nerves after 12 weeks of the task regimen. MBP and neurofilament 200-kD immunoreactivities are shown for comparison. (A) Only a few ED1+ cells (arrow) are visible in the nerve at the level of the carpal ligament at week 0. (B) Several ED1+ cells (arrows) are visible in the same region of the reach limb by 6 weeks. (C) In the same limb as B but more distal, many ED1+ cells (arrows) are present in nerve branches and surrounding connective tissue. (D) At week 12, scant degraded MBP immunoreactivity is visible in the nerve at the mid-forearm level. (E) Numerous whole MBP+ profiles are visible in the same section as (D). (F) Same section showing double staining for both anti-degraded MBP and anti-MBP. (G) At week 12, degraded MBP+ is greatly increased in the median nerve at the level of the wrist. The large cell (arrowhead) containing degraded MBP immunoreactivity may be a phagocytic macrophage. (H) Numerous whole MBP+ profiles are visible in the same section as G. The inset in H shows no overlap between MPB and neurofilament (blue) immunoreactivity. (I) Same section showing double staining for anti-degraded MBP and anti-MBP. There is only a small amount of staining overlap. N, nerve; CT, connective tissue. Bar = 50 μm.
FIG. 3.

Quantification of histological analyses, expressed as mean + SEM. (A) Quantification of the mean numbers of ED1+ macrophages in the median nerve at the level of the wrist and immediately proximal and distal to the carpal ligament. There are significantly more ED1+ macrophages in both the reach and nonreach limbs at 5/6, 8, and 12 weeks compared to week 0. The increases are greater in the reach than in the non-reach limbs. Numbers (n) of animals: week 0, n = 7; week 3/4, n = 7; week 5/6, n = 5; week 8, n = 4; and week 12, n = 4. (B) Quantification of area fraction containing collagen type I immunoreactivity in the same regions described in A. The area fraction of collagen type I immunoreactivity is significantly greater in both the reach and nonreach limbs at weeks 8 and 12 compared to week 0. Collagen type I immunoreactivity does not increase in the nonreach limbs until week 12; that increase is lower than in the reach limbs. Numbers of animals: week 0, n = 3; week 3/4, n = 4; week 5/6, n = 3; week 8, n = 3; and week 12, n = 4. (C) Quantification of area fraction containing CTGF immunoreactivity in the same regions described in A. The area fraction of CTGF immunoreactivity is significantly greater in both the reach and nonreach limbs at week 12 than at week 0. This increase is greater in the reach than in the nonreach limbs. Numbers of animals were the same as in B. **p < 0.001.
Evidence of Myelin Degradation
Many structures within the median nerves were immunoreactive for degraded MBP at the wrist (Fig. 2F,G) but not in the proximal forearm (Fig. 2D,F) in all four rats that had performed the task for 12 weeks. Qualitative examination of the whole MBP in these nerves showed little difference in MBP immunoreactivity along the length of the median nerve (Fig. 2E,F,H,I).
Evidence of Fibrosis
Fibrosis was occasionally evident on a macroscopic level; the NCV of the reach limb of one of the 10 week animals could not be measured due to a connective tissue nodule surrounding the nerve within the carpal tunnel (Fig. 4B). Collagen type I immunoreactivity increased in the extrafascicular epineurium of median nerves of the reach limbs in rats that had performed the task for 8 and 12 weeks (Figs. 3B and 5B) compared to the limbs of control (week 0) rats. This increase was particularly prominent in the epineurium at the wrist and immediately distal to the carpal ligament. Quantification of the area fraction of collagen type I immumoreactivity supports this observation. From the ANOVA, we determined that week had a significant effect on the area fraction of collagen type I immunoreactivity (p < 0.0001), as did limb (p < 0.0001) and week × limb interaction (p = 0.0297). Post hoc analysis showed that the area fraction of collagen type I immunoreactivity was significantly above control levels in week 8 (p < 0.0001) and week 12 (p < 0.0001) (Fig 3B). In addition, the overall area fraction of collagen type I immunoreactivity was greater in the reach limb than in the nonreach limb (p = 0.0001).
FIG. 4.

Macroscopic photographs of the median nerve traversing the carpal region of a week 0 (A) and a week 10 (B) rat. Note the connective tissue (CT) nodule surrounding the nerve in the reach limb of a rat that performed the task for 10 weeks.
The increase in collagen type I deposition was paralleled by increases in the immunoreactivity of CTGF. CTGF+/S100β- cells and profiles were observed in the epineurium and surrounding loose connective tissues by 6 weeks of task performance (Fig. 5B,C). There were also several CTGF+ cells in blood vessels surrounding the median nerve in the reach limb (Fig. 5B). By 12 weeks, CTGF immunoreactivity was clearly evident in Schwann cells (S100β+ ) within the nerve bundle (Fig. 5C,D). CTGF immunoreactivity was also observed in epineurial fibroblasts, which are S100β- (Fig. 5C,D). Quantification of the area fraction of CTGF immunoreactivity supports this observation. From the ANOVA, we determined that week had a significant effect on the area fraction of CTGF immunoreactivity (p < 0.0001) as did limb (p = 0.0484). Figure 3C illustrates that CTGF immumoreactivity was greater in the reach limb than the nonreach limb after 6 weeks of task performance. The week × limb interaction was not significant (p = 0.5687). Post hoc analysis showed that the area fraction of CTGF immunoreactivity was significantly above control levels in week 12 (p < 0.0001; Fig. 3C).
Nerve Conduction Velocity
The mean NCV of the median nerve within the carpal tunnel of control limbs was 52.4 ± 4.3 m/sec (SD) (Fig. 6A). For one of the eight reach limbs, NCV could not be measured due to a nodule of connective tissue that surrounded the nerve (Fig. 4). For the remaining seven reach limbs, the mean NCV was 47.7 ± 3.8 m/sec, and for seven nonreach limbs it was 50.3 ± 4.2 m/sec. The single factor ANOVA comparing these means was significant (p = 0.034). The Bonferroni analysis showed that the mean reach limb NCV was significantly different from control, while the nonreach limb NCV was not.
FIG. 6.

Plots of transcarpal median nerve conduction velocity. (A) Frequency histogram of NCV in median nerves of 30 control limbs (dotted outline) and the reach limbs of seven rats after 9–12 weeks of task performance (gray, solid outline). (B) Relationship between duration of task performance in the final week of the task regimen and NCV in the seven rats. The arrow indicates the duration of performance of the animal shown in Figure 4, for which the NCV could not be measured.
The extent of the decline in NCV in reach limbs had a behavioral correlate (Fig. 6B); there was an association between reach limb NCV and the amount of time the animal was willing to participate in the task at the end of the last week before testing. Of the eight animals tested, the three with the lowest NCV (44.8 ± 0.4 m/sec), and the one unmeasured animal (due to a nodule surrounding the nerve) were also the subjects that declined to perform the task for the full 120 min, despite continuing availability of a food reward. The four animals with the highest NCV (49.8 ± 3.3 m/sec) all participated for 120 min/day in the final week of the task regimen. The association between low NCV (<45 m/sec) and reduced task duration (<120 min) was significant (Fisher’s exact test; p = 0.029). In contrast, neither reach rate nor movement pattern discriminated between higher and lower NCV values among these 8 animals.
DISCUSSION
The present results extend those of Barbe et al. (2003). As we reported previously, rats trained in this high repetition, negligible force task exhibit behavioral changes, including alterations in reach rate and duration of performance, as well as the emergence of inefficient scooping and raking movements. Adding to our previous report on task-induced changes in muscle, tendon and connective tissue, we have demonstrated that the median nerves in trained rats showed numerous changes over 3–12 weeks of task performance: increased numbers of ED1+ macrophages in both limbs, as well as signs of fibrosis and a slight but significant slowing of NCV in the reach limb.
Macrophage Infiltration
Our results reveal that continued performance of a highly repetitive task elicited continued increases in the number of ED1+ macrophages in portions of the median nerve located within and adjacent to the carpal tunnel. We observed increases in these cells in both the per-ineurial and epineurial layers and in association with axons. These findings are consistent with many other studies that have shown that after nerve injury, a large number of nonresident ED1+ macrophages enters from the circulation at the site of injury and distally (Perry et al., 1987; Stoll et al., 1989). The numbers of ED1+ macrophages observed in the present study (~1000/mm2 within the carpal tunnel at 5–6 weeks) are comparable to those reported by Leskovar et al. (2000) for sciatic nerve following nerve crush and during subsequent Wallerian degeneration. The signals leading to recruitment of these macrophages are not yet fully defined but include axonal breakdown and rejected myelin sheaths (Beuche and Friede, 1984; Bruck, 1997; Bruck et al., 1995).
It is noteworthy that there was a small increase in numbers of ED1+ macrophages without NCV changes in the nonreach limb of trained animals. This observation is consistent with our previous findings of widespread and cellular systemic inflammatory responses in this model (Barbe et al., 2003). Possible mechanisms leading to this finding are considered below.
Infiltration of ED1+ cells appears to be finely graded to the degree of injury, with the recruited macrophages selectively localizing to degenerating nerve fibers and myelin (Beuche and Friede, 1984; Griffin et al., 1992; Stoll et al., 1989). ED1+ cells have also been found in the perineurium following nerve injury (Griffin et al., 1992). The ED1+ macrophages are the main effectors in Wallerian degeneration (Bruck, 1997; Coffey et al., 1990; Perry et al., 1987). They increase in number within 24 h to 3 days after injury and continue to increase over a 14-day period (Avellino et al., 1995). Post-phagocytic macrophages (ED1−), which are filled with myelin, persist for long periods after myelin clearance is completed (Griffin et al., 1992), but are no longer phagocytic. The continued presence of ED1+ cells intraneurally in our 12-week study indicates the continued need for myelin clearance in the median nerve at the wrist with chronic performance of this task.
Fibrosis
Examination of median nerves showed increased collagen type I immunoreactivity in the epineurium of the median nerve at the wrist in trained animals. Both experimental animal models of nerve compression and examination of human specimens with known nerve compression reveal progressive thickening of internal and external epineurium as well as thickening of the per-ineurium (Mackinnon et al., 1984, 1986; Novak and Mackinnon, 1998; O’Brien et al., 1987). Marked compression leads to profound electrophysiological and histological changes. In contrast, minimal but prolonged compression results in some histological changes, such as alterations of the blood nerve barrier and axonal degeneration (Mackinnon et al., 1984; O’Brien et al., 1987), but not changes in NCV (Mackinnon et al., 1984).
Collagen and other connective tissue components have been shown to increase, especially in the epineurium, after a variety of types of damage to peripheral nerves (Eather and Pollock, 1987; Novak and Mackinnon, 1998). A molecule known to upregulate the production of extracellular matrix proteins such as collagen type I is CTGF (Duncan et al., 1999; Frazier et al., 1996). CTGF regulates various cellular functions including adhesion, fibroblast proliferation and matrix production (Moussad and Brigstock, 2000). Overproduction of the CTGF mRNA and protein is significantly correlated with fibrotic diseases (Grotendorst 1997; Moussad and Brigstock, 2000) such as post-surgical scar formation (Igarashi et al., 1993), in which there is an aberrant deposition of extracellular matrix (Igarashi et al., 1993, 1996; Kikuchi et al., 1995). Increased serum levels of CTGF are found in patients with systemic fibrosis (Sato et al., 2000), explaining, perhaps, the increase in CTGF we observed in nonreach limb nerve tissues by 12 weeks of task performance. CTGF may also be increased in our model as a function of repair and regenerative processes, as studies of wound healing have shown that CTGF is expressed and secreted by fibroblasts as part of an injury-induced growth factor cascade in normal extracellular matrix remodeling (Igarashi et al., 1993; Moussad and Brigstock, 2000).
To date, CTGF mRNA expression and/or protein production has been demonstrated in endothelial cells (Shimo et al., 1998), fibroblasts (Igarashi et al., 1993; Ryseck et al., 1991), chondrocytes (Nakanishi et al., 1997), vascular smooth muscle cells (Lin et al., 1998), and osteoblasts (Xu et al., 2000). CTGF immunoreactivity has also been detected in a few cells of the CNS, including astrocytes and ependymal cells (Kondo et al., 1999), particularly following a cerebral infarction (Schwab et al., 2000). Additional studies support a possible role for CTGF in glial scar formation in response to CNS injury (Hertel et al., 2000; Schwab et al., 2001). Our study is the first showing increased CTGF expression in Schwann cells and peripheral nerve fibroblasts. Figure 5C also suggests that CTGF may be present within axons, but our results are inconclusive. We observed the increased CTGF immunoreactivity only after long term performance of a repetitive task and in conjunction with intraneural fibrosis and decreased NCV. Our results suggest that CTGF is involved in regulating the increased deposition of intraneural matrix by fibroblasts and Schwann cells through both local and systemic mechanisms (note the CTGF immunoreactivity in the nonreach limb at 12 weeks; Fig. 3C). The increase in collagen type I in the median nerve of the nonreach limb may be a result of a systemic increase in CTGF. Further investigation is needed to determine if CTGF expression is associated with glial scar formation or repair and regeneration by these cells in the peripheral nerve.
NCV
In contrast to the clear anatomical and behavioral responses, the median nerve NCV showed a small, albeit significant decline. The decrement in mean NCV was 4.7 m/sec compared to controls, for a decrease of 9.0%. The variation we observed in control NCV values was large (coefficient of variation of 8.3%), but comparable to that reported by Walters and Murray (2001) for transcarpal motor conduction velocity of normal human subjects (coefficient of variation of 12.8%) and Fullerton and Gilliatt (1967) for median nerve motor NCV in young guinea pigs (coefficient of variation of 8.2%).
The slight decrease in NCV seen in this study, despite substantial changes in collagen and ED1+ macrophages, is consistent with other recent studies of nerve compression that show the onset of histological changes prior to physiological ones. Mackinnon et al. (1984) found epineurial fibrosis and other histological changes in rat sciatic nerves 4–6 months after banding them with 1.5-mm silastic tubing (minimal compression), yet the NCV of these nerves was normal. Using a similar procedure, Gupta et al. (2001) found that Schwann cells proliferated prior to the onset of NCV decrements. Diao et al. (2001) suggest that rabbit median nerve compressed by a balloon placed within the carpal tunnel shows loss of axons, thinning of myelin and increase of phagocytic cells that precede changes in motor NCV. It appears that the high-repetition, negligible-force task used in the present study was sufficient to cause nerve damage, but insufficient to induce a large NCV decrement in the first 12 weeks of study. Further work is needed to determine whether the NCV decrement would be more dramatic in this model after either longer performance of this task or performance of a high repetition, high force task.
Development of Nerve Lesions in MSD
The events leading to the task-induced changes we and others have observed may involve at least three parallel and interrelated pathways. One pathway is suggested by the work of Björklund et al. (2000), in which fatigue following low-intensity, repetitive arm movements was shown to impair position sense in humans. Another is suggested by the work of Byl et al. (1997), in which somatotopic dedifferentiation of the somatosensory cortex in owl monkeys was found in association with repetitive grasping movements. Perhaps diminished proprioceptive sense or cortical neuroplastic changes in our trained rats contributed to the development of scooping and raking, behaviors which may result from a degradation of fine motor control.
A third pathway is suggested by our previous reports (Barbe et al., 2003; Barr et al., 2000), which present evidence that tissue injury as well as widespread and systemic production of proinflammatory cytokines coincided with behavioral decrements in our model. Perhaps the pain associated with inflammation led to hyperalgesia and/or allodynia (via release of substance P; Dubner and Ruda, 1992; Urban and Gebhart, 1998), thereby contributing to decreases in duration and/or reach rate. In the present study we have further elucidated this third pathway by observing infiltration of ED1+ cells (cells known to produce inflammatory cytokines) into the median nerves of both reach and nonreach limbs immediately following the peak inflammatory response described in our previous studies. Inflammation includes extraneural edema, which has been shown both to compress the median nerve in the carpal tunnel and to lead to fibrosis (Lluch, 1992). In the central nervous system, glial fibrosis may also result from traumatic or ischemic injury through upregulation of CTGF (Hertel et al., 2000; Schwab et al., 2000). It is yet unknown whether glial fibrosis occurs through this mechanism in the peripheral nervous system. In our model, intraneural fibrotic changes are seen in the median nerve of the reach limb immediately following the peak inflammatory response in serum and musculoskeletal tissues. Fibrosis, whether mediated by edema, compression or nerve trauma may in turn lead to further nerve compression. In any case, the response of the median nerve to compression is characterized in this study by the presence of non-immune, ED1+ cells in the median nerve in the carpal tunnel region. These cells are known to be involved in degradation of myelin in neural tissues. Loss of myelin can lead to decreased NCV and subsequent loss of sensory and/or motor information that could contribute to further behavioral degradation. The histological changes observed in the nonreach limb may presage NCV decrements at that site as well. For example, a variety of cell types show increased CTGF immunoreactivity in blood vessels and connective tissue surrounding the median nerve in the nonreach limb (Fig. 5), which suggests that fibrosis is developing.
The association between NCV and duration of task performance shown in Figure 6B suggests that the responses of rats to the task are variable. Even though all rats that performed the task longer than 3 weeks developed changes at both histological and behavioral (raking) levels, the relationship between NCV and task duration suggests that some of the trained rats experienced significant discomfort, as well as more extreme nerve damage, while others were less affected. It is unclear whether this difference among rats is associated with subtleties of reaching behavior that make pathology more or less likely, or with genetic variation that predisposes only some individuals to develop a lesion within the first 12 weeks. Resolution of this question may be significant for understanding the incidence of MSD in human workers.
Implications for Occupational Health and Safety
Although the number of cases new of MSD in U.S. private industry has declined from its peak of 332,100 in 1994 to 242,000 in 2000, they continue to account for 4% of all reported injuries and illnesses in U.S. private industry, according to the U.S. Bureau of Labor Statistics (BLS) database (BLS, 2002). CTS is a prevalent and costly form of MSD. In a study of 5,844 federal workers with a single-diagnosis upper extremity MSD workers’ compensation claim from 1993 to 1994, CTS accounted for 40% of claims, incurring average direct medical costs of $2,948 per case, average indemnity costs of $4,941 per case, and an average of 84 lost work days during the study period (Feuerstein et al., 1998). Increased risk of developing CTS is associated with repetitive and/or forceful job tasks (Hagberg et al., 1992; Latko et al., 1999; Silverstein et al., 1987).
There is no current standard for prevention and management of work-related CTS or other MSDs. Herbert et al. (1999) showed that patients with work-related CTS in New York State from 1991 to 1994 underwent frequent challenges to their claims, leading to delays in treatment. Such delays may lead to further nerve damage, particularly if a worker continues to perform high-risk work tasks, and this may ultimately increase long-term disability. The resistance of workers’ compensation insurance to cover claims of CTS stems from an incomplete understanding of the extent to which job tasks are directly responsible for median nerve compression. Our results demonstrate that a highly repetitive, negligible-force task induces fibrotic and other changes indicative of injury in the median nerve, and it does this in the same time range as behavioral changes, but prior to any substantial decrement in NCV. Thus, a worker who continues to perform high-risk work tasks after initial symptoms develop may exacerbate pathological neural changes that have already begun. A more complete understanding of the role of repetitive motions in the etiology of CTS will not only elucidate these issues, but will provide insight into preventive strategies aimed at reducing exposure to work place risk factors to an “acceptable” level. The animal model of MSD we have developed provides an important means of increasing that understanding.
Acknowledgments
We are grateful to Mamta Amin for her assistance with the immunohistochemistry. This study was supported by NIOSH OH03970 (to M.F.B.), NIAMS AR46426 (to A.E.B.), and a Temple University Summer Research Fellowship (to B.D.C.). This paper was presented previously at the annual meeting of the Society for Neuroscience, San Diego, CA, November 2001.
References
- AVELLINO AM, HART D, DAILEY AT, et al. Differential macrophage responses in the peripheral and central nervous system during Wallerian degeneration of axons. Exp Neurol. 1995;136:183–198. doi: 10.1006/exnr.1995.1095. [DOI] [PubMed] [Google Scholar]
- BACKMAN C, BOQUIST L, FRIDEN J, et al. Chronic achilles paratenonitis with tendinosis: an experimental model in the rabbit. J Orthop Res. 1990;8:541–547. doi: 10.1002/jor.1100080410. [DOI] [PubMed] [Google Scholar]
- BARBE MB, BARR AE, GORZELANY I, et al. Chronic repetitive reaching and grasping results in decreased motor performance and widespread tissue responses. J Orthop Res. 2003;21:167–176. doi: 10.1016/S0736-0266(02)00086-4. [DOI] [PMC free article] [PubMed] [Google Scholar]
- BARR AE, SAFADI FF, GARVIN RP, et al. Evidence of progressive tissue pathophysiology and motor behavior degradation in a rat model of work related musculoskeletal disease. Proc Int Ergonomics Assoc Human Factors Ergonomics Soc. 2000;5:584–587. [Google Scholar]
- BARR AE, BARBE MF. Pathophysiologicaltissue changes associated with repetitive movement: a review of the evidence. Phys Ther. 2002;82:173–187. doi: 10.1093/ptj/82.2.173. [DOI] [PMC free article] [PubMed] [Google Scholar]
- BERNARD, B.P. (ed.) (1997). Musculoskeletal Disorders (MSDs) and Workplace Factors: A Critical Review of Epidemiologic Evidence for Work-related Musculoskeletal Disorders of the Neck, Upper Extremity, and Low Back. Publication no. 97–141. Dept. Health Human Services, National Institute of Occupational Safety and Health.
- BEUCHE W, FRIEDE RL. The role of non-resident cells in Wallerian degeneration. J Neurocytol. 1984;13:767–796. doi: 10.1007/BF01148493. [DOI] [PubMed] [Google Scholar]
- BJÖRKLUND M, CRENSHAW AG, DJUPSJÖBACKA M, et al. Position sense acuity is diminished following repetitive low intensity work to fatigue in a simulated occupational setting. Eur J Appl Physiol. 2000;81:361–367. doi: 10.1007/s004210050055. [DOI] [PubMed] [Google Scholar]
- BRUCK W. The role of macrophages in Wallerian degeneration. Brain Pathol. 1997;7:741–752. doi: 10.1111/j.1750-3639.1997.tb01060.x. [DOI] [PMC free article] [PubMed] [Google Scholar]
- BRUCK W, BRUCK Y, MARUSCHAK B, et al. Mechanisms of macrophage recruitment in Wallerian degeneration. Acta Neuropathol (Berl) 1995;89:363–367. doi: 10.1007/BF00309630. [DOI] [PubMed] [Google Scholar]
- BUREAU OF LABOR STATISTICS. (2002). Safety and Health Statistics. U.S. Department of Labor [On-line]. Available: www.bls.gov/iif/home.htm
- BYL NN, MERZENICH MM, CHEUNG S, et al. A primate model for studying focal dystonia and repetitive strain injury: effects on the primary somatosensory cortex. Phys Ther. 1997;77:269–284. doi: 10.1093/ptj/77.3.269. [DOI] [PubMed] [Google Scholar]
- COCCHIA D, MICHETTI F, DONATATO R. Immunochemical and immunocytochemical localization of S-100 antigen in normal human skin. Nature. 1981;294:85–87. doi: 10.1038/294085a0. [DOI] [PubMed] [Google Scholar]
- COFFEY PJ, PERRY VH, RAWLINS JN. An investigation into the early stages of the inflammatory response following ibotenic acid–induced neuronal degeneration. Neuroscience. 1990;35:121–132. doi: 10.1016/0306-4522(90)90126-o. [DOI] [PubMed] [Google Scholar]
- CRUMPTON-YOUNG LL, KILLOUGH MK, PARKER PL, et al. Quantitativeanalysis of cumulative trauma risk factors and risk factor interactions. J Occup Env Med. 2000;42:1013–1020. doi: 10.1097/00043764-200010000-00008. [DOI] [PubMed] [Google Scholar]
- D’ARCY CA, MCGEE S. The rational clinical examination. Does this patient have carpal tunnel syndrome? JAMA. 2000;283:3110–3117. doi: 10.1001/jama.283.23.3110. [DOI] [PubMed] [Google Scholar]
- DIAO, E., SHAO, F., LOTZ, J.C., et al. (2001). Ultrastructural changes in the median nerve associated with increased carpal tunnel pressure in a rabbit model. Soc. Neurosci. Abstr. 27, program no. 870.8.
- DUBNER R, RUDA MA. Activity-dependent neuronal plasticity following tissue injury and inflammation. Trends Neurosci. 1992;15:96–103. doi: 10.1016/0166-2236(92)90019-5. [DOI] [PubMed] [Google Scholar]
- DUNCAN MR, FRAZIER KS, ABRAMSON S, et al. Connective tissue growth factor β–induced collagen synthesis: down-regulation by cAMP. FASEB J. 1999;13:1774–1786. [PubMed] [Google Scholar]
- EATHER TF, POLLOCK M. Collagen synthesis in axotomized peripheral nerve: evidence against Schwann cell involvement. Exp Neurol. 1987;96:214–218. doi: 10.1016/0014-4886(87)90183-x. [DOI] [PubMed] [Google Scholar]
- FEUERSTEIN M, MILLER VL, BURREL LM, et al. Occupational upper extremity disorders in the federal workforce. J Occup Env Med. 1998;40:546–555. doi: 10.1097/00043764-199806000-00007. [DOI] [PubMed] [Google Scholar]
- FOGLEMAN M, BROGMUS G. Computer mouse use and cumulative trauma disorders of the upper extremities. Ergonomics. 1995;38:2465–2475. doi: 10.1080/00140139508925280. [DOI] [PubMed] [Google Scholar]
- FRAZIER K, WILLIAMS S, KOTHAPALLI D, et al. Stimulation of fibroblast cell growth, matrix production and granulation tissue formation by connective tissue growth factor. J Invest Dermatol. 1996;107:404–411. doi: 10.1111/1523-1747.ep12363389. [DOI] [PubMed] [Google Scholar]
- FULLERTON PM, GILLIATT RW. Median and ulnar neuropathy in the guinea-pig. J Neurol Neurosurg Psychiatr. 1967;30:393–402. doi: 10.1136/jnnp.30.5.393. [DOI] [PMC free article] [PubMed] [Google Scholar]
- GRIFFIN JW, GEORGE R, LABATO C, et al. Macrophage responses and myelin clearance during Wallerian degeneration: relevance to immune-mediated demyelination. J Neuroimmunol. 1992;40:153–166. doi: 10.1016/0165-5728(92)90129-9. [DOI] [PubMed] [Google Scholar]
- GROTENDORST GR. Connective tissue growth factor: a mediator of TGF-β action on fibroblasts. Cytokine Growth Factor Rev. 1997;8:171–179. doi: 10.1016/s1359-6101(97)00010-5. [DOI] [PubMed] [Google Scholar]
- GUPTA, R., CHAFIK, D., BEAR, D., et al. (2001). Quantitative stereologic evaluation of a model for carpal tunnel syndrome. Soc. Neurosci. Abstr. 27, program no. 870.9.
- HAGBERG M, MORGENSTERN H, KELSH M. Impact of occupations and job tasks on the prevalence of carpal tunnel syndrome. Scand J Work Environ Health. 1992;18:337–345. doi: 10.5271/sjweh.1564. [DOI] [PubMed] [Google Scholar]
- HERBERT R, JANEWAY K, SCHECHTER C. Carpal tunnel syndrome and workers’ compensation among an occupational clinic population in New York state. Am J Ind Med. 1999;35:335–342. doi: 10.1002/(sici)1097-0274(199904)35:4<335::aid-ajim3>3.0.co;2-8. [DOI] [PubMed] [Google Scholar]
- HERTEL M, TRETTER Y, ALZHEIMER C, et al. Connective tissue growth factor: a novel player in tissue reorganization after brain injury? Eur J Neurosci. 2000;12:376–380. doi: 10.1046/j.1460-9568.2000.00930.x. [DOI] [PubMed] [Google Scholar]
- IGARASHI A, OKOCHI J, BRADHAM DM, et al. Regulation of connective tissue growth factor gene expression in human skin fibroblasts and during wound repair. Mol Biol Cell. 1993;4:637–645. doi: 10.1091/mbc.4.6.637. [DOI] [PMC free article] [PubMed] [Google Scholar]
- IGARASHI A, NASHIRO K, KIKUCHI K, et al. Connective tissue growth factor gene expressionin tissue sections from localized scleroderma, keloid, and other fibrotic skin disorders. J Invest Dermatol. 1996;106:729–733. doi: 10.1111/1523-1747.ep12345771. [DOI] [PubMed] [Google Scholar]
- JENG O, RADWIN RG, RODRIGUEZ AA. Functional psychomotor deficits associated with carpal tunnel syndrome. Ergonomics. 1994;37:1055–1069. doi: 10.1080/00140139408963718. [DOI] [PubMed] [Google Scholar]
- KANAAN N, SAWAYA RA. Carpal tunnel syndrome: modern diagnostic and management techniques. Br J Gen Pract. 2001;51:311–314. [PMC free article] [PubMed] [Google Scholar]
- KIKUCHI K, KADONO T, IHN H, et al. Growth regulation in scleroderma fibroblasts: increased response to transforming growth factor–β1. J Invest Dermatol. 1995;105:128–132. doi: 10.1111/1523-1747.ep12313452. [DOI] [PubMed] [Google Scholar]
- KIMURA J. The carpal tunnel syndrome: localization of conduction abnormalities within the distal segment of the median nerve. Brain. 1979;102:619–635. doi: 10.1093/brain/102.3.619. [DOI] [PubMed] [Google Scholar]
- KONDO Y, NAKANISHI T, TAKIGAWA M, et al. Immunhistochemical localization of connective tissue growth factor in the rat central nervous system. Brain Res. 1999;834:146–151. doi: 10.1016/s0006-8993(99)01517-6. [DOI] [PubMed] [Google Scholar]
- LATKO WA, ARMSTRONG TJ, FRANZBLAU A, et al. Cross-sectional study of the relationship between repetitive work and the prevalence of upper limb musculoskeletal disorders. Am J Ind Med. 1999;36:248–259. doi: 10.1002/(sici)1097-0274(199908)36:2<248::aid-ajim4>3.0.co;2-q. [DOI] [PubMed] [Google Scholar]
- LESKOVAR A, MORIARTY LJ, TUREK JJ, et al. The macrophage in acute neural injury: changes in cell numbers over time and levels of cytokine production in mammalian central and peripheral nervous systems. J Exp Biol. 2000;203:1783–1795. doi: 10.1242/jeb.203.12.1783. [DOI] [PubMed] [Google Scholar]
- LIN J, LILIENSIEK B, KANITZ M, et al. Molecular cloning of genes differentially regulated by TNF-α in bovine aortic endothelial cells, fibroblasts and smooth muscle cells. Cardiovasc Res. 1998;28:802–813. doi: 10.1016/s0008-6363(98)00055-8. [DOI] [PubMed] [Google Scholar]
- LLUCH AL. Thickening of the synovium of the digital flexor tendons: cause or consequence of the carpal tunnel syndrome? J Hand Surg. 1992;17:209–212. doi: 10.1016/0266-7681(92)90091-f. [DOI] [PubMed] [Google Scholar]
- MACKINNON SE, DELLON AL. Experimental study of chronic nerve compression. Peripheral nerve surgery Hand Clin. 1986;2:639–650. [PubMed] [Google Scholar]
- MACKINNON SE, DELLON AL, HUDSON AR, et al. Chronic nerve compression—an experimental model in the rat. Ann Plast Surg. 1984;13:112–120. doi: 10.1097/00000637-198408000-00004. [DOI] [PubMed] [Google Scholar]
- MACKINNON SE, DELLON AL, HUDSON AR, et al. A primate model for chronic nerve compression. J Reconstruct Microsurg. 1985;1:185–195. doi: 10.1055/s-2007-1007073. [DOI] [PubMed] [Google Scholar]
- MATSUO A, AKIGUCHI I, LEE GC, et al. Myelin degradation in multiple system atrophy detected by unique antibodies. Am J Pathol. 1998;153:735–744. doi: 10.1016/S0002-9440(10)65617-9. [DOI] [PMC free article] [PubMed] [Google Scholar]
- MOUSSAD EE, BRIGSTOCK DR. Connective tissue growth factor: what’s in a name? Mol Genet Metab. 2000;71:276–292. doi: 10.1006/mgme.2000.3059. [DOI] [PubMed] [Google Scholar]
- NAKANISHI T, KIMURA Y, TAMURA T, et al. Cloning of a mRNA preferentiallyexpressed in chondrocytes by differential display–PCR from a human chondrocytic cell line that is identical with connective tissue growth factor (CTGF) mRNA. Biochem Biophys Res Commun. 1997;234:206–210. doi: 10.1006/bbrc.1997.6528. [DOI] [PubMed] [Google Scholar]
- NOVAK CB, MACKINNON SE. Nerve injury in repetitive motion disorders. Clin Orthop Rel Res. 1998;351:10–20. [PubMed] [Google Scholar]
- O’BRIEN JP, MACKINNON SE, MACLEAN AR, et al. A model of chronic nerve compression in the rat. Ann Plast Surg. 1987;19:430–435. doi: 10.1097/00000637-198711000-00008. [DOI] [PubMed] [Google Scholar]
- OSHA. Ergonomics program; final rule: 29 CFR part 1910. Department of Labor, Occupational Safety and Health Administration Fed Reg. 2000;64:68262–68870. [Google Scholar]
- PERRY VH, BROWN MC, GORDON S. The macrophage response to central and peripheral nerve injury: a possible role for macrophages in regeneration. J Exp Med. 1987;165:1218–1223. doi: 10.1084/jem.165.4.1218. [DOI] [PMC free article] [PubMed] [Google Scholar]
- RYSECK RP, MACDONALD-BRAVO H, MATTEI MG, et al. Structure, mapping and expression of fisp-12, a growth factor–inducible gene encoding a secreted cysteine-rich protein. Cell Growth Differ. 1991;2:225–233. [PubMed] [Google Scholar]
- SATO S, NAGAOKA T, HASEGAWA M, et al. Serum levels of connective tissue growth factor are elevated in patients with systemic sclerosis: association with extent of skin sclerosis and severity of pulmonary fibrosis. J Rheumatol. 2000;27:149–154. [PubMed] [Google Scholar]
- SCHWAB JM, POSTLER E, NGUYEN TD, et al. Connective tissue growth factor is expressed by a subset of reactive astrocytes in human cerebral infarction. Neuropathol Appl Neurobiol. 2000;26:434–440. doi: 10.1046/j.1365-2990.2000.00271.x. [DOI] [PubMed] [Google Scholar]
- SCHWAB JM, BESCHORNER R, NGUYEN TD, et al. Differential cellular accumulation of connective tissue growth factor defines a subset of reactive astrocytes, invading fibroblasts, and endothelial cell following central nervous system injury in rats and humans. J Neurotrauma. 2001;18:377–388. doi: 10.1089/089771501750170930. [DOI] [PubMed] [Google Scholar]
- SHIMO T, NAKANISHI T, KIMURA Y, et al. Inhibition of endogenous expression of connective tissue growth factor by its antisense oligonucleotide and antisense RNA suppresses proliferation and migration of vascular endothelial cells. J Biochem. 1998;124:130–140. doi: 10.1093/oxfordjournals.jbchem.a022071. [DOI] [PubMed] [Google Scholar]
- SIIRONEN J, SANDBERG M, VUORINEN V, et al. Expression of type I and III collagens and fibronectin after transection of rat sciatic nerve: reinnervation compared to denervation. Lab Invest. 1992;67:80–87. [PubMed] [Google Scholar]
- SIIRONEN J, COLLAN Y, ROYTTA M. Axonal reinnervation does not influence Schwann cell proliferation after rat sciatic nerve transection. Brain Res. 1994;564:303–311. doi: 10.1016/0006-8993(94)90492-8. [DOI] [PubMed] [Google Scholar]
- SIIRONEN J, VUORIO E, SANDBERG M, et al. Expression of type I and III collagen and laminin B1 after rat sciatic nerve crush injury. J Periph Nerv Sys. 1996;1:209–221. [PubMed] [Google Scholar]
- SILVERSTEIN BA, FINE LJ, ARMSTRONG TJ. Occupational factors and carpal tunnel syndrome. Am J Ind Med. 1987;11:343–358. doi: 10.1002/ajim.4700110310. [DOI] [PubMed] [Google Scholar]
- STOCK SR. Workplace ergonomic factors and the development of musculoskeletal disorders of the neck and upper limbs: a meta-analysis. Am J Ind Med. 1991;19:87–107. doi: 10.1002/ajim.4700190111. [DOI] [PubMed] [Google Scholar]
- STOLL F, GRIFFIN JW, LI CY, et al. Wallerian degeneration in the peripheral nervous system: participation of both Schwann cells and macrophages in myelin degradation. J Neurocytol. 1989;18:671–683. doi: 10.1007/BF01187086. [DOI] [PubMed] [Google Scholar]
- TAKAHASHI K, ISOBE T, OHTSUKI Y, et al. Immunohistochemical study on the distribution of α and β subunits of S-100 protein in human neoplasm and normal tissues. Virchows Arch Cell Pathol. 1984;45:385–396. doi: 10.1007/BF02889881. [DOI] [PubMed] [Google Scholar]
- URBAN MO, GEBHART GF. The glutamate synapse: a target in the pharmacological management of hyperalgesic pain states. Prog Brain Res. 1998;116:407–420. doi: 10.1016/s0079-6123(08)60452-5. [DOI] [PubMed] [Google Scholar]
- USUI S, AMIDROR I. Digital low-pass differentiation for biological signal processing. IEEE Trans Biomed Eng. 1982;29:686–693. doi: 10.1109/TBME.1982.324861. [DOI] [PubMed] [Google Scholar]
- WALTERS RJL, MURRAY NMF. Transcarpal motor conduction velocity in carpal tunnel syndrome. Muscle Nerve. 2001;24:966–968. doi: 10.1002/mus.1096. [DOI] [PubMed] [Google Scholar]
- WHISHAW IQ, PELLIS SM. The structure of skilled forelimb reaching in the rat: a proximally driven movement with a single distal rotatory component. Behav Brain Res. 1990;41:49–59. doi: 10.1016/0166-4328(90)90053-h. [DOI] [PubMed] [Google Scholar]
- XU J, SMOCK SL, SAFADI FF, et al. Cloning the full-length cDNA for rat connective tissue growth factor: implications for skeletal development. J Cell Biochem. 2000;77:103–115. doi: 10.1002/(sici)1097-4644(20000401)77:1<103::aid-jcb11>3.0.co;2-g. [DOI] [PubMed] [Google Scholar]