

Abstract
The inward rectifier current IK1 is tightly regulated regionally within the heart, downregulated in heart failure, and genetically suppressed in Andersen syndrome. We used in vivo viral gene transfer to dissect the role of IK1 in cardiac repolarization and maintenance of the resting membrane potential (RMP) in guinea pig ventricular myocytes. Kir2.1 overexpression boosted Ba2+-sensitive IK1 by more than 100% (at –50mV), significantly shortened action potential durations (APDs), accelerated phase 3 repolarization, and hyperpolarized RMP compared with control cells (nongreen cells from the same hearts and green cells from GFP-transduced hearts). The dominant-negative Kir2.1AAA reduced IK1 by 50–90%; those cells with less than 80% reduction of IK1 exhibited prolonged APDs, decelerated phase 3 repolarization, and depolarization of the RMP. Further reduction of IK1 resulted in a pacemaker phenotype, as previously described. ECGs revealed a 7.7% ± 0.9% shortening of the heart rate–corrected QT interval (QTc interval) in Kir2.1-transduced animals (n = 4) and a 16.7% ± 1.8% prolongation of the QTc interval (n = 3) in Kir2.1AAA-transduced animals 72 hours after gene delivery compared with immediate postoperative recordings. Thus, IK1 is essential for establishing the distinctive electrical phenotype of the ventricular myocyte: rapid terminal repolarization to a stable and polarized resting potential. Additionally, the long-QT phenotype seen in Andersen syndrome is a direct consequence of dominant-negative suppression of Kir2 channel function.
Introduction
Kir2.1 subunits, encoded by the KCNJ2 gene, assemble to form tetrameric inward rectifier potassium channels in many cell types, including cardiac myocytes. Thus, Kir2.1 is essential in the generation of the cardiac inward rectifier current (IK1). IK1 is considered to contribute significant repolarizing current during the terminal phase of the action potential (AP) and serves as the primary conductance controlling the resting membrane potential (RMP) in ventricular myocytes (1). Near RMP, the ventricular IK1 conductance is much larger than that of any other current, with the exception of the ATP-sensitive potassium current, which is normally not active. It is thus likely that physiological modulation of this current will have a significant effect on excitability.
Clinically, IK1 is downregulated in human heart failure (2). Furthermore, mutations in Kir2.1 have been reported to cause Andersen syndrome with accompanying periodic paralysis and QT prolongation with ventricular arrhythmias (3, 4). The ventricular arrhythmias presented in Andersen syndrome are predominately complex ventricular ectopy and polymorphic ventricular tachycardia (3, 4). Less frequently, the arrhythmias degenerate into torsades de pointes or ventricular fibrillation (4). The cardiac manifestations exhibited in Andersen syndrome illustrate the important role that IK1 plays in the heart.
Unfortunately, lack of IK1-specific pharmacologic tools, and thus an inability to manipulate IK1 experimentally, have been a significant impediment to further advancements in the study of IK1 in cardiac excitability. These facts prompted us to investigate the role of IK1 by manipulating Kir2.1 expression using gene transfer. We previously described the effect of extreme IK1 suppression to liberate endogenous pacemaker activity in the ventricle (5). In this study, we sought to clarify more broadly the roles of IK1 in ventricular repolarization and in maintaining a polarized diastolic resting potential. We pursued a quantitative approach using in vivo adenoviral gene transfer to achieve IK1 enhancement and suppression. For the former, we overexpressed Kir2.1; for the latter, we used a Kir2.1-AAA dominant-negative construct to suppress the endogenous IK1. Our observations underscore the clinical importance of IK1 in the maintenance of the normal QT interval. Furthermore, our study highlights the essential role that Kir2.1 plays in modulating cardiac excitability.
Methods
Plasmid construction and adenovirus preparation.
We used first generation, bicistronic adenoviruses for enhancement and suppression of IK1. The shuttle vectors pAdEGI and pAdCDBEcR for the ecdysone-inducible adenovirus system have been described (6). The full-length coding sequence of human Kir2.1 (7) was cloned into the multiple-cloning site of pAdEGI to generate the overexpression construct pAdEGI-Kir2.1. The pore-forming GYG144–146 motif of Kir2.1 was substituted with with the sequence AAA by site-directed mutagenesis to generate the dominant-negative construct pAdEGI-Kir2.1AAA. Adenovirus vectors were generated by Cre-lox recombination of purified ψ5 viral DNA and shuttle vector DNA as previously described (8). The recombinant products were plaque purified, expanded, and purified on CsCl gradients, yielding concentrations on the order of 1010 PFU/ml.
Animals.
Adenoviruses were injected into the left ventricular cavity of guinea pigs after cross-clamping the aortae (9). Adult female guinea pigs (250–300 g) were anesthetized with 4% isoflurane, intubated, and placed on a ventilator with a vaporizer supplying 1.5–2% isoflurane. Following lateral thoracotomy and immediately after cross-clamping both the aorta and pulmonary artery, a 30-gauge needle was inserted at the apex and into the chamber of the left ventricle. An adenovirus mixture containing 3 × 10¹⁰ PFU AdCDBEcR and 2 × 10¹⁰ PFU AdEGI (GFP control group), 3 × 10¹⁰ PFU AdCDBEcR and 3 × 10¹⁰ PFU AdEGI-Kir2.1 (Kir2.1-overexpressed group), or 3 × 10¹⁰ PFU AdCDBEcR and 3 × 10¹⁰ PFU AdEGI-Kir2.1AAA (Kir2.1-suppressed group), was injected into the left ventricular cavity. The clamp was maintained for 40–60 seconds to allow the adenovirus to circulate throughout the coronary circulation. After the chest was closed, animals were injected intraperitoneally with 10 mg of the non-steroidal ecdysone receptor agonist N-(3-methoxy-2-ethylbenzoyl)-N′-(3,5-dimethylbenzoyl)-N′-tert-butylhydrazine, which is known as GS-E (kindly provided by Rohm and Haas Co., Spring House, Pennsylvania, USA). GS-E was dissolved in 90 μl DMSO and 360 μl sesame oil as described previously (10). GS-E is released slowly from the DMSO/sesame oil depot such that a high serum level of GS-E is maintained for up to 10 days following a single intraperitoneal injection (11).
The work presented was performed in accordance with NIH guidelines for the care and use of laboratory animals and was performed in accordance with the guidelines of the Animal Care and Use Committee of the Johns Hopkins University.
Myocyte isolation and electrophysiology.
Forty-eight to 72 hours after injections were performed, guinea pig left ventricular myocytes were isolated using standard techniques (12). These enzymatic dissociations typically yielded 70–80% viable myocytes. A xenon arc lamp was used to view GFP fluorescence at 488/530 nm (excitation/emission). The yield of transduced myocytes, identifiable by their vivid green fluorescence using epifluorescence imaging (see below), was approximately 20% as judged by visual assessments when cells were dispersed into the electrophysiologic recording chamber.
Experiments were carried out using the whole-cell patch-clamp technique (13) at 37°C with an Axopatch 200B amplifier (Axon Instruments Inc., Foster City, California, USA) while sampling at 10 kHz (for currents) or 2 kHz (for voltage recordings) and filtering at 2 kHz. Pipettes had tip resistances of 2–4 MΩ when filled with the internal recording solution. Given that we have shown that adenovirus infection itself does not modify the electrophysiology of guinea pig myocytes (ref. 11, and our results of measurements of L-type calcium current, ICa,L, below), control patch-clamp experiments performed on uninfected (non-green) left ventricular myocytes isolated from AdEGI-Kir2.1–injected and AdEGI-Kir2.1AAA–injected animals, as well as on green cells from AdEGI-injected hearts, were used as controls.
Cells were superfused with a physiological saline solution containing 140 mM NaCl, 5 mM KCl, 2 mM CaCl2, 10 mM glucose, 1 mM MgCl2, and 10 mM HEPES; pH was adjusted to 7.4 with NaOH. The pipette solution was composed of 130 mM K-glutamate, 19 mM KCl, 10 mM Na-HEPES, 2 mM EGTA, 5 mM Mg-ATP, and 1 mM MgCl2; pH was adjusted to 7.2 with KOH. APs were initiated by brief depolarizing current pulses (2 ms, 500–800 pA, 110% threshold) at 0.33 Hz. AP duration (APD) was measured as the time from the overshoot to 50% or 90% repolarization (APD50 and APD90, respectively). For IK1 recordings, CaCl2 was reduced to 100 μM, CdCl2 (200 μM) was added to block ICa,L, and INa was steady-state inactivated by using a holding potential of –40 mV. To obtain IK1 as a Ba2+-sensitive current, currents recorded before and after the addition of Ba2+ (500 μM) were subtracted. Data were not corrected for the liquid junction potential of –12.2 ± 0.9 mV (n = 7), which was measured using the method of Neher (14). For ICa,L recordings, cells were superfused with a saline solution containing 140 mM N-methyl-D-glucamine, 5 mM CsCl, 2 mM CaCl2, 10 mM glucose, 0.5 mM MgCl2, and 10 mM HEPES; pH was adjusted to 7.4 with HCl. The pipette solution was composed of 125 mM CsCl, 20 mM TEA-Cl, 2 mM EGTA, 4 mM Mg-ATP, and 10 mM HEPES; pH was adjusted to 7.3 with CsOH.
Electrocardiograms.
Surface ECGs were recorded immediately after operation and 72 hours after adenoviral injection as previously described (10, 11). Guinea pigs were lightly sedated with isoflurane and needle electrodes were placed under the skin. Electrode positions were optimized to obtain maximal-amplitude recordings, enabling accurate measurements of QT intervals. ECGs were simultaneously recorded from standard limb leads I, II, and III. The positions of the needle electrodes were marked on the guinea pigs’ skin at the time of initial recording so as to ensure exactly the same localization 72 hours later. The heart rate–corrected QT interval (QTc) was calculated with Hayes’ square-root correction formula (15): QTc = QTm + 7(œw 250 – œwRR), where RR is the R-R interval and QTm is the interval from the Q wave to the peak of the T wave using a tangent line to deine the T-wave peak and the P wave to establish the baseline.
Histological evaluation.
Transduction efficacy was assessed by histological evaluation of microscopic sections 48 hours after injection of 160 μl AdCMV-βgal (2 × 10¹⁰ PFU/ml) into the left ventricular cavity (16). Hearts were excised, rinsed thoroughly in PBS, sectioned, and fixed in 2% formaldehyde/0.2% glutaraldehyde for 15 minutes at room temperature. The sections were stained for 6 hours at 37°C in PBS containing 1.0 mg/ml 5-bromo-4-chloro-3-indolyl-β-D-galactoside (X-gal), 15 mmol/l potassium ferricyanide, 15 mmol/l potassium ferrocyanide, and 1 mmol/l MgCl2. After staining, the slices were fixed with 2% formaldehyde/0.2% glutaraldehyde in PBS at 4°C overnight. The sections were embedded in paraffin, cut to 5-μm thickness, and stained with X-gal solution for visual assessment of transduction efficacy (16).
Statistical analysis.
Pooled data are presented as mean ± SEM. Comparisons between groups were made with the use of ANOVA or the unpaired t test. Comparisons among groups were made with the paired t test. Correlations between AP parameters and outward IK1 density were determined using linear regression analysis. P values smaller than 0.05 were deemed significant.
Results
Transduction efficiency using the left ventricular cavity injection strategy was assessed by histological evaluation of microscopic sections from AdCMV-βgal–injected hearts. Figure 1 shows such a transverse section from the left ventricle after staining with X-gal solution for visual assessment of transduction efficacy. Transduced myocytes were distributed throughout the left ventricle from apex to base with transduction efficiencies of 15–25% routinely obtained. For unclear reasons, the number of transduced cells in the right ventricle and the atrium was very small (∼1%). Thus, electrophysiologic study of left ventricular myocytes is reported herein.
Figure 1.
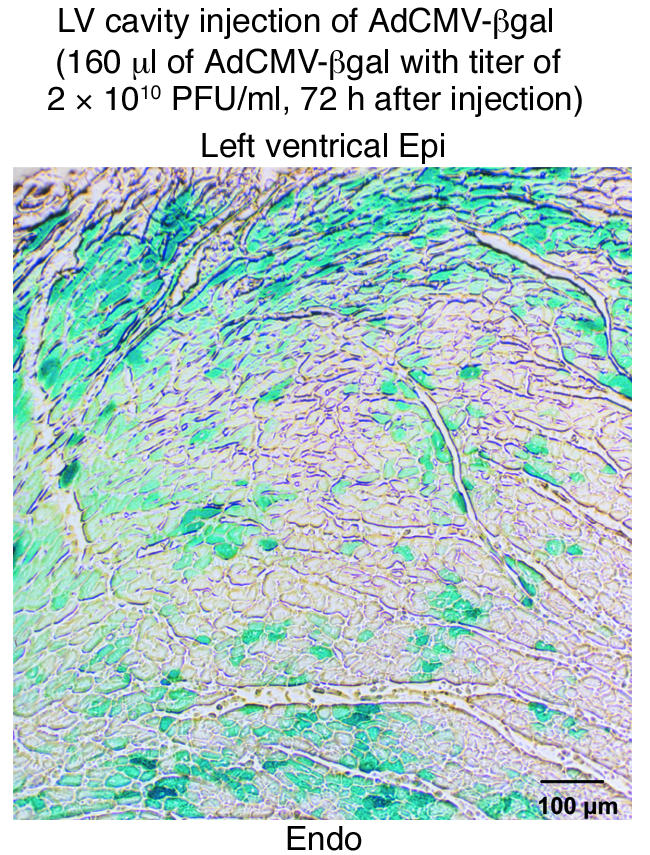
Assessment of gene transfer efficacy. X-gal staining of microscopic sections of left ventricle 48 hours after injection of AdCMV-βgal into the left ventricular cavity was used to assess transduction efficacy. Transduced cells (stained blue) were observed throughout the left ventricular wall. This gene delivery method achieved transduction of approximately 20% of ventricular myocytes without obvious cell damage. LV, left ventricular; epi, epicardium; endo, endocardium.
Dominant-negative effects of Kir2.1AAA on IK1 expression were achieved using the approach of Herskowitz (17). The GYG motif, three amino acids in the H5 region of potassium channels that play a key role in selectivity and pore function (18, 19), were replaced with a triplet of alanines in Kir2.1, thereby creating a dominant-negative construct that encodes for Kir2.1 subunits with nonconducting pores. When coexpressed with wild-type Kir2.1, the incorporation of a single mutant subunit within the tetramer is sufficient to cripple the channel and suppress current flux (20). When we transiently expressed Kir2.1AAA in a mammalian cell line (HEK) stably expressing Kir2.1, the dominant-negative construct reduced IK1 by about 70%. The dominant-negative effects are specific to the Kir2 family of potassium channels, yet do extend to other members within the family (20, 21). As expression of Kir2.1, Kir2.2, and Kir2.3 subunits has been found in guinea pig (and human, see ref. 22) cardiomyocytes (23), in our experiments, as in Andersen syndrome, not only is Kir2.1 current suppressed by our Kir2.1AAA dominant-negative construct, so should current carried by channels comprised of Kir2.2 and/or Kir2.3 subunits (21). For our purposes, Kir2.1 (wild-type) and Kir2.1AAA were packaged into bicistronic adenoviral vectors also containing GFP and injected into the left ventricular cavity of guinea pigs (see Methods for details).
Cellular electrophysiology results: manipulation of IK1 density.
Left ventricular myocytes were isolated 3–4 days after in vivo transduction and then dispersed into the recording chamber for electrophysiologic study. Transduced myocytes were identified under epifluorescence imaging by their obvious green fluorescence. Infection and transduction with either the overexpression or dominant-negative virus did not affect cell size as gauged by capacitance measurements. Cell capacitances were similar among groups (109.1 ± 6.0 pF, n = 25, vs. 111.6 ± 6.7 pF, n = 12, vs. 117.3 ± 6.1 pF, n = 25, in overexpressed, suppressed, and control groups, respectively). That ICa,L remained unchanged (data not shown) speaks to the specificity of the viral constructs for Kir2 channels.
Myocytes isolated 3–4 days after in vivo transduction with Kir2.1 or Kir2.1AAA exhibited enhancement or suppression of IK1. Figure 2 shows Ba2+-sensitive IK1 records and I-V relationships for each group as determined with square test pulses from –120 to +60 mV (500 ms) applied from the holding potential of –40 mV at 10-mV increments. IK1 density was significantly larger in the overexpressed group and significantly smaller in the suppressed group compared with the control group. Overexpression of Kir2.1 boosted Ba2+-sensitive outward IK1 by 107.1%, whereas suppression of Kir2.1 reduced outward IK1 by 82.1% (at –50 mV, 5.8 ± 0.9 pA/pF, n = 10 vs. 0.5 ± 0.1 pA/pF, n = 9 vs. 2.8 ± 0.2 pA/pF, n = 7, in overexpressed, suppressed, and control groups, respectively). The reversal potential for IK1 in each group remained at about –80 mV and was not changed by gene transfer.
Figure 2.

Kir2.1 overexpression and IK1 suppression. The average Ba2+-sensitive IK1 density was increased in Kir2.1-transduced cells (b and e; n = 10) and decreased in Kir2.1AAA-transduced cells (c and f; n = 9) compared with control cells (a and d; n = 7).
Modification of APs.
Control (n = 24) and Kir2.1 (n = 17) ventricular myocytes fired single APs when subjected to depolarizing external stimuli (Figure 3, a and b). In contrast, Kir2.1AAA myocytes exhibited either of two electrical phenotypes depending upon the extent of IK1 suppression achieved in individual myocytes. Low to moderate degrees of IK1 suppression resulted in stable resting potentials from which external stimuli elicited prolonged APs (Figure 3c, n = 7 of 22). Prolongation of cellular APs would be expected to lengthen the QT interval of the electrocardiogram. Thus, this subgroup of Kir2.1AAA cells is referred to as “long-QT phenotype.” The alternative phenotype, as we described previously in a brief communication, was observed when even greater suppression of IK1 was achieved; spontaneous activity resembling that of genuine pacemaker cells (see Figure 1 in ref. 5). This dramatic effect of IK1 suppression on AP repolarization and morphology suggested that IK1 is essential to modulate excitability and repolarization in the heart.
Figure 3.

AP phenotype is determined by IK1 density. (a) Stable APs evoked by depolarizing external stimuli in control myocytes. (b) APs recorded in overexpressed myocytes with a robust IK1 are abbreviated. (c) In Kir2.1AAA-transduced myocytes with moderately depressed IK1, APs with a long-QT phenotype were evoked. The actual IK1 density measurements from the individual myocytes comprising each group are plotted to the right of each AP waveform.
Influence of IK1 on RMP.
By manipulating the amount of IK1 in transduced cells, we were able to test the conventional wisdom that IK1 plays a fundamental role in maintenance of the stable and polarized RMP of the ventricular myocyte. RMPs in Kir2.1-overexpressed and long QT–phenotype Kir2.1AAA-suppressed myocytes were significantly hyperpolarized and depolarized, respectively, compared with the control (–79.1 ± 0.8 mV, n = 17; –68.0 ± 2.3 mV, n = 7; and –74.7 ± 4.5 mV, n = 24 in overexpressed, suppressed and control groups, respectively). Plots of RMP data from all cells as a function of IK1 density at –50 mV (Figure 4a) revealed that RMP is significantly correlated with IK1 (P = 0.037). Accordingly, a reduction in the outward component of IK1 results in depolarization of RMP. This is the first direct experimental evidence that the amount of IK1 current expressed in a cell sets the RMP in that cell. The actual RMP in the Kir2.1-overexpressed group is indistinguishable from the calculated equilibrium potential for potassium (–92 mV in these experiments) when adjusted for the measured liquid junction potential (approximately –12 mV, see Methods for details).
Figure 4.

Correlation analysis of stable AP and repolarization parameters with outward IK1 density obtained at –50 mV. Graphs show (a) RMP; (b) APD at 50% and (c) 90% repolarization from the overshoot to RMP (APD50 and APD90); (d) repolarization rate between APD50 and APD90 (RR), and dV/dT at (e) APD50 and at (f) APD90. Parameters were tested for correlation with IK1 magnitude in the same cell. *P< 0.01;**P<0.005.
Influence of IK1 on APD.
IK1 is commonly assumed to influence terminal repolarization, but its role earlier during the AP remains a matter of conjecture. We evaluated APD at 50% and 90% repolarization from the overshoot of the AP (APD50 and APD90). APD50 was significantly abbreviated in the overexpressed myocytes but was not significantly changed in the suppressed group compared with control (131.2 ± 9.2 ms, n = 17; 271.9 ± 19.5 ms, n = 7; and 247.6 ± 10.3 ms, n = 24 in the overexpressed, suppressed and control groups, respectively). The effect of IK1 density on repolarization was more pronounced at APD90. APD90 was significantly shorter in the overexpressed group and significantly longer in the suppressed group compared with the control (156.0 ± 9.2 ms, n = 17; 353.4 ± 17.4 ms, n = 7; and 277.2 ± 10.1 ms, n = 24 in the overexpressed, suppressed, and control groups, respectively). Through correlation analysis of APD parameters with IK1 density, we were able to determine that IK1 does impact AP repolarization. Figure 4b and Figure 4c show the relationships between APD and IK1 density (at –50 mV). There was a significant correlation between APD50 (P = 0.004) and APD90 (P = 0.002) and IK1 density. When IK1 was increased through overexpression of Kir2.1, APD50 and APD90 were shortened. When IK1 was decreased through suppression of endogenous IK1 by Kir2.1AAA transduction, APD50 and APD90 were prolonged.
Influence of IK1 on phase 3 repolarization rate.
As the impact of IK1 on repolarization was more pronounced at APD90 than at APD50, we further evaluated the repolarization phase of APs. The rate of AP repolarization was quantified as the slope between APD50 and APD90, as illustrated in Figure 4d using this equation: repolarization rate = (voltage at APD50 – voltage at APD90)/(APD90 – APD50). Kir2.1 overexpression did not significantly enhance repolarization rate. However, Kir2.1 suppression reduced the repolarization rate compared with that in control cells (2.2 ± 0.2 mV/ms, n = 17; 0.8 ± 0.2 mV/ms, n = 7; 1.9 ± 0.1 mV/ms, n = 24 in the overexpressed, suppressed, and control groups, respectively). In addition, repolarization rate correlated significantly (P = 0.002) with IK1 density: decreased IK1 resulted in a reduction in repolarization rate (Figure 4d).
In order to determine which region of AP repolarization was most influenced by IK1, we evaluated dV/dt at APD50 and at APD90. There was no significant change in dV/dt at APD50 in either Kir2.1-overexpressed or -suppressed cells (Figure 4e). In addition, dV/dt at APD50 did not correlate significantly (P = 0.14) with IK1 density, (–1.06 ± 0.12 mV/ms, n = 17; –0.53 ± 0.05 mV/ms, n = 7; and –0.84 ± 0.08 mV/ms, n = 24 in the overexpressed, suppressed and control groups, respectively).
IK1 did determine dV/dt at APD90 (–3.65 ± 0.27 mV/ms, n = 17; –0.97 ± 0.20 mV/ms, n = 7; and –2.93 ± 0.18 mV/ms, n = 24 in the overexpressed, suppressed and control groups, respectively), as indicated by the strong correlation between dV/dt at APD90 and IK1 density at –50 mV (P < 0.0001; Figure 4f). Thus, acceleration of terminal repolarization by Kir2.1 overexpression and deceleration of repolarization by IK1 suppression became prominent beyond the point of APD50. Although not statistically significant, the mean dV/dt data at APD50 show a trend that is indicative of the prominent effects observed at APD90.
IK1 density determines myocyte electrical phenotype.
To test whether the electrical phenotype of individual myocytes was dependent upon the IK1 expression level in each cell, we compared IK1 densities in control, IK1-overexpression, and IK1-suppression cells in which APs were also recorded. The individual current measurements plotted in Figure 3 define a specific range of IK1 density within each group of cells. IK1 densities in control cells were scattered evenly between 1.7 and 3.7 pA/pF (Figure 3a). In the overexpressed group (Figure 3b), IK1 density ranged from 2.8 to 12.0 pA/pF, with some clustering around the mean (5.8 ± 0.9 pA/pF). Measurements of IK1 density in long QT–phenotype Kir2.1AAA myocytes ranged from a low of 0.4 pA/pF to a high of 1.3 pA/pF (Figure 3c). Furthermore, as we reported previously, when IK1 was suppressed below 0.4 pA/pF, all Kir2.1AAA myocytes exhibited spontaneous APs (5). Thus, the precise level of IK1 current expressed in each cell determines the electrical phenotype and AP morphology of the ventricular myocyte.
Electrocardiogram recordings: influence of IK1 on QT interval.
To define the global effects of IK1 overexpression and suppression in vivo, we recorded surface electrocardiograms in lightly anesthetized animals. At 72 hours after injection and stimulation with GS-E, the QTc (calculated with the Hayes’ square-root correction formula; see Methods for details) was significantly abbreviated in the Kir2.1-transduced animals (Figure 5a) compared with measurements made in the same animal immediately after surgery (159.1 ± 2.5 ms vs. 146.8 ± 2.1 ms, n = 4, P < 0.005 by paired t test). No arrhythmias were observed in any of the four animals studied in the overexpressed group. The opposite effect was seen in Kir2.1AAA-transduced animals (Figure 5b): the QTc interval was significantly prolonged due to in vivo suppression of IK1 (155.3 ± 3.5 ms vs. 181.2 ± 4.3 ms, n = 3, P < 0.05 by paired t test).
Figure 5.

Electrocardiograms before and after gene transduction. (a) QTc intervals were abbreviated in overexpressed animals at 72 hours after Kir2.1 transduction. (b) In three of five suppressed animals, QTc intervals were prolonged at 72 hours after transduction of Kir2.1AAA.
Electrocardiography of animals in the suppressed group revealed two phenotypes in vivo. Three of five Kir2.1AAA-transduced animals maintained normal sinus rhythms despite significant QT prolongation. However, as we reported previously, two animals with more severe IK1 suppression exhibited an altered cardiac rhythm indicative of spontaneous ventricular foci (5). The in vivo Kir2.1AAA phenotypes correspond well to the distinct cellular long-QT phenotype (Figure 3c) and pacemaker phenotype, as previously identified by Miake et al. (5). The abbreviation and prolongation of the QTc interval by Kir2.1 overexpression and IK1 suppression correspond well to the AP abbreviation and AP prolongation observed at the cellular level. There was no difference in the QTc interval recorded immediately after surgery between the overexpressed and suppressed groups of animals (P = 0.74).
In summary, in vivo manipulation of Kir2.1 expression significantly modified IK1 in ventricular myocytes. The most pronounced effects of our modulation of IK1 at the cellular level were modification of APD, repolarization rate, and the determination of RMP. Similarly, in vivo effects were observed as abbreviation and prolongation of the QTc interval. In conclusion, our results, obtained through direct experimentation, establish that I K1 plays an essential role in ventricular excitability: rapid terminal repolarization and maintenance of a stable and polarized RMP.
Discussion
IK1 regulates cardiac excitability.
Kir channels have been believed to contribute to cellular excitability and to be the primary determinants of RMP by encoding IK1. However, it has not been demonstrated that augmentation and reduction of IK1 via manipulation of Kir2.1 expression directly modifies RMP and regulates cardiac excitability. Furthermore, there has been no quantitative analysis of the relationships between IK1 and RMP or repolarization. Previous investigations have used several strategies for modification of Kir2.1, including a Kir2.1- (and Kir2.2-) knockout mouse (24), antisense oligonucleotide targeting of Kir2.1 (25), and transfection of plasmid with a dominant-negative construct (21).
These studies may have helped to define the role of IK1 in cardiac excitability. In the knockout mouse, however, an accurate functional assessment of Kir2.1 in adult animals was not possible because the Kir2.1 deficiency proved to be lethal shortly after birth. As a result, the consequences of the IK1 deficit in the heart (QT prolongation without any occurrence of arrhythmias) could be evaluated only in newborn Kir2.1-knockout mice (24). Interestingly, most ventricular myocytes isolated from the Kir2.1-knockout mice were unable to maintain a normal, polarized resting potential without the injection of exogenous hyperpolarizing current. The discrepancy between the unstable cellular phenotype and the in vivo electrical phenotype in that study remains unexplained. Manipulation of IK1 in the opposite direction (enhancement) has not previously been reported. The lack of pharmacologic tools to specifically block or enhance IK1 has also contributed to the paucity of biological data to assess the role of IK1 in cardiac excitability. In this study we used in vivo delivery of adenoviruses as a gene transfer strategy for modification of IK1. This allowed us to investigate the role of IK1 by studying freshly isolated ventricular myocytes from an adult animal with augmented or diminished IK1 density. We establish through direct experimentation that IK1 expression level does modify the RMP and modulate cardiac excitability.
We observed that overexpression of Kir2.1 significantly increased IK1 density, and conversely, overexpression of the dominant-negative Kir2.1AAA significantly decreased IK1. Additionally, we demonstrated that IK1 overexpression significantly hyperpolarized the RMP, and conversely, IK1 suppression significantly depolarized RMP. Interestingly, when RMP and IK1 density data were obtained in the same cell, RMP was well correlated with IK1 density. Thus, IK1 regulates cardiac excitability by controlling diastolic RMP.
We also investigated the effect on APD of manipulating IK1 magnitude. Overexpression of Kir2.1 shortened APD50 and APD90, and conversely, IK1 suppression, prolonged APD90 but not APD50. Furthermore, both APD50 and APD90 were well correlated with IK1 density, as shown by regression analysis (see Figure 4, b and c). However, the relationship between APD90 and IK1 density was stronger and more significant than that between APD50 and IK1 density (Figure 4, e and f). In this study, repolarization rate and dV/dt at APD90 were determined by outward IK1. However, dV/dt at APD50 was not significantly affected (although a trend may be noted). We believe that our manipulation of IK1 density had a comparatively greater impact on APD90 than on APD50 because outward IK1 is larger at voltages in the vicinity of APD90 than near APD50 (see Figure 2; note the characteristic outward hump in the I-V relationship). This prominent inward rectification of IK1 results from voltage-dependent block of the channel pore by cytoplasmic polyamines (26). Based upon our APD results, we have determined that IK1 regulates cardiac excitability by contributing significant repolarizing current during the terminal phase of the cardiac AP.
IK1 establishes AP phenotype.
We observed the prominent influence of IK1 expression on AP morphology by comparing the electrical behavior of the IK1-suppressed cells to that of their control or Kir2.1-overexpressed counterparts. During current-clamp recordings, all of the control and Kir2.1-overexpressed cells were quiescent and well polarized. Meanwhile, APs stimulated in approximately 32% of Kir2.1AAA-transduced myocytes took on a long-QT phenotype, and as noted in our previous report (5), the balance of the Kir2.1AAA-transduced cells exhibited spontaneous APs due to more intense IK1 suppression (5). Due to the reduction in IK1, the RMP of the ventricular myocytes is less firmly clamped to voltages near the potassium equilibrium potential, and once voltage-activated K+ channels have closed, any net depolarizing current is left relatively unopposed to initiate spontaneous depolarization. Compared with control cells, IK1 was significantly larger in Kir2.1 overexpressed cells with abbreviated APs and was significantly smaller in suppressed cells with long QT–phenotype APs. Furthermore, we have defined threshold levels of outward IK1 (at –50 mV) necessary for a well-polarized RMP (>0.4 pA/pF) and normal AP morphology (>1.7 pA/pF). Thus, IK1 establishes the characteristic AP phenotype in ventricular myocytes.
IK1 modifies electrocardiogram manifestation.
The dramatic impact of IK1 overexpression to abbreviate APD and of IK1 suppression to prolong APD in individual myocytes gave good reason to predict that the QTc interval might be similarly altered via global transduction of the heart. The QTc intervals were consistently abbreviated by Kir2.1 overexpression and prolonged by IK1 suppression relative to baseline. These observations were considered to be the global phenomena corresponding to the abbreviated APs and long QT–phenotype APs observed in the overexpressed and suppressed myocytes, respectively. The QTc prolongation seen in Kir2.1-suppressed animals supports the clinical observations made with Andersen syndrome (3, 4). This is especially relevant since conditions that favor AP prolongation are also prerequisite for the development of early afterdepolarizations (27), which are presumptive triggers for ventricular arrhythmias (28). In fact, we reported that the increased automaticity in the suppressed myocytes was sufficient to supersede the normal pacemaker role of the sinoatrial node in two Kir2.1AAA-transduced animals (5). Our in vivo results verify that our manipulation of IK1 density was not only sufficient to alter the cellular electrical behavior, but our transduction efficiency was sufficiently widespread to induce parallel global effects.
Clinical implications.
Using dominant-negative suppression of Kir2 channels, we reproduced some of the clinical observations in heart failure and Andersen syndrome, namely, reduced IK1 expression and QT prolongation. It is important to note that in our experiments, as in Andersen syndrome, Kir2.1 dominant-negative mutations should suppress function of homomeric and heteromeric Kir2 channels comprised of Kir2.1, Kir2.2, and Kir2.3 subunits (21). In contrast to the results we obtained using the dominant-negative Kir2.1AAA, the complex phenotype of Andersen syndrome may arise because specific mutations may also affect coassembly of Kir2 subunits into homomeric or heteromeric channels in addition to suppressing channel function (21). Our experiments provide evidence that the long-QT phenotype seen in Andersen syndrome can arise as a direct consequence of dominant-negative suppression of Kir2 channel function. Our results at the cellular level help us to understand the mechanisms underlying the clinical manifestations of these diseases. Genetic suppression of IK1 decelerates cellular AP repolarization, prolongs APD, and depolarizes and destabilizes RMP. Lastly, our results provide mechanistic insight with which to design new pharmacologic- and genetic-based therapies for diseases resulting in whole or in part from a reduction in IK1.
Acknowledgments
Research for this study was supported by an American Heart Association Scientist Development Grant and by NIH/NHLBI grant 1 HL-66381 (to H.B. Nuss) and NIH/NHLBI SCOR grant P50 HL-52307. E. Marbán holds the Michel Mirowski, MD, Professorship of Cardiology at Johns Hopkins University.
Footnotes
Junichiro Miake’s present address is: First Department of Internal Medicine, Tottori University Faculty of Medicine, Yonago, Japan.
H. Bradley Nuss’ present address is: Cardiology Research Group, Department of Medicine, Division of Cardiology, University of Maryland School of Medicine, Baltimore, Maryland, USA.
Conflict of interest: The authors have declared that no conflict of interest exists.
Nonstandard abbreviations used: inward rectifier current (IK1); action potential (AP); resting membrane potential (RMP); L-type calcium current (ICa,L); action potential duration (APD); heart rate–corrected QT interval (QTc interval).
References
- 1.Sanguinetti, M.C., and Tristani-Firouzi, M. 2000. Delayed and inward rectifier potassium channels. In Cardiac electrophysiology: from cell to bedside. 3rd edition. D.P. Zipes and J. Jalife, editors. W.B. Saunders Co. Philadelphia, Pennsylvania, USA. 79–86.
- 2.Beuckelmann DJ, Nabauer M, Erdmann E. Alterations of K+ currents in isolated human ventricular myocytes from patients with terminal heart failure. Circ. Res. 1993;73:379–385. doi: 10.1161/01.res.73.2.379. [DOI] [PubMed] [Google Scholar]
- 3.Plaster NM, et al. Mutations in Kir2.1 cause the developmental and episodic electrical phenotypes of Andersen’s syndrome. Cell. 2001;105:511–519. doi: 10.1016/s0092-8674(01)00342-7. [DOI] [PubMed] [Google Scholar]
- 4.Tristani-Firouzi M, et al. Functional and clinical characterization of KCNJ2 mutations associated with LQT7 (Andersen syndrome) J. Clin. Invest. 2002;110:381–388. doi:10.1172/JCI200215183. doi: 10.1172/JCI15183. [DOI] [PMC free article] [PubMed] [Google Scholar]
- 5.Miake J, Marban E, Nuss HB. Gene therapy: biological pacemaker created by gene transfer. Nature. 2002;419:132–133. doi: 10.1038/419132b. [DOI] [PubMed] [Google Scholar]
- 6.Johns DC, Marx R, Mains RE, O’Rourke B, Marban E. Inducible genetic suppression of neuronal excitability. J. Neurosci. 1999;19:1691–1697. doi: 10.1523/JNEUROSCI.19-05-01691.1999. [DOI] [PMC free article] [PubMed] [Google Scholar]
- 7.Ashen MD, O’Rourke B, Kluge KA, Johns DC, Tomaselli GF. Inward rectifier K+ channel from human heart and brain: cloning and stable expression in a human cell line. Am. J. Physiol. 1995;268:H506–H511. doi: 10.1152/ajpheart.1995.268.1.H506. [DOI] [PubMed] [Google Scholar]
- 8.Hardy S, Kitamura M, Harris-Stansil T, Dai Y, Phipps ML. Construction of adenovirus vectors through Cre-lox recombination. J. Virol. 1997;71:1842–1849. doi: 10.1128/jvi.71.3.1842-1849.1997. [DOI] [PMC free article] [PubMed] [Google Scholar]
- 9.Hajjar RJ, et al. Modulation of ventricular function through gene transfer in vivo. Proc. Natl. Acad. Sci. U. S. A. 1998;95:5251–5256. doi: 10.1073/pnas.95.9.5251. [DOI] [PMC free article] [PubMed] [Google Scholar]
- 10.Ennis IL, Li RA, Murphy AM, Marban E, Nuss HB. Dual gene therapy with SERCA1 and Kir2.1 abbreviates excitation without suppressing contractility. J. Clin. Invest. 2002;109:393–400. doi:10.1172/JCI200213359. doi: 10.1172/JCI13359. [DOI] [PMC free article] [PubMed] [Google Scholar]
- 11.Hoppe UC, Marban E, Johns DC. Adenovirus-mediated inducible gene expression in vivo by a hybrid ecdysone receptor. Mol. Ther. 2000;1:159–164. doi: 10.1006/mthe.1999.0023. [DOI] [PubMed] [Google Scholar]
- 12.Mitra R, Morad M. Two types of calcium channels in guinea pig ventricular myocytes. Proc. Natl. Acad. Sci. U. S. A. 1986;83:5340–5344. doi: 10.1073/pnas.83.14.5340. [DOI] [PMC free article] [PubMed] [Google Scholar]
- 13.Hamill OP, Marty A, Neher E, Sakmann B, Sigworth FJ. Improved patch-clamp techniques for high-resolution current recording from cells and cell-free membrane patches. Pflugers Arch. 1981;391:85–100. doi: 10.1007/BF00656997. [DOI] [PubMed] [Google Scholar]
- 14.Neher E. Correction for liquid junction potentials in patch clamp experiments. Methods Enzymol. 1992;207:123–131. doi: 10.1016/0076-6879(92)07008-c. [DOI] [PubMed] [Google Scholar]
- 15.Hayes E, Pugsley MK, Penz WP, Adaikan G, Walker MJ. Relationship between QaT and RR intervals in rats, guinea pigs, rabbits, and primates. J. Pharmacol. Toxicol. Methods. 1994;32:201–207. doi: 10.1016/1056-8719(94)90088-4. [DOI] [PubMed] [Google Scholar]
- 16.Donahue JK, et al. Focal modification of electrical conduction in the heart by viral gene transfer. Nat. Med. 2000;6:1395–1398. doi: 10.1038/82214. [DOI] [PubMed] [Google Scholar]
- 17.Herskowitz I. Functional inactivation of genes by dominant negative mutations. Nature. 1987;329:219–222. doi: 10.1038/329219a0. [DOI] [PubMed] [Google Scholar]
- 18.Slesinger PA, et al. Functional effects of the mouse weaver mutation on G protein-gated inwardly rectifying K+ channels. Neuron. 1996;16:321–331. doi: 10.1016/s0896-6273(00)80050-1. [DOI] [PubMed] [Google Scholar]
- 19.Heginbotham L, Lu Z, Abramson T, MacKinnon R. Mutations in the K+ channel signature sequence. Biophys. J. 1994;66:1061–1067. doi: 10.1016/S0006-3495(94)80887-2. [DOI] [PMC free article] [PubMed] [Google Scholar]
- 20.Tinker A, Jan YN, Jan LY. Regions responsible for the assembly of inwardly rectifying potassium channels. Cell. 1996;87:857–868. doi: 10.1016/s0092-8674(00)81993-5. [DOI] [PubMed] [Google Scholar]
- 21.Preisig-Muller R, et al. Heteromerization of Kir2.x potassium channels contributes to the phenotype of Andersen’s syndrome. Proc. Natl. Acad. Sci. U. S. A. 2002;99:7774–7779. doi: 10.1073/pnas.102609499. [DOI] [PMC free article] [PubMed] [Google Scholar]
- 22.Wang Z, Yue L, White M, Pelletier G, Nattel S. Differential distribution of inward rectifier potassium channel transcripts in human atrium versus ventricle. Circulation. 1998;98:2422–2428. doi: 10.1161/01.cir.98.22.2422. [DOI] [PubMed] [Google Scholar]
- 23.Liu GX, et al. Comparison of cloned Kir2 channels with native inward rectifier K+ channels from guinea-pig cardiomyocytes. J. Physiol. 2001;532:115–126. doi: 10.1111/j.1469-7793.2001.0115g.x. [DOI] [PMC free article] [PubMed] [Google Scholar]
- 24.Zaritsky JJ, Redell JB, Tempel BL, Schwarz TL. The consequences of disrupting cardiac inwardly rectifying K(+) current (I(K1)) as revealed by the targeted deletion of the murine Kir2.1 and Kir2.2 genes. J. Physiol. 2001;533:697–710. doi: 10.1111/j.1469-7793.2001.t01-1-00697.x. [DOI] [PMC free article] [PubMed] [Google Scholar]
- 25.Nakamura TY, Artman M, Rudy B, Coetzee WA. Inhibition of rat ventricular IK1 with antisense oligonucleotides targeted to Kir2.1 mRNA. Am. J. Physiol. 1998;274:H892–H900. doi: 10.1152/ajpheart.1998.274.3.H892. [DOI] [PubMed] [Google Scholar]
- 26.Lopatin AN, Makhina EN, Nichols CG. Potassium channel block by cytoplasmic polyamines as the mechanism of intrinsic rectification. Nature. 1994;372:366–369. doi: 10.1038/372366a0. [DOI] [PubMed] [Google Scholar]
- 27.Cranefield, P.F., and Aronson, R.S. 1988. Cardiac arrhythmias: the role of triggered activity and other mechanisms. Futura Publishing Co. Mount Kisco, New York, USA. 706 pp.
- 28.January CT, Riddle JM. Early afterdepolarizations: mechanism of induction and block. A role for L-type Ca2+ current. Circ. Res. 1989;64:977–990. doi: 10.1161/01.res.64.5.977. [DOI] [PubMed] [Google Scholar]