

Abstract
Objectives. Requiring restaurants to present nutrition information on menus is under consideration as a potential way to slow the increasing prevalence of obesity. Using a survey methodology, we examined how accurately consumers estimate the nutrient content of typical restaurant meals. Based on these results, we then conducted an experiment to address how the provision of nutrition information on menus influences purchase intentions and reported preferences.
Methods. For both the survey and experiment, data were analyzed using analysis of variance techniques.
Results. Survey results showed that levels of calories, fat, and saturated fat in less-healthful restaurant items were significantly underestimated by consumers. Actual fat and saturated fat levels were twice consumers’ estimates and calories approached 2 times more than what consumers expected. In the subsequent experiment, for items for which levels of calories, fat, and saturated fat substantially exceeded consumers’ expectations, the provision of nutrition information had a significant influence on product attitude, purchase intention, and choice.
Conclusions. Most consumers are unaware of the high levels of calories, fat, saturated fat, and sodium found in many menu items. Provision of nutrition information on restaurant menus could potentially have a positive impact on public health by reducing the consumption of less-healthful foods.
Sixty-four percent of American adults are either overweight or obese, and the obesity epidemic shows few signs of weakening.1,2 Although the precise number of deaths attributable to obesity is difficult to estimate, obesity is clearly a major cause of preventable death.3,4,5 Not surprisingly, improving the healthfulness of the American diet has become a national health priority.4,6 The increasing prevalence of obesity-related diseases has been blamed, in part, on the increased consumption of foods prepared outside the home. Restaurant expenditures have increased consistently in recent decades; consumers now spend more than $400 billion annually.7
Increased consumption of food prepared outside the home and the rising percentage of overweight Americans have made the failure to disclose the nutritional content of restaurant foods a significant public health issue. Whereas the Nutrition Labeling and Education Act increased the availability of nutrition information on packaged foods, foods purchased for immediate consumption are exempt from nutrition disclosure requirements. Typically, fast-food restaurants make nutrition information available to consumers upon request through brochures or on their corporate Web sites. Most dinner house restaurants (i.e., restaurants that offer table service in an informal atmosphere) disclose the nutrient content of their menu items only via the Internet, if at all.
Laws governing the provision of nutrition information in restaurants have been under consideration by Congress. The Menu Education and Labeling Act would require chain restaurants with 20 or more outlets to provide key nutrient information. Legislation has also been proposed in several states (e.g., New York) that would require restaurants with 10 or more national locations to disclose the calorie and nutrient content, such as fat and saturated fat levels, of their foods.8 The Food and Drug Administration has initiated preliminary discussions about national standards for the provision of nutrition information in restaurants in response to these legislative initiatives.9
We examined the potential public health benefits of providing easily accessible nutrition information in restaurants through 2 studies. In study 1, a survey of consumers was used to examine the accuracy of consumers’ expectations of the calorie, fat, saturated fat, and sodium levels of restaurant foods, and sought to determine whether the difference between expected and objective levels varied depending on the calorie and nutrient levels of the items. In study 2, drawing on findings from our survey, we investigated how the provision of nutrition information on a menu affected consumers’ attitudes and purchase intentions when objective calorie and nutrient levels were either much higher or about the same as consumers expected.
STUDY 1: SURVEY
Recent legal and regulatory initiatives regarding nutrition information disclosure in restaurants are largely driven by an interest in the negative health consequences associated with the overconsumption of calories and nutrients such as fat, saturated fat, and sodium. This raises an important question: What are the expectations of reasonable consumers regarding the nutrient levels of typical restaurant fare? Study 1 compared estimated calorie, fat, saturated fat, and sodium levels of foods typically served in dinner house restaurants with objective values determined by laboratory testing.
We proposed that most consumers lack the expertise necessary to estimate calorie and nutrient levels accurately. Because nutrition information is difficult, if not impossible, to obtain in most dinner house restaurants, consumers are unlikely to realize that large restaurant portions of higher-calorie and higher-fat menu items (e.g., large bowl of fettuccine Alfredo) may exceed a full day’s worth of fat and saturated fat. Therefore, we expected consumers to substantially underestimate calories and fat, saturated fat, and sodium levels. This is consistent with previous research showing that when presented with large portion sizes of less-healthful foods, professional nutritionists underestimated calorie levels by between 200 and 600 calories.10 However, we anticipated that consumers’ estimates would be more accurate for the food items lower in calories and fat (e.g., grilled chicken breast).
Thus, we hypothesized that (1) the difference between consumers’ expectations and objective levels of calories and nutrients would be greater for items with higher levels of calories, fat, and sodium than for items with lower levels of calories, fat, and sodium (hypothesis 1) and that (2) a greater percentage of consumers would underestimate calorie and nutrient levels for menu items with higher levels of calories, fat, and sodium than for items with lower levels (hypothesis 2).
METHODS
Study participants were recruited through a statewide mail research panel and by undergraduate students. Ninety-seven percent of respondents had dined at a restaurant in the past month; the mean dining-out frequency was 14 meals. Almost all (97%) were high-school graduates and 81% had at least some college. The median age of respondents was 39 years, and 60% were female. The total sample size was 193 respondents. Results of tests of hypotheses were consistent across demographic groups, the household research panel respondents, and the sample of adult consumers.
For 9 restaurant entrées, survey participants were given serving size information and brief item descriptions, similar to information that would appear on a menu. For each item, participants estimated calories, fat, saturated fat, and sodium levels. Measures of the objective (actual) calorie and nutrient levels for each of the 9 items were obtained from independent laboratory testing performed previously for dinner house restaurant items.11 Three items shown in Table 1 ▶ (e.g., grilled chicken breast) were lower in calories and fat (370 to 640 calories; 6 to 26 g of fat) than other entrées. Five items (e.g., hamburger with fries) were much less healthful (930 to 1660 calories; 63 to 97 g of fat). (Although it can be argued that there are no “unhealthful” foods within the context of an entire diet, for the sake of brevity, we use the terms “less” and “more healthful” to refer to menu items higher/lower in calories, fat, and sodium.) The remaining item (cheese fries with ranch dressing) had extremely high calorie and nutrient levels (3010 calories; 217 g of fat) and was termed “extremely unhealthful.”
TABLE 1—
Accuracy of Consumers’ Estimates of Calories, Fat, Saturated Fat, and Sodium for Restaurant Menu Itemsa,b
| Calories | Fat | Sodium | Saturated Fat | |||||||||||||
| Mean Calorie Expectation Estimates | Objective Calorie Levels | Mean Difference Between Expectations and Objective Levels (% of Misestimation)c | Percentage Underestimating Calories (Overestimating Calories) | Mean Fat Expectation Estimates, g | Objective Fat Levels, g | Mean Difference Between Expectations and Objective Levels (% of Misestimation) | Percent Underestimating Fat (Overestimating Fat) | Mean Sodium Expectation Estimates, mg | Objective Sodium Levels, mg | Mean Difference Between Expectations and Objective Levels (% of Misestimation) | Percentage Underestimating Sodium (Overestimating Sodium) | Mean Saturated Fat Expectation Estimates, g | Objective Saturated Fat Levels, g | Mean Difference Between Expectations and Objective Levels (% of Misestimation) | Percentage Underestimating Saturated Fat (Overestimating Saturated Fat) | |
| Less-healthful items | ||||||||||||||||
| Means | 694 | 1336 | −642 (−93) | 90 (10) | 32 | 76 | −44 (−137) | 90 (10) | 457 | 2014 | −1557 (−341) | 93 (7) | 15 | 30 | −15 (−100) | 80 (20) |
| Fettuccine Alfredo | 704 | 1500 | −796 (−113) | 90 (10) | 31 | 97 | −66 (−213) | 96 (4) | 478 | 1030 | −552 (−115) | 88 (12) | 13 | 48 | −35 (−269) | 95 (5) |
| Hamburger and fries | 777 | 1240 | −463 (−60) | 88 (12) | 37 | 67 | −30 (−81) | 85 (15) | 523 | 1270 | −747 (−143) | 87 (13) | 17 | 29 | −12 (−71) | 77 (23) |
| Chicken fajitas | 704 | 1660 | −956 (−136) | 96 (4) | 31 | 63 | −32 (−103) | 82 (18) | 451 | 3660 | −3209 (−712) | 99 (1) | 14 | 19 | −5 (−36) | 67 (33) |
| Chef’s salad | 452 | 930 | −478 (−106) | 90 (10) | 21 | 71 | −50 (−238) | 97 (3) | 328 | 2510 | −2182 (−665) | 99 (1) | 9 | 18 | −9 (−100) | 82 (18) |
| Patty melt and fries | 834 | 1350 | −516 (−62) | 84 (16) | 41 | 81 | −40 (−98) | 88 (12) | 504 | 1600 | −1096 (−217) | 93 (7) | 20 | 37 | −17 (−85) | 80 (20) |
| More-healthful items | ||||||||||||||||
| Means | 500 | 543 | −43 (−9) | 73 (27) | 23 | 15 | 8 (35) | 37 (63) | 333 | 1180 | −847 (−254) | 92 (8) | 11 | 6 | 5 (45) | 30 (70) |
| Chicken breast | 479 | 640 | −161 (−34) | 78 (22) | 22 | 14 | 8 (36) | 37 (63) | 321 | 820 | −499 (−155) | 88 (12) | 10 | 5 | 5 (50) | 27 (73) |
| Pot roast | 663 | 620 | 43 (6) | 65 (35) | 33 | 26 | 7 (21) | 48 (52) | 425 | 1310 | −885 (−208) | 92 (8) | 15 | 11 | 4 (27) | 47 (53) |
| Turkey sandwich | 358 | 370 | −12 (−3) | 75 (25) | 15 | 6 | 9 (60) | 26 (74) | 254 | 1410 | −1156 (−455) | 96 (4) | 7 | 2 | 5 (71) | 17 (83) |
| Very unhealthful item: cheese fries with ranch dressing | 869 | 3010 | −2141 (−246) | 99 (1) | 40 | 217 | −177 (−443) | 97 (3) | 537 | 4890 | −4353 (−811) | 99 (1) | 21 | 91 | −70 (−333) | 93 (7) |
aInformation provided for the 9 restaurant menu items included brief descriptions, size of the item in ounces, and any side dishes, all drawn from Jacobson and Hurley.11
bOn the basis of a 2000-calorie diet, the recommended daily values are 65 g for fat, 2400 mg for sodium, and 20 g for saturated fat.
cThis is the difference between consumers’ calorie estimates and the objective levels determined by laboratory testing.The percentage (shown in parentheses) is the mean difference divided by consumers’ calorie expectations (e.g., −642/694 = −93%).
d This is the difference between consumers’ sodium estimates and the objective levels determined by laboratory testing. The percentage (shown in parentheses) is the mean difference divided by consumers’ expectations (e.g., −1557/457 = −341%).
RESULTS
For each menu item, Table 1 ▶ presents consumers’ estimated (expected) calorie and nutrient levels, the objective levels, the mean difference between estimated and objective levels, and the percentage of consumers who either overestimated or underestimated calorie and nutrient levels. As shown, less-healthful items were judged to be higher in calories and fat than more-healthful items. This indicates that consumers are at least somewhat aware of nutritional differences among foods.
To test hypothesis 1, individual accuracy scores for calorie and nutrient levels were calculated by subtracting the objective levels from the consumer-estimated levels. These deviation scores were used as the dependent variables in a series of repeated-measures analyses of variance. Differences between consumers’ estimates and objective values varied substantially across the more-healthful, less-healthful, and extremely unhealthful items.
For calories, results of the repeated-measures analyses were highly significant (F = 2530; P < .001). On average, participants underestimated the calorie levels of less-healthful items by 642 calories; objective levels (1336 calories) were almost twice as high as consumers’ estimates. The calorie content of cheese fries with ranch dressing (3010 calories) was underestimated by more than 2000 calories. Consumers slightly underestimated calories of the more-healthful items. Follow-up contrasts on the difference scores between expected and the objective calorie measures showed significant differences between the more- (M = −43) and less(M = −642) healthful items, as well as between the less-healthful items and the extremely unhealthful item (t values = 37.4 and 54.8, respectively; P < .001 for both comparisons). Thus, as posited, the differences between consumers’ calorie estimates and objective levels were far greater for items with less-healthful nutritional content.
Similarly, consumers’ expectations of nutrient levels (fat, saturated fat, and sodium) were less consistent with the objective levels for less-healthful items than for more-healthful items. Results from repeated-measures analyses of variance for each nutrient using the difference between consumers’ estimates and objective values as the dependent variable resulted in significant findings for all 3 nutrients (F values exceeded 700 for all tests, P < .001). For the less-healthful items, consumers underestimated fat and saturated fat levels by 44 g and 15 g, respectively—amounts that were more than 60% of the recommended daily values. Estimated fat and saturated fat levels for the more-healthful items were more consistent with objective levels (and even slightly higher). Consumers underestimated sodium levels for the more-healthful items by 847 mg, whereas they underestimated the amount of sodium in the less-healthful and extremely unhealthful items by 1557 mg and 4353 mg, respectively. For all nutrients, follow-up contrasts showed significant differences between the more-/less-healthful and less-/extremely unhealthful groups.
To address differences in percentages of consumers underestimating calorie and nutrient levels, cross-tabulation analyses were performed. As shown in Table 1 ▶, 90%, 99%, and 73% of respondents underestimated calories for the less-healthful, very unhealthful, and more-healthful items, respectively (χ2 = 102.2; P < .001). For fat, 90%, 97%, and 37% of respondents underestimated levels for the less-healthful, very unhealthful, and more-healthful items, respectively (χ2 = 509.1; P < .001). The pattern of findings was similar for saturated fat (χ2 = 433.6; P < .001). Although most consumers underestimated sodium levels of all the items, differences were significant (χ2 = 13.3; P < .01). These findings support hypothesis 2.
STUDY 2: EXPERIMENT
Given that consumers appear unaware of the high levels of calories, fat, and sodium found in many foods typically served in restaurants, the purpose of study 2 was to examine the potential public health benefits associated with the provision of nutrition information in restaurants. Specifically, we examined how providing nutrition information influenced consumers’ attitudes and purchase intentions for restaurant menu items. For each menu entrée, consumers were also asked to estimate how likely they were to gain weight and develop heart disease if that food item was included as a regular part of their diet. These risk perceptions were expected to be influenced by the provision of nutrition information.
Classic expectancy disconfirmation theory can be used to predict consumers’ responses when accurate calorie and nutrient information are disclosed.12,13 According to this theory, consumers form initial expectations about specific product attributes. If the actual information or subsequent experience does not meet expectations, then attribute dissatisfaction will occur, which creates negative attitudes.12 If actual product information exceeds expectations, positive attitudes result.
Study 1 showed that calories, fat, and sodium in less-healthful restaurant menu items are much higher than consumers expect. However, the objective nutrient levels of more-healthful items were relatively consistent or slightly better than what consumers expected. Therefore, for less-healthful items, the provision of nutrition information should disconfirm consumers’ nutrition-related expectations resulting in unfavorable attitudes and decreased purchase likelihoods. Consumers’ perceptions regarding the likelihood of weight gain and heart disease risk should also be higher.14 Expectancy disconfirmation theory thus suggests that the discrepancy between expected and objective nutrient levels should result in an interaction between the provision of nutrition information and the healthfulness of the menu item. Negative disconfirmation for less-healthful items is expected to lead to decreases in measures of attitudes and purchase intentions and to increase choice preference for more-healthful items. In addition, these effects should generally be greater when both the number of calories and the nutrient levels are provided, compared with when calorie information (a single attribute) is presented alone.
Thus, we hypothesized that (1) when objective nutrition information is less favorable than consumers expect, providing nutrition information would have a greater negative influence on product attitudes and purchase intentions and a greater positive influence on perceived likelihood of weight gain and heart disease (hypothesis 3a); (2) when objective nutrition information is less favorable than consumers expect, providing both calorie and nutrient information would have the strongest influence (hypothesis 3b); and (3) providing nutrition information on menus would decrease choice preference for items with objective nutrition information that is less favorable than consumers expect and increase choice preference for items more consistent with expectations (hypothesis 4).
METHODS
Participants
Participants in a geographically dispersed area throughout a single south-central state responded to a mail survey. Participants were mailed packets that included 1 of the randomly assigned 6 menu stimuli, a survey including measures of interest, and a stamped self-return envelope. Completed surveys were returned by 241 respondents, a response rate of 50%. Almost all respondents were high-school graduates (97%), 63% were female, and ages ranged from 23 to 85 years. For the 6 groups in the design, cell sizes ranged from 38 to 42 participants.
Design
Study 2 had a 3 (nutrition information) × 2 (daily value information) × 4 (menu item) mixed experimental design. The nutrition information and daily value manipulations are between-subjects factors and menu item is a repeated-measure factor. Nutrient information conditions are: (1) calories, fat, saturated/ trans fats, and sodium levels presented, (2) only calorie information presented, and (3) no nutrition information presented (status quo in most restaurants). (Note that most proposed legislation would require calorie-plus-nutrient information for restaurants that use menus, but only calorie information for fast-food restaurants with menu boards.) The daily value information disclosure is (1) daily value recommendations for fat (65 g), saturated fat (20 g), and sodium (2400 mg) based on a 2000-calorie diet, and (2) a control condition without daily values.15,16 The nutrition information presented was based on laboratory tests of actual restaurant items. The provision of daily value information had no influence on the dependent measures and is therefore excluded from further discussion.
Four of the items included on the menu were deluxe hamburger with fries, chef’s salad, chicken breast with baked potato, and turkey sandwich. As shown in Table 1 ▶, for the first 2 items, objective levels of calories, fat, and saturated fat exceeded consumers’ expectations. For the latter 2, consumers’ expectations were more consistent with objective levels. All information and manipulations were presented on a 4-color mock restaurant menu stimulus. Respondents were instructed to answer questions regarding the menu items; nutrition was not mentioned.
Measures
For each menu item, overall attitude toward the product and purchase intention were assessed using multi-item 7-point scales (all coefficient α’s greater than 0.90). To assess consumers’ risk perceptions (likelihood of weight gain and heart disease perceptions), 9-point, single-item measures drawn from previous research were employed.14,17 (Specific items used for measures are available as a data supplement to the online article.) Items were recoded so that higher values indicated more-favorable attitudes and higher perceived risk. A single measure of choice among the 4 items was used (“If you had to choose one of the products described on the mock menu, which one product would you select?”).
RESULTS
To test predictions, a doubly multivariate analysis was performed with SPSS 11.5 general linear models (SPSS Inc, Chicago, Ill). Dependent variable means are shown in Table 2 ▶ and multivariate and univariate results are shown in Table 3 ▶. There are main effects of nutrition information provision and menu item type for the dependent variables as hypothesized and a multivariate interaction between information provision and menu item (P<.01). Univariate interactions are significant for each of the 4 dependent variables. Plots of means relevant to interactions are shown in Figure 1 ▶. For the items inconsistent with nutrition expectations (hamburger and chef’s salad), purchase intention means followed the predicted pattern. For the hamburger platter, follow-up contrasts showed that relative to the control (M=4.44), there were significant decreases in purchase intentions for both the calories-plus-nutrients (M=3.43; t=−2.93; P<.01) and calories-only (M=3.80; t=−1.89; P<.05; 1-tailed test) conditions. The difference between the calorie-only and calorie-plus-nutrients conditions was not significant.
TABLE 2—
Means (SD) for Purchase Intentions and Product Evaluation–Dependent Variables for Nutrition Information–Provision Conditions
| Items Less Consistent With Nutrition Expectations | Items More Consistent With Nutrition Expectations | |||
| Dependent Measures for Nutrition Information–Provision Conditions | Chef’s Salad | Hamburger and French Fries | Grilled Chicken Breast and Baked Potato | Turkey Sandwich |
| Product attitude | ||||
| No nutrition information | 5.37 (1.8) | 4.46 (1.8) | 5.66 (1.4) | 5.25 (1.6) |
| Calories only | 5.18 (1.6) | 4.16 (1.9) | 5.80 (1.3) | 6.02 (1.4) |
| Calories and nutrients | 4.38 (1.9) | 3.72 (2.0) | 5.52 (1.5) | 5.64 (1.5) |
| Purchase intentions | ||||
| No nutrition information | 4.92 (1.7) | 4.44 (2.1) | 5.59 (1.6) | 4.86 (1.9) |
| Calories only | 4.68 (1.7) | 3.80 (2.1) | 5.58 (1.6) | 5.86 (1.5) |
| Calories and nutrients | 3.97 (2.0) | 3.43 (2.1) | 5.55 (1.7) | 5.48 (1.7) |
| Perceived likelihood of weight gain | ||||
| No nutrition information | 3.89 (2.0) | 7.24 (1.9) | 4.32 (1.9) | 3.75 (2.0) |
| Calories only | 4.71 (2.3) | 7.80 (1.8) | 4.43 (1.8) | 2.97 (1.7) |
| Calories and nutrients | 5.42 (2.3) | 7.53 (1.8) | 4.80 (1.7) | 3.72 (1.8) |
| Perceived likelihood of heart disease | ||||
| No nutrition information | 4.05 (1.8) | 7.17 (1.6) | 3.97 (1.7) | 3.92 (1.9) |
| Calories only | 4.59 (2.1) | 7.62 (1.6) | 3.86 (1.8) | 3.10 (2.0) |
| Calories and nutrients | 5.42 (2.1) | 7.41 (1.5) | 4.23 (1.6) | 3.70 (1.9) |
TABLE 3—
Effects on Purchase Intention and Product Evaluation–Dependent Variables
| MANOVA Results | Univariate F Values | |||||
| Wilks λ | F | Product Attitude | Purchase Likelihood | Weight Gain Perceptions | Heart Disease Perceptions | |
| Nutrition information | 0.93 | 1.9 | 4.2* | 2.9 | 4.2* | 3.5* |
| Daily value information | 0.98 | 1.2 | 2.9 | 0.9 | 0.0 | 0.7 |
| Item type | 0.40 | 60.0** | 56.6** | 47.9** | 218.4** | 231.8** |
| Nutrition information × Item type | 0.91 | 2.5** | 4.0** | 5.2** | 4.8** | 4.6** |
| Nutrition information × Daily value information | 0.94 | 1.8 | 2.2 | 1.4 | 0.4 | 0.1 |
| Daily value information × Item type | 0.98 | 1.1 | 1.4 | 2.4 | 0.3 | 1.2 |
| Nutrition information × Item type × Daily value information | 0.97 | 0.9 | 2.0 | 1.1 | 0.9 | 0.9 |
Note: MANOVA = multivariate analysis of variance.
*P < .05; **P < .01.
FIGURE 1—
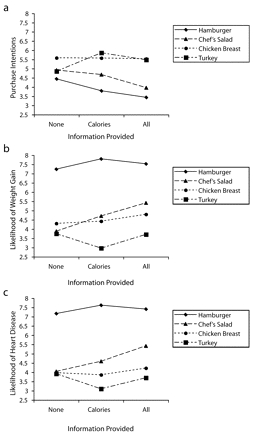
Interaction between nutrition information provided and menu food item for purchase intentions (a), weight gain (b), and heart disease (c).
Note. For the hamburger platter and chef’s salad, consumers’ calorie and nutrient expectations (assessed in study 1) generally were less consistent with objective levels than were the chicken breast dinner and turkey sandwich items.
For the chef’s salad, contrasts show that compared with the no-information control condition (M=4.92), there was not a significant decrease in purchase intentions from the addition of calorie information (M=4.68). However, purchase intentions for the calories-plus-nutrient information condition (M=3.97) were significantly lower than both the control (t= −3.18; P<.01) and the calorie-only (t=−2.41; P<.02) conditions. This pattern is consistent with the nutritional composition of the chef’s salad; it contains a moderate number of calories, but substantially exceeds the levels of fat and saturated fat expected by consumers. Thus, hypotheses 3a and 3b were supported.
With the provision of nutrition information, purchase intentions for the expectation-consistent items showed no effect in 1 case and a positive effect in the other case. Specifically, the purchase intentions means were flat for the chicken dinner (ranging between 5.55 and 5.59). For the turkey sandwich, relative to the control (M = 4.86), the addition of calorie information (M = 5.86; t = 3.68; P < .01) and calorie-plus-nutrient information (M = 5.48; t = 2.22; P < .05) resulted in stronger purchase intentions.
Plots for the perceived likelihood of gaining weight and developing heart disease are shown in Figure 1b and 1c ▶. For both variables, univariate analyses of variance were significant for the chef’s salad (P < .01) and turkey sandwich (P < .05), but not significant for the hamburger platter or chicken dinner (P > .15). For the chef’s salad, the calories-plus-nutrients condition led to higher perceived likelihoods of heart disease and weight gain, relative to the calories-only condition (t = 2.52 and 1.87, respectively; P < .05). For the turkey sandwich, calories alone decreased both perceived likelihoods (P < .05), but the full information did not differ relative to the control. (Presumably, the higher sodium levels revealed in the full-information condition counterbalanced the positive effects of a lower-than-anticipated calorie level.) The pattern of means is particularly interesting for heart disease. With no information, the means for all items except the hamburger platter were almost identical but the calorie and nutrient information widened perceived differences among these items, and the chef’s salad mean increased significantly (P < .01). These findings also supported Hypotheses 3a and 3b.
Consumers’ item choices were examined across the 3 levels of nutrition information. Results were significant (χ2 = 15.6; df = 6; P < .02). When calorie-plus-nutrient information was presented, the percentage of consumers choosing the turkey sandwich (which generally met or exceeded nutrition expectations) increased from 11% to 21%, and it decreased selection of items with higher levels of calories and fat than expected. The share of the chicken dinner (i.e., nutrient levels consistent with expectations) remained constant. In tests comparing the 2 items with higher calories and fat (i.e., items less consistent with expectations) to the 2 more-healthful items, selection of the higher-calorie, higher-fat items decreased from 37% to 24% (P < .05) when calorie and nutrition information were provided. These findings supported hypothesis 4.
DISCUSSION
As a response to the increased prevalence of overweight and obesity, which has been linked with the greater consumption of foods prepared outside the home,18 legislation has been proposed at both federal and state levels that would require the provision of nutrition information for restaurant food items. Study 1 results showed that, for a number of items, consumers vastly underestimated calories, fat, saturated fat, and sodium levels. On average, less-healthful items were underestimated by more than 600 calories and between one third to a full day’s worth of the recommended values for fat and saturated fat. If diners consumed 600 more calories than they realized for just 1 restaurant meal per week, an extra 30 000 calories a year would be added to their diets. These unaccounted calories could cause a weight gain of approximately 9 pounds annually, holding all other factors constant. Over several years’ time, this degree of misestimation could cause significant weight gain. Given substantial differences between expected and objective values, these findings indicate that inclusion of nutrition information on menus offers informational benefits to consumers.
Study 2 findings showed that the addition of calorie and nutrient information for dinner house items influenced attitudes, intentions, and choices. Purchase intention and choice decreased for less-healthful items that were worse than expected (hamburger platter and chef’s salad), whereas they remained constant or increased slightly for items more consistent with expectations. The largest changes occurred for the chef’s salad, which had the largest deviations from consumer expectations. In the absence of nutrition information, the turkey, chicken, and chef’s salad items were indistinguishable in terms of the perceived likelihood of heart disease. However, when calorie and nutrient information were provided, there was a larger difference in disease-risk perceptions.
Our findings have significant public health implications and provide support to the notion that new restaurant-oriented nutrition information initiatives may be warranted. However, circumstances unique to the restaurant industry, such as customized orders and portion size differences, will make provision of exact nutrition information for every single meal and every consumer difficult. Legislation would probably need to apply to items “as offered for sale,” and nutrition disclosure would not include customized orders or daily specials.
Because our results showed that consumers substantially underestimated calorie levels for less-healthful dinner house items and that preference for the less-healthful items diminished when nutrition information was disclosed, provision of nutrition information for chain restaurants’ standard menu items would appear helpful. We also recognize that further research may identify additional nutrition formats that may be equally or more effective at conveying nutrition information, and that combining possible social marketing initiatives with future nutrition disclosure research seems warranted. In sum, these findings suggest that the provision of easily accessible nutrition information in restaurants may provide significant public health benefits by making it easier for consumers to make more healthful food choices.
Peer Reviewed
Contributors S. Burton and E. H. Creyer originated the design of the studies and formulated the hypotheses. S. Burton wrote the first draft of the article and performed initial analyses. J. Kees and K. Huggins worked on data analyses and data collection. All authors participated in critical review and revision of the article based on reviewers’ recommendations.
Human Participant Protection This study was approved by the institutional review board of the University of Arkansas. Informed consent was obtained from study participants.
References
- 1.Bassett MT, Perl S. Obesity: the public health challenge of our time. Am J Public Health. 2004;94: 1477. [DOI] [PMC free article] [PubMed] [Google Scholar]
- 2.Centers for Disease Control and Prevention. Overweight and Obesity: Obesity Trends. Available at: http://www.cdc.gov/nccdphp/dnpa/obesity/trend/index.htm. Accessed March 14, 2005.
- 3.Flegal KM, Williamson DF, Pamuk ER, Rosenberg HM. Estimating deaths attributable to obesity in the United States. Am J Public Health. 2004;94: 1486–1489. [DOI] [PMC free article] [PubMed] [Google Scholar]
- 4.The Surgeon General’s Call to Action to Prevent and Decrease Overweight and Obesity. Rockville, Md: Office of the Surgeon General; 2001. Available at: http://www.surgeongeneral.gov/topics/obesity/. Accessed August 30, 2004. [PubMed]
- 5.Flegal KM, Graubard BI, Williamson DF. Methods of calculating deaths attributable to obesity. Am J Epidemiol. 2004;160:331–338. [DOI] [PubMed] [Google Scholar]
- 6.Gerberding JL, Marks JS. Making America fit and trim—steps big and small. Am J Public Health. 2004;94: 1478–1479. [DOI] [PMC free article] [PubMed] [Google Scholar]
- 7.National Restaurant Association. Frequently Asked Questions, 2005. Available at: http://www.restaurant.org/aboutus/faqs.cfm. Accessed March 14, 2005.
- 8.Connolly C. Public policy targeting obesity. Washington Post. August 6, 2003;A1.
- 9.Mathews AW, Leung S. FDA considers nutrition labels in restaurants. Wall Street Journal. October 23, 2003;B1.
- 10.Backstrand J, Wootan MG, Young LR, Hurley J. Fat Chance. Washington, DC: Center for Science in the Public Interest; 1997.
- 11.Jacobson MF, Hurley J. Restaurant Confidential. New York, NY: Workman Publishing; 2002.
- 12.van Raaij WF. The formation and use of expectations in consumer decision making. In: Robertson TS, Kassarjian HH, eds. Handbook of Consumer Behavior. Englewood Cliffs, NJ: Prentice Hall; 1991:401–418.
- 13.Tolman EC. Purposive Behavior in Animals and Men. New York, NY: Appleton-Century-Cross; 1932.
- 14.Teisl M, Levy AS, Derby B. The effects of education and information source on consumer awareness of diet-disease relationships. J Public Policy Marketing. 1999;18:197–207. [Google Scholar]
- 15.Levy AS, Fein SB, Schucker RE. Performance characteristics of seven nutrition label formats. J Public Policy Marketing. 1996;15:1–15. [Google Scholar]
- 16.Food labeling regulations implementing the Nutritional Labeling and Education Act of 1990. Federal Register. 1993;58(3):2066–2190. [Google Scholar]
- 17.Kozup JC, Creyer EH, Burton S. Making healthful food choices: The influence of health claims and nutrition information on consumers’ evaluations of packaged food products and restaurant menu items. J Marketing. 2003;67:19–34. [Google Scholar]
- 18.Lin BH, Frazão E, Guthrie J. Away-From-Home Foods Increasingly Important to Quality of American Diet. Economic Research Service, US Dept of Agriculture; 1999. Agriculture Information Bulletin No. 749.