

Abstract
Background
Controversy remains regarding the relationship between ambient ozone and mortality worldwide. In mainland China, the largest developing country, there has been no prior study investigating the acute effect of O3 on death risk. Given the changes in types of air pollution from conventional coal combustion to the mixed coal combustion/motor vehicle emissions in China’s large cities, it is worthwhile to investigate the acute effect of O3 on mortality outcomes in the country.
Objectives
We conducted a time-series study to investigate the relation between O3 and daily mortality in Shanghai using 4 years of daily data (2001–2004).
Methods
We used the generalized additive model with penalized splines to analyze mortality, O3 pollution, and covariate data in warm and cold seasons. We considered daily counts of all-cause mortality and several cause-specific subcategories (respiratory and cardiovascular). We also examined these associations among several subpopulations based on age and sex.
Results
O3 was significantly associated with total and cardiovascular mortality in the cold season but not in the warm season. In the whole-year analysis, an increase of 10 μg/m3 of 2-day average (lag01) O3 corresponds to 0.45% [95% confidence interval (CI), 0.16–0.73%], 0.53% (95% CI, 0.10–0.96%), and 0.35% (95% CI, −0.40 to 1.09%) increase of total nonaccidental, cardiovascular, and respiratory mortality, respectively. In the cold season, the estimates increased to 1.38% (95% CI, 0.68–2.07%), 1.53% (95% CI, 0.54–2.52%), and 0.95% (95% CI, −0.71 to 2.60%), respectively. In the warm season, we did not observe significant associations for both total and cause-specific mortality. The results were generally insensitive to model specifications such as lag structure of O3 concentrations and degree of freedom for time trend. Multipollutant models indicate that the effect of O3 was not confounded by particulate matter ≤ 10 μm in diameter (PM10) or by sulfur dioxide; however, after adding nitrogen dioxide into the model, the association of O3 with total and cardiovascular mortality became statistically insignificant.
Conclusions
O3 pollution has stronger health effects in the cold than in the warm season in Shanghai. Our analyses also strengthen the rationale for further limiting levels of O3 pollution in outdoor air in the city.
Keywords: air pollution, mortality, ozone, time-series studies
Short-term exposure to outdoor air pollution has been linked to adverse health effects, including increased mortality, increased rates of hospital admissions and emergency department visits, exacerbation of chronic respiratory conditions (e.g., asthma), and decreased lung function (American Thoracic Society 1996; Dockery and Pope 1994). Most of these studies were conducted in the developed countries, and only a small number of studies have been conducted in Asia (Health Effects Institute 2004). In mainland China, the largest developing country, the relation between outdoor air pollution and daily mortality has been investigated in several large cities, including Beijing (Xu et al. 1994), Shenyang (Xu et al. 2000), Chongqin (Venners et al. 2003), and Shanghai (Kan and Chen 2003a, 2003b). These studies basically followed the commonly used time-series and case-crossover approaches, and their results were in accordance with those reported from Western Europe and the United States, where most epidemiologic studies were conducted.
However, there are still some key scientific issues to be addressed regarding the health effects of outdoor air pollution in China. For example, although ozone is recognized as an air pollutant that could increase death risk (Bates 2005; Bell et al. 2004, 2005; Gryparis et al. 2004; Ito et al. 2005; Levy et al. 2005; Schwartz 2005), no study has been conducted in mainland China to assess the acute effect of O3. Moreover, the previous findings of the effects of O3 on death risk have been inconsistent (Anderson et al. 2001; Borja-Aburto et al. 1997; Goldberg et al. 2001; Hoek et al. 1997; Hong et al. 1999, 2002; Ito and Thurston 1996; Loomis et al. 1999; Prescott et al. 1998); therefore, in recent regulatory impact analyses of air pollution control measures [U.S. Environmental Protection Agency (EPA) 1999a, 1999b, 2003], the U.S. EPA excluded the O3–mortality relationship from primary benefits estimates, stating that the epidemiologic literature was too uncertain to infer causality and provide reasonable quantitative estimates. Also, much is unknown about the synergistic effects of O3 and the complex mix of pollutants found in the ambient air.
China has one of the world’s worst levels of ambient air pollution. Coal has been the major source of energy in the country, constituting about 75% of all energy sources. Consequently, air pollution in China predominantly consists of coal smoke, with suspended particulate matter (PM) and sulfur dioxide as the principal air pollutants. However, with the rapid increase in the number of motor vehicles in recent years, air pollution in China’s large cities has gradually changed from the conventional coal combustion type to mixed coal combustion/motor vehicle emissions (Chen et al. 2004). Given the relatively high levels of copollutants (PM, SO2, and nitrogen dioxide) and change of air pollution type in China’s cities, it is worthwhile to investigate the independent effect of O3 on mortality outcomes in the country. Moreover, in setting air pollution control policy from a public health viewpoint, it is important to identify the health effects of air pollution from local data.
In the present study, we conducted a time-series analysis to evaluate the association between mortality outcomes (both total and cause specific) and O3 exposure in metropolitan Shanghai using 4 years of daily data (2001–2004).
Materials and Methods
Data
Daily mortality data (excluding accidents and injuries) of residents living in the nine urban districts of Shanghai from 1 January 2001 to 31 December 2004 were collected from the database of the Shanghai Municipal Center of Disease Control and Prevention. The causes of death for 2001 and 2002–2004 were coded according to the International Classification of Diseases, Ninth Revision [ICD-9; World Health Organization (WHO) 1977] and Tenth Revision [ICD-10 (WHO 1994)], respectively. The mortality data were classified into deaths from all causes (ICD-9 codes < 800; ICD-10 codes A00–R99), cardiovascular diseases (ICD-9 codes 390–459; ICD-10 codes I00–I99) (including subcategories such as stroke and heart diseases), and respiratory diseases (ICD-9 codes 460–519; ICD-10 codes J00–J98) [including subcategories such as chronic obstructive pulmonary disease (COPD) and acute respiratory infection]. The data were also classified by sex and age (0–4, 5–44, 45–64, ≥ 65 years) for all-cause deaths.
Daily air pollution data in 2001–2004, including O3, PM ≤ 10 μm in diameter (PM10), SO2, and NO2, were collected by the Shanghai Environmental Monitoring Center. The daily concentrations for each pollutant were averaged from the available monitoring results of six fixed-site stations under China National Quality Control located in the urban areas of Shanghai. We collected the 24-hr average concentrations for PM10, SO2, and NO2 and 8-hr (1000 hr to 1800 hr) average concentration for O3. We used the 8-hr average because it is the average time recommended by the World Health Organization (WHO) for reflecting the most health-relevant exposure to O3 (WHO 2000). Calculation of 24-hr average concentration of PM10, SO2, and NO2 required having at least 75% of the 1-hr values on that particular day. For the 8-hr average of O3, at least six hourly values from 1000 hr to 1800 hr had to be available. If a station had > 25% of the values missing for the whole period of analysis, the entire station was excluded from the analysis.
To allow adjustment for the effect of weather on mortality, daily (minimal, maximal, and average) temperature and humidity data were collected by the Shanghai Meteorological Bureau. The weather data were measured at a fix-site station located in Xuhui District of Shanghai.
All the mortality, pollutant, and meteorological data were validated by an independent auditing team assigned by the Health Effects Institute.
Statistical methods
We used the generalized additive model (GAM) with penalized splines to analyze the mortality, O3 pollution, and covariate data from 2001 to 2004 in Shanghai. Because counts of daily mortality data typically follow a Poisson distribution, the core analysis was a GAM with log link and Poisson error that accounted for smooth fluctuations in daily mortality.
We first built the basic models for various mortality outcomes that did not include the air pollution variables. We incorporated smoothed spline functions of time and weather conditions, which can accommodate nonlinear and nonmonotonic patterns between mortality and time/weather conditions, offering a flexible modeling tool (Hastie and Tibshirani 1990). According to previous literature (Bell et al. 2004; Samet et al. 2000a, 2000b), 6 or 8 degrees of freedom (df) per year of data for time trend and 3 or 4 df (whole period of study) for temperature and relative humidity were tested. This number of degrees of freedom has been found to control well for seasonal patterns in mortality and to reduce, and often eliminate, autocorrelation. If there was over-dispersion in the variance, we used the partial autocorrelation function (PACF) to guide the selection of degrees of freedom until PACF of the residuals was < 0.1 for the first 2 lag days (independent of the associated p-values). In this way, we determined the optimal degree-of-freedom values per year for various causes of death in Shanghai. Other covariates, such as day of the week (DOW), were also included in the basic models. Residuals of each model were examined to check whether there were discernible patterns and autocorrelation by means of residual plots and PACF plots, respectively.
After the establishment of basic models, we introduced the pollutant variables into the models and analyzed their effects on mortality outcomes. Generalized cross-validation scores were used to compare the relative quality of the mortality predictions across these non-nested models and how well the models fit the data (Golub et al. 1979; Hastie and Tibshirani 1990).
Briefly, we fit the following log-linear GAM to obtain the estimated pollution log-relative rate β in Shanghai:
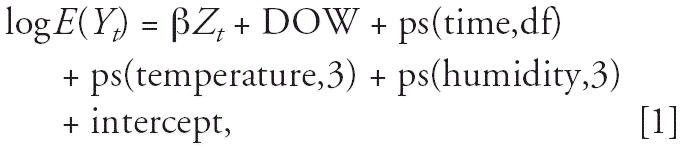 |
where E(Yt) is the expected number of deaths at day t; β represents the log-relative rate of mortality associated with a unit increase of air pollutants (O3 and copollutants); Zt indicates the pollutant concentrations at day t; DOW is day of the week effect; ps(time,df) is the penalized spline function of calendar time; and ps(temperature/humidity,3) is the penalized spline function for temperature/humidity with 3 df.
In a previous study, Bell et al. (2004) reported that single-day lag models under-estimate the cumulative effect of O3 on mortality because they take into account only 1 day’s O3 exposure. Therefore, in our primary analysis, we used the moving average of current and previous day concentrations of O3 (lag01). As a sensitivity analysis, we also examined the effect of O3 with different lag structures including both single-day lag and multiday lag [lag01 and the 5-day moving average of O3 concentrations for the previous 4-days (lag04)]. We examined the separate effect of O3 in the warm season (April–September) and the cold season (the remaining months). In addition, given that it is not easy to determine the optimal values of degrees of freedom for time trend in the basic models whether from statistical or biological plausibility perspectives, we did the sensitivity analysis to test the impact of degree of freedom selection on the regression results. We also fitted models with a different combination of pollutants (up to two pollutants per model) to assess the stability of O3’s effect.
All analyses were conducted using R 2.1.1 using the MGCV package (R Development Core Team 2006). The results are presented as the percent change in daily mortality per 10μg/m3 increase of O3, which is simply the β-coefficient from the Poisson regression × 1,000.
Results
From 2001 to 2004, a total of 173,911 deaths (91,314 males and 82,597 females) were recorded in the study population. The four different age groups (0–4, 5–44, 45–64, and ≥ 65 years) accounted for 0.3, 3.2, 13.0, and 83.5% of the total number of deaths, respectively. On average, there were 119.0 deaths/day, among which 44.2 persons died from cardiovascular diseases and 14.3 died from respiratory diseases (Table 1). Cardiopulmonary disease accounted for 49.1% of the total nonaccidental deaths for the urban residents in Shanghai.
Table 1.
Summary statistics of daily deaths, air pollutant concentrations, and weather conditions in Shanghai (2001–2004).
| Variable | Mean ± SD | Minimum | 25th percentile | Median | 75th percentile | Maximum |
|---|---|---|---|---|---|---|
| Daily death counts | ||||||
| Total (nonaccident) | 119.0 ± 22.5 | 51.0 | 103.0 | 115.0 | 133.0 | 198.0 |
| Cardiovascular | 44.2 ± 11.0 | 11.0 | 36.0 | 43.0 | 51.0 | 85.0 |
| Respiratory | 14.3 ± 6.4 | 3.0 | 10.0 | 13.0 | 17.0 | 45.0 |
| Air pollutant concentrationsa | ||||||
| O3 (μg/m3) | 63.3 ± 36.7 | 5.3 | 37.6 | 56.1 | 82.7 | 251.3 |
| PM10 (μg/m3) | 102.0 ± 64.8 | 14.0 | 56.3 | 84.0 | 128.3 | 566.8 |
| SO2 (μg/m3) | 44.7 ± 24.2 | 8.4 | 27.5 | 40.0 | 56.2 | 183.3 |
| NO2 (μg/m3) | 66.6 ± 24.9 | 13.6 | 50.2 | 62.5 | 79.2 | 253.7 |
| Meterologic measures | ||||||
| Mean temperature (°C) | 17.7 ± 8.5 | −2.4 | 10.3 | 18.3 | 24.7 | 34.0 |
| Relative humidlity (%) | 72.9 ± 11.4 | 33.3 | 65.5 | 73.5 | 81.0 | 97.0 |
Twenty-four-hour average for PM10, SO2, and NO2; 8-hr (1000 hr to 1800 hr) average for O3.
In our research period, the minimal, mean, and maximal daily 8-hr average concentrations of O3 were 5.3, 63.3, and 251.3 μg/m3, respectively (Table 1). For the cold and warm seasons, the mean 8-hr average O3 concentrations were 48.3 and 78.4 μg/m3, respectively.
The 8-hr average concentrations of O3 were weakly correlated with daily concentrations of PM10, SO2, and NO2 and moderately correlated with mean temperature level (Table 2). PM10, SO2, and NO2 had relatively higher correlation coefficients with each other.
Table 2.
Correlation coefficients between daily air pollutant concentrations and weather conditions in metropolitan Shanghai (2001–2004).a
| SO2 | NO2 | O3 | Temperature | Relative humidity | |
|---|---|---|---|---|---|
| PM10 | 0.64 | 0.71 | 0.19 | −0.21 | −0.37 |
| SO2 | 1.00 | 0.73 | 0.14 | −0.21 | −0.52 |
| NO2 | 1.00 | 0.01 | −0.38 | −0.27 | |
| O3 | 1.00 | 0.48 | −0.35 | ||
| Temperature | 1.00 | 0.21 |
Twenty-four-hour average for PM10, SO2, and NO2; 8-hr (1000 hr to 1800 hr) average for O3.
Table 3 summarizes the effect of O3 on daily mortality stratified by cause of death and season in the single-pollutant models. O3 was significantly associated with total and cardiovascular mortality in the cold season but not in the warm season. In the whole-year analysis, an increase of 10 μg/m3 of 2-day average (lag01) O3 corresponds to 0.45% [95% confidence interval (CI), 0.16–0.73%], 0.53% (95% CI, 0.10–0.96%), and 0.35% (95% CI, −0.40to 1.09%) increase of total, cardiovascular, and respiratory mortality, respectively. In the cold season, the estimates increased to 1.38% (95% CI, 0.68–2.07%), 1.53% (95% CI, 0.54–2.52%), and 0.95% (95% CI, −0.71 to 2.60%), respectively. In the warm season, we did not observe significant associations for both total and cause-specific mortality.
Table 3.
Percent increase (95% CI) of mortality outcomes of Shanghai residents associated with a 10-μg/m3 increase in O3 concentrations in 2001–2004.a
| Cause of death | Daily deaths (n) | Full year | Cold season | Warm season |
|---|---|---|---|---|
| All causes | ||||
| Total (nonaccident) | 119.0 | 0.45 (0.16 to 0.73) | 1.38 (0.68 to 2.07) | 0.30 (−0.01 to 0.61) |
| Total, male | 62.5 | 0.37 (0.01 to 0.73) | 1.02 (0.17 to 1.87) | 0.25 (−0.17 to 0.66) |
| Total, female | 56.5 | 0.53 (0.15 to 0.90) | 1.78 (0.87 to 2.68) | 0.37 (−0.04 to 0.77) |
| Total (0–4 years) | 0.3 | −3.88 (−8.64 to 0.88) | −6.09 (−17.14 to 4.97) | −4.33 (−10.16 to 1.50) |
| Total (5–44 years) | 3.7 | −0.13 (−1.48 to 1.22) | 0.59 (−2.73 to 3.91) | 0.19 (−1.35 to 1.72) |
| Total (45–64 years) | 15.5 | 0.56 (−0.11 to 1.23) | 1.65 (0.03 to 3.27) | 0.23 (−0.55 to 1.01) |
| Total (≥ 65 years) | 99.6 | 0.46 (0.16 to 0.77) | 1.38 (0.65 to 2.11) | 0.33 (0.00 to 0.66) |
| Cardiovascular disease | 44.2 | 0.53 (0.10 to 0.96) | 1.53 (0.54 to 2.52) | 0.37 (−0.12 to 0.85) |
| Stroke | 25.5 | 0.79 (0.23 to 1.35) | 1.74 (0.49 to 2.98) | 0.57 (−0.09 to 1.22) |
| Heart disease | 16.8 | 0.24 (−0.43 to 0.92) | 1.16 (−0.33 to 2.66) | 0.14 (−0.66 to 0.94) |
| Respiratory disease | 14.3 | 0.35 (−0.40 to 1.09) | 0.95 (−0.71 to 2.60) | 0.14 (−0.71 to 0.99) |
| COPD | 12.2 | 0.22 (−0.60 to 1.03) | 0.75 (−1.05 to 2.54) | 0.07 (−0.86 to 1.00) |
| Acute respiratory infection | 1.0 | 1.99 (−0.55 to 4.52) | 0.73 (−5.08 to 6.53) | 1.93 (−1.13 to 4.99) |
Current day temperature and relative humidity (lag = 0), and 2-day moving average of O3 concentrations (lag01) were used in all the regression models shown in this table.
For total nonaccident mortality, the estimated effect varied with sex and age groups (Table 3). The observed effect of O3 was larger in females than in males. For people < 65 years of age, the effects were not statistically significant, whereas for older urban residents (≥ 65 years of age), the level of O3 concentrations was positively associated with mortality risk.
For total and cardiovascular mortality, the exposure–response relationships associated with O3 exposure were essentially linear at concentrations < 75 μg/m3, although the risks were not monotonically increasing (Figure 1). The curves tended to become nonlinear and flat at higher concentrations. We did not observe any obvious threshold concentration below which O3 has no effect on total and cardiovascular deaths. For respiratory mortality, no clear relationship was observed.
Figure 1.
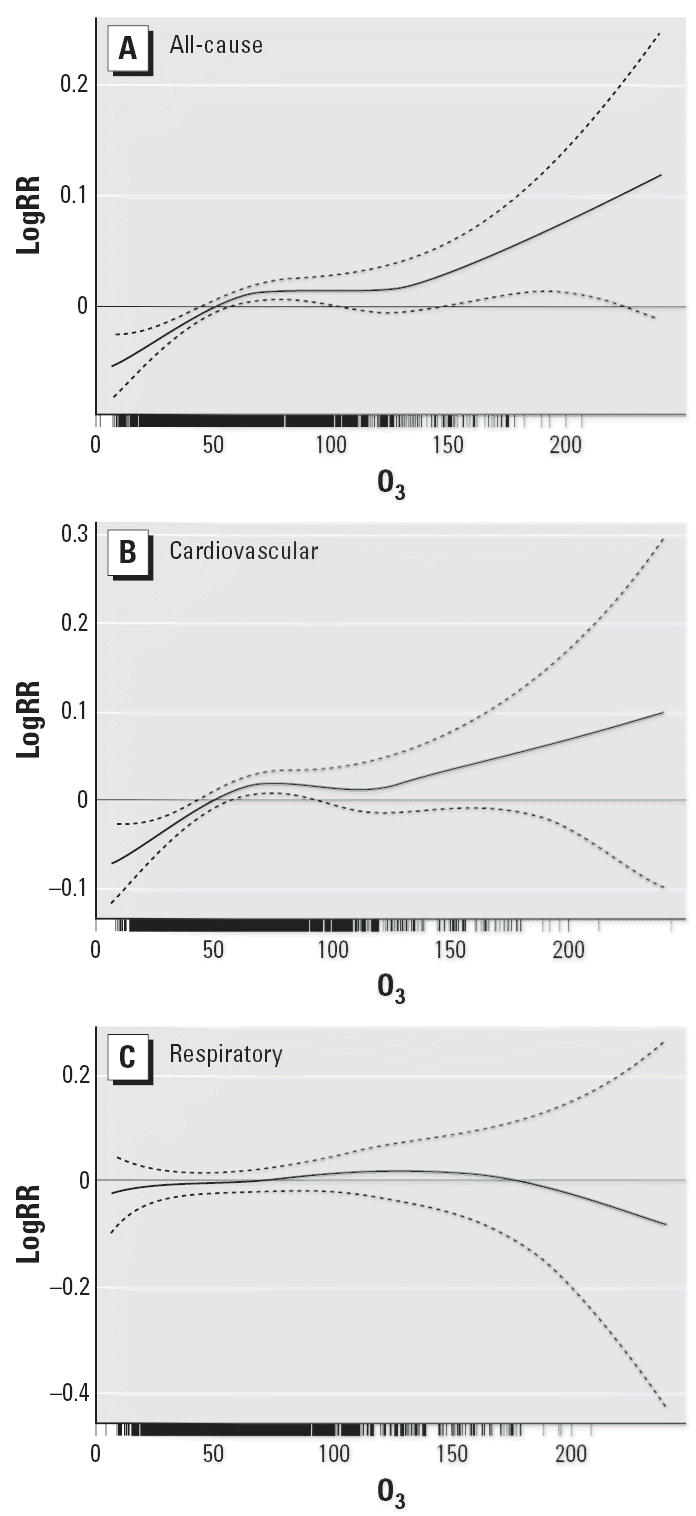
Smoothing plots of O3 concentration (μg/m3) against mortality risk (logRR, log relative risk; df = 4). (A) All-cause mortality. (B) Cardiovascular mortality. (C) Respiratory mortality. The solid line indicates the estimated mean percentage of change in daily mortality, and the dotted lines represent twice the pointwise SE.
In our analysis, the effects of O3 on total and cardiovascular mortality are statistically significant for most lagged days that we examined (Figure 2). For single-day lags, O3 shows similar patterns for its effects on the mortality outcomes in that the risks increased from lag day 0, were maximal at lag days 1–2, and then declined. Multiday exposures (lag01 and lag04) usually have larger effects than single-day exposure. The effect of O3 on respiratory mortality was only significant for single-day lag 2.
Figure 2.
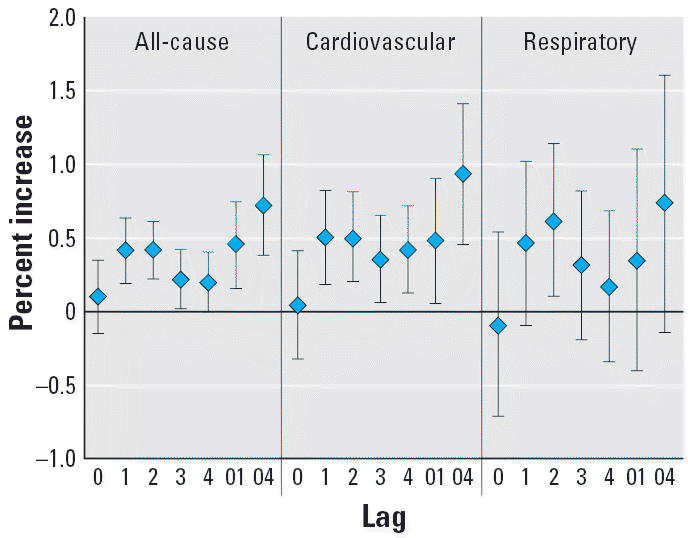
Percent increase of deaths with 10 μg/m3 increase of O3 due to all, cardiovascular, and respiratory causes in different lag days.
Within the range of 5–15 df, the change of degrees of freedom per year for time trend does not much affect the regression results (Figure 3), suggesting that our findings with regard to the effect of O3 on mortality outcomes are relatively robust.
Figure 3.
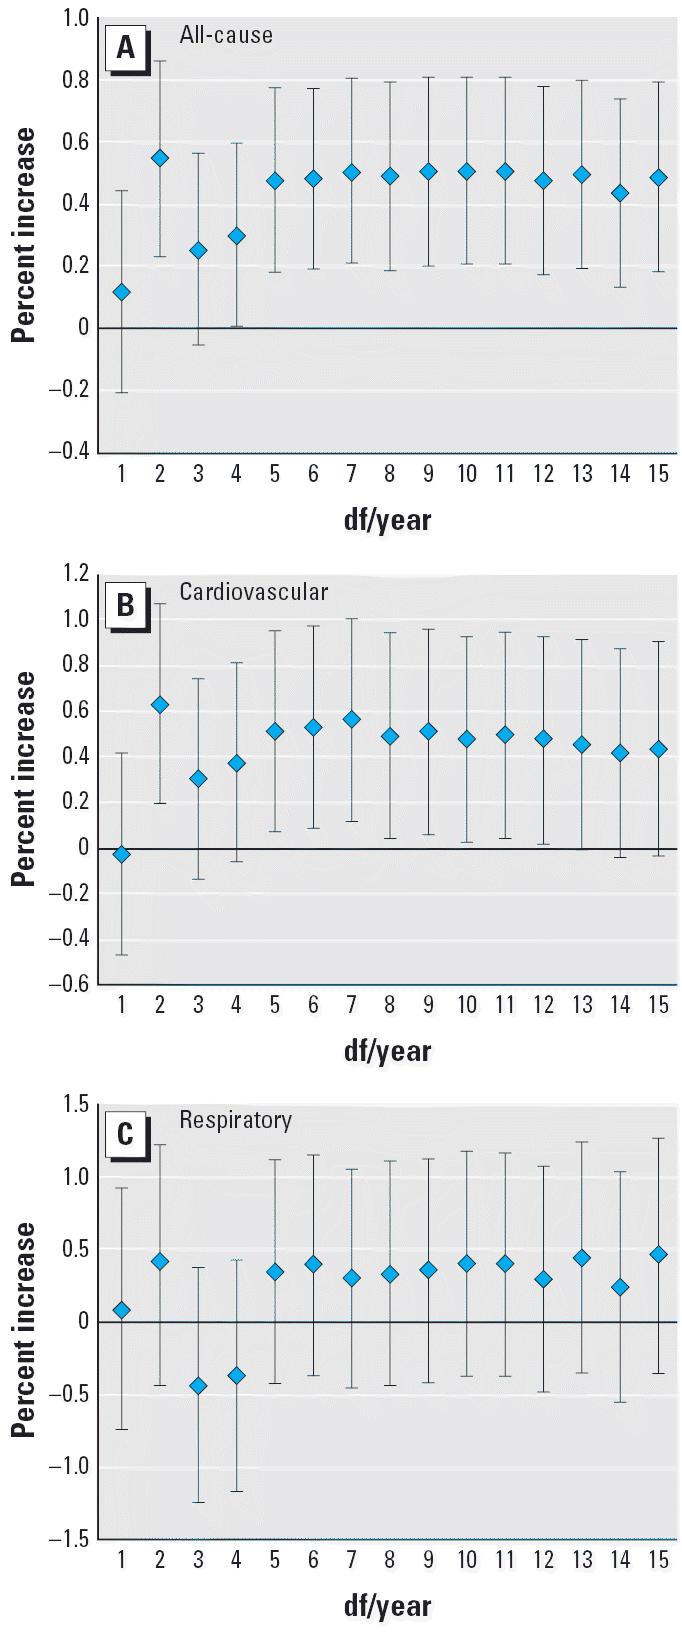
Percent increase of deaths with 10 μg/m3 increase of O3 due to all, cardiovascular, and respiratory causes classified by degrees of freedom per year. (A) All-cause mortality. (B) Cardiovascular mortality. (C) Respiratory mortality.
Table 4 compares the results of the single-pollutant models and two-pollutant models. The estimated effects of O3 on total and cardiovascular mortality were still significant after adjustment for PM10 and SO2; however, NO2 was added into the regression models, the effect of O3 became statistically insignificant. We did not observe significant effects of O3 on respiratory mortality in single-pollutant or two-pollutant models.
Table 4.
Percent increase of total, cardiovascular, and respiratory mortality associated with a 10-μg/m3 increase of 2-day average O3 concentrations under single- and two-pollutant models.a
| Cause of death | Mean percent (95% CI) |
|---|---|
| Total mortality | |
| Single-pollutant model | 0.45 (0.16 to 0.73) |
| Adjusted for PM10 | 0.35 (0.06 to 0.64) |
| Adjusted for SO2 | 0.34 (0.05 to 0.63) |
| Adjusted for NO2 | 0.26 (−0.03 to 0.55) |
| Cardiovascular mortality | |
| Single-pollutant model | 0.53 (0.10 to 0.96) |
| Adjusted for PM10 | 0.44 (0.00 to 0.88) |
| Adjusted for SO2 | 0.44 (0.00 to 0.87) |
| Adjusted for NO2 | 0.35 (−0.09 to 0.79) |
| Respiratory mortality | |
| Single-pollutant model | 0.35 (−0.40 to 1.09) |
| Adjusted for PM10 | 0.24 (−0.51 to 1.00) |
| Adjusted for SO2 | 0.18 (−0.57 to 0.92) |
| Adjusted for NO2 | 0.07 (−0.69 to 0.82) |
Current day temperature and relative humidity (lag 0), 2-day moving average of O3 and copollutants (PM10, SO2, and NO2) concentrations (lag01) were used in all the regression models shown.
Discussion
Evidence gained in this study showed that the current level of O3 in Shanghai is associated with the death rates from all causes and from cardiovascular diseases in the cold season. To our knowledge, this is the first study to report the acute effect of O3 exposure on daily mortality in mainland China. Our results should contribute to the understanding of O3-related health effects in China and may help clarify the difference in effects and mechanisms of O3 between Western and Eastern populations.
Our analysis indicates an association between short-term change in O3 and mortality, with an estimated 0.45% increase in total mortality (95% CI, 0.16–0.73%) for a 10-μg/m3 increase in the 8-hr average O3 level at lag01 in the whole-year analysis. To compare this estimate with other studies, all estimates must be based on the same measure of O3 concentration, such as the 8-hr average. Most previous meta-analyses and time-series analyses used 1-hr maximal, 8-hr maximal, or daily (24-hr) average concentrations as O3 exposure metrics (Bell et al. 2004, 2005; Ito et al. 2005; Levy et al. 2005). A recent study of 23 European cities found a 0.34% (95% CI, 0.27–0.50) increase in daily all-cause mortality associated with a 10-μg/m3 increase in the average of the daily 8-hr average of the same and previous days (Gryparis et al. 2004), which is roughly comparable to our estimate. The magnitude of our estimate is also comparable to another study conducted in Hong Kong using 8-hr average O3 concentrations (Wong et al. 2001).
A major finding of the present study was significant effects of O3 on mortality outcomes only in the cold season but not in the warm season. This is consistent with two prior studies in Hong Kong (Wong et al. 1999, 2001) but in contrast to most studies in Western countries (Bell et al. 2004, 2005; Ito et al. 2005; Schwartz 2005). In Shanghai, the O3 level was higher in the warm season than in the cold season (mean level, 78.4 μg/m3 vs. 48.3 μg/m3), and our exposure–response relationship also reveals a flatter slope at higher concentrations (Figure 1). At higher concentrations, the risks of death could be reduced because vulnerable subjects may have died before the concentration had reached the maximum level (Wong et al. 2001). In addition, the exposure pattern may also contribute to our observation. During the warm season, Shanghai residents tend to use air conditioning more frequently because of the relatively higher temperature and humidity, thus reducing the risk of outdoor O3 exposure. Unstable weather conditions (heavy rain and rain storms) in the warm season also prevent the acute exposure–response relationships between O3 and mortality from being readily observable. In contrast, the cool season in Shanghai is drier and less variable, so people are more likely to go outdoors and open the windows. The fact that a consistently significant health effect of O3 was observed only in the cold season in two subtropical Asian cities (Shanghai and Hong Kong) suggests that the interaction of O3 exposure and weather pattern may vary by location and should be further investigated.
For total nonaccident mortality, we found a larger effect of O3 in females than in males. In Shanghai, male residents have a much higher smoking rate than do females (50.6% and 0.6%, respectively) (Xu 2005). A previous study (Künzli et al. 2005) suggested that the air pollution effect may be stronger in nonsmokers than in smokers. Oxidative and inflammatory effects of smoking may dominate to such an extent that the additional exposure to O3 may not further enhance effects along the same pathways. In addition, compared with males, females have slightly greater airway reactivity (Yunginger et al. 1992); therefore, it is possible that dose–response relations may be detected more easily in females than in males.
Our study area—nine urban districts of Shanghai—is densely populated. Within an area of 279 km2, there are around 7 million permanent residents and six China National Quality Control monitoring stations providing the exposure data for this study. In addition, compared with the residents in developed countries, a relatively lower proportion of Shanghai residents have access to or use air conditioning. Thus, the monitored ambient air pollution data might have been more closely associated with average population exposures in Shanghai than in other study locations of developed countries.
The limitations of our exposure assessment should also be noted. As in most previous time-series studies, we used the simply averaged monitoring results across various stations as the proxy of population exposure level to air pollution. That assignment method may raise a number of issues, given that the variance of pollutant measurements can differ from monitoring location to monitoring location and given the difference between ambient monitoring results and personal exposure level to O3. In addition, because O3 is highly reactive in indoor environments (where people spend most of their time) (Zhang and Lioy 1994), ambient O3 concentrations tend to be higher than personal O3 exposures (Avol et al. 1998). These influences challenge the accuracy of our exposure assessment and the following time-series analysis. The resulting measurement error may have substantial implications for interpreting the time-series air pollution studies (Zeger et al. 2000), although a study has suggested that this measurement error would generally tend to bias estimates downward (Samet et al. 2000b). In the future, we hope to develop an algorithm that fits the local characteristics and can be used to estimate the aggregate population exposure level to various pollutants in Shanghai.
In the single-day lag models, the estimated effects of O3 on mortality outcomes reached a maximum at a lag of 1–2 days. Multiday exposure (e.g., lag01 and lag04) models generally produced larger estimates compared with the single-day lag models (Figure 2). These observations are consistent with those of previous air pollution health effects reports (Bell et al. 2004; Braga et al. 2001; Zanobetti et al. 2002). This temporal pattern of effect would be anticipated for O3, which produces acute inflammatory responses in the lung; adaptation of this inflammatory response with several days of repeated exposure has been demonstrated (Folinsbee et al. 1994; Frank et al. 2001). Although the temporal dynamics of the underlying processes linking O3 exposure to increased mortality may differ from those of the inflammatory response, inflammation has been postulated as having a central role in the increased mortality and morbidity associated with O3 (Brook et al. 2004).
In real life, people cannot selectively inhale some air pollutants and not others. Therefore, human health effects may be the result of a complex of inhaled multipollutants, and it is very difficult to separate the effect of individual pollutants. In the present analysis, the concentration of O3 was weakly correlated with other pollutants. This lack of correlation and the stability of the O3 estimate with inclusion of PM10 and SO2 in the multipollutant models provide evidence against confounding of the effects of other pollutants. However, our estimate of O3 on total and cardiovascular mortality became statistically insignificant after adding NO2 into the model. Our observed effect of O3 may actually reflect the risk from the photochemical pollution mixture more generally. In addition to O3, atmospheric photochemistry produces several hazardous pollutants, such as peroxyacyl nitrates. O3 may act as a surrogate indicator for this highly complex and geographically variable mixture and is likely to be an imperfect measure of potential toxicity (Bell et al. 2004).
Our estimated effect was relatively robust to the confounding factors such as seasonality, long-term trends, temperature, and other pollutants. The results indicate a substantial health burden from O3 pollution. However, this value is probably an underestimate of the total mortality burden from such an increase in O3 because it accounts for only the short-term effects. Further, we found a relationship between mortality and O3 at pollution levels below the current regulatory standard. Our analysis is limited to the urban area of Shanghai, although rural communities may also experience elevated O3 levels, especially because of large biogenic emissions of volatile organic compounds and the movement of O3 and O3 precursors from urban regions.
Several groups within the population have been considered at increased risk from O3 exposure, including women, older persons, and those with underlying chronic cardiovascular diseases. Our study also confirmed the previous findings that the association between O3 exposure and the mortality risk of cardiovascular diseases was stronger than all-cause mortality risk. There are several possible underlying mechanisms for the possible link between O3 exposure and cardiovascular mortality: inflammation of pulmonary tissues, which can induce a spectrum of mediators that also may alter cardiac functions, or irritant-receptor–mediated stimulation of parasympathetic pathways (Watkinson et al. 2001). O3 is a potent oxidant that has been shown to produce free radicals and oxidative stress on lung cells (Ahmad et al. 2005); however, we did not observe a significant effect of O3 on respiratory mortality. This is consistent with the results of a recent meta-analysis from 39 time-series studies (Bell et al. 2005). The relative small number of deaths due to respiratory diseases may have limited our ability to detect small pollution association (Kinney and Ozkaynak 1991).
Conclusion
The results presented here show an independent association between mortality outcomes and O3 exposure in the cold season in Shanghai. Our analyses provide evidence that the current level of O3 has an adverse effect on the health of the general population and strengthen the rationale for further limiting levels of O3 pollution in outdoor air in Shanghai.
Footnotes
This study was funded by the Health Effects Institute through grant 4717-RFIQ03-3/04-13. The research was also supported by the Division of Intramural Research, NIEHS.
The views expressed in this article are those of the authors and do not necessarily reflect the views of the Health Effects Institute or its sponsors.
References
- Ahmad S, Ahmad A, McConville G, Schneider BK, Allen CB, Manzer R, et al. Lung epithelial cells release ATP during ozone exposure: signaling for cell survival. Free Radic Biol Med. 2005;39:213–226. doi: 10.1016/j.freeradbiomed.2005.03.009. [DOI] [PubMed] [Google Scholar]
- American Thoracic Society, Committee of the Environmental and Occupational Health Assembly. Health effects of outdoor air pollution. Am J Respir Crit Care Med. 1996;153:3–50. doi: 10.1164/ajrccm.153.1.8542133. [DOI] [PubMed] [Google Scholar]
- Anderson HR, Bremner SA, Atkinson RW, Harrison RM, Walters S. Particulate matter and daily mortality and hospital admissions in the West Midlands conurbation of the United Kingdom. Occup Environ Med. 2001;58:504–510. doi: 10.1136/oem.58.8.504. [DOI] [PMC free article] [PubMed] [Google Scholar]
- Avol EL, Navidi WC, Colome SD. Modeling ozone levels in and around Southern California homes. Environ Sci Technol. 1998;32:463–468. [Google Scholar]
- Bates D. Ambient ozone and mortality. Epidemiology. 2005;16:427–429. doi: 10.1097/01.ede.0000165793.71278.ec. [DOI] [PubMed] [Google Scholar]
- Bell ML, Dominici F, Samet JM. A meta-analysis of time-series studies of ozone and mortality with comparison to the national morbidity, mortality, and air pollution study. Epidemiology. 2005;16:436–445. doi: 10.1097/01.ede.0000165817.40152.85. [DOI] [PMC free article] [PubMed] [Google Scholar]
- Bell ML, McDermott A, Zeger SL, Samet JM, Dominici F. Ozone and short-term mortality in 95 US urban communities, 1987–2000. JAMA. 2004;292:2372–2378. doi: 10.1001/jama.292.19.2372. [DOI] [PMC free article] [PubMed] [Google Scholar]
- Borja-Aburto VH, Loomis DP, Bangdiwala SI, Shy CM, Rascon-Pacheco RA. Ozone, suspended particulates, and daily mortality in Mexico City. Am J Epidemiol. 1997;145:258–268. doi: 10.1093/oxfordjournals.aje.a009099. [DOI] [PubMed] [Google Scholar]
- Braga AL, Zanobetti A, Schwartz J. The lag structure between particulate air pollution and respiratory and cardiovascular deaths in 10 US cities. J Occup Environ Med. 2001;43:927–933. doi: 10.1097/00043764-200111000-00001. [DOI] [PubMed] [Google Scholar]
- Brook RD, Franklin B, Cascio W, Hong Y, Howard G, Lipsett M, et al. Air pollution and cardiovascular disease: a statement for healthcare professionals from the Expert Panel on Population and Prevention Science of the American Heart Association. Circulation. 2004;109:2655–2671. doi: 10.1161/01.CIR.0000128587.30041.C8. [DOI] [PubMed] [Google Scholar]
- Chen B, Hong C, Kan H. Exposures and health outcomes from outdoor air pollutants in China. Toxicology. 2004;198:291–300. doi: 10.1016/j.tox.2004.02.005. [DOI] [PubMed] [Google Scholar]
- Dockery DW, Pope CA., III Acute respiratory effects of particulate air pollution. Annu Rev Public Health. 1994;15:107–132. doi: 10.1146/annurev.pu.15.050194.000543. [DOI] [PubMed] [Google Scholar]
- Folinsbee LJ, Horstman DH, Kehrl HR, Harder S, Abdul-Salaam S, Ives PJ. Respiratory responses to repeated prolonged exposure to 0.12 ppm ozone. Am J Respir Crit Care Med. 1994;149:98–105. doi: 10.1164/ajrccm.149.1.8111607. [DOI] [PubMed] [Google Scholar]
- Frank R, Liu MC, Spannhake EW, Mlynarek S, Macri K, Weinmann GG. Repetitive ozone exposure of young adults: evidence of persistent small airway dysfunction. Am J Respir Crit Care Med. 2001;164:1253–1260. doi: 10.1164/ajrccm.164.7.2010043. [DOI] [PubMed] [Google Scholar]
- Goldberg MS, Burnett RT, Brook J, Bailar JC, Valois MF, Vincent R. Associations between daily cause-specific mortality and concentrations of ground-level ozone in Montreal, Quebec. Am J Epidemiol. 2001;154:817–826. doi: 10.1093/aje/154.9.817. [DOI] [PubMed] [Google Scholar]
- Golub GH, Heath M, Wahba G. Generalized cross-validation as a method for choosing a good ridge parameter. Technometrics. 1979;21:215–223. [Google Scholar]
- Gryparis A, Forsberg B, Katsouyanni K, Analitis A, Touloumi G, Schwartz J, et al. Acute effects of ozone on mortality from the “Air Pollution and Health: A European Approach” project. Am J Respir Crit Care Med. 2004;170:1080–1087. doi: 10.1164/rccm.200403-333OC. [DOI] [PubMed] [Google Scholar]
- Hastie TJ, Tibshirani RJ. 1990. Generalized Additive Models. London:Chapman & Hall.
- Health Effects Institute 2004. Health Effects of Outdoor Air Pollution in Developing Countries of Asia: A Literature Review. Boston:Health Effects Institute.
- Hoek G, Schwartz JD, Groot B, Eilers P. Effects of ambient particulate matter and ozone on daily mortality in Rotterdam, the Netherlands. Arch Environ Health. 1997;52:455–463. doi: 10.1080/00039899709602224. [DOI] [PubMed] [Google Scholar]
- Hong Y-C, Lee J-T, Kim H, Kwon H-J. Air pollution: a new risk factor in ischemic stroke mortality. Stroke. 2002;33:2165–2169. doi: 10.1161/01.str.0000026865.52610.5b. [DOI] [PubMed] [Google Scholar]
- Hong Y-C, Leem J-H, Ha E-H, Christiani DC. PM10 exposure, gaseous pollutants, and daily mortality in Ichon, South Korea. Environ Health Perspect. 1999;107:873–878. doi: 10.1289/ehp.99107873. [DOI] [PMC free article] [PubMed] [Google Scholar]
- Ito K, De Leon SF, Lippmann M. Associations between ozone and daily mortality: analysis and meta-analysis. Epidemiology. 2005;16:446–457. doi: 10.1097/01.ede.0000165821.90114.7f. [DOI] [PubMed] [Google Scholar]
- Ito K, Thurston GD. Daily PM10/mortality associations: an investigation of at-risk subpopulations. J Expo Anal Environ Epidemiol. 1996;6:79–95. [PubMed] [Google Scholar]
- Kan H, Chen B. Air pollution and daily mortality in Shanghai: a time series study. Arch Environ Health. 2003a;58:360–367. [PubMed] [Google Scholar]
- Kan H, Chen B. A case-crossover analysis of air pollution and daily mortality in Shanghai. J Occup Health. 2003b;45:119–124. doi: 10.1539/joh.45.119. [DOI] [PubMed] [Google Scholar]
- Kinney PL, Ozkaynak H. Associations of daily mortality and air pollution in Los Angeles County. Environ Res. 1991;54:99–120. doi: 10.1016/s0013-9351(05)80094-5. [DOI] [PubMed] [Google Scholar]
- Künzli N, Jerrett M, Mack WJ, Beckerman B, LaBree L, Gilliland F, et al. Ambient air pollution and atherosclerosis in Los Angeles. Environ Health Perspect. 2005;113:201–206. doi: 10.1289/ehp.7523. [DOI] [PMC free article] [PubMed] [Google Scholar]
- Levy JI, Chemerynski SM, Sarnat JA. Ozone exposure and mortality: an empiric Bayes metaregression analysis. Epidemiology. 2005;16:458–468. doi: 10.1097/01.ede.0000165820.08301.b3. [DOI] [PubMed] [Google Scholar]
- Loomis D, Castillejos M, Gold DR, McDonnell W, Borja-Aburto VH. Air pollution and infant mortality in Mexico City. Epidemiology. 1999;10:118–123. [PubMed] [Google Scholar]
- Prescott GJ, Cohen GR, Elton RA, Fowkes FG, Agius RM. Urban air pollution and cardiopulmonary ill health. Occup Environ Med. 1998;55:697–704. doi: 10.1136/oem.55.10.697. [DOI] [PMC free article] [PubMed] [Google Scholar]
- R Development Core Team 2006. R: A Language and Environment for Statistical Computing, version 2.1.1. Vienna:R Foundation for Statistical Computing.
- Samet JM, Dominici F, Curriero FC, Coursac I, Zeger SL. Fine particulate air pollution and mortality in 20 U.S. cities, 1987–1994. N Engl J Med. 2000a;343:1742–1749. doi: 10.1056/NEJM200012143432401. [DOI] [PubMed] [Google Scholar]
- Samet JM, Dominici F, Zeger SL, Schwartz J, Dockery DW. The National Morbidity, Mortality, and Air Pollution Study. Part I: Methods and methodologic issues. Res Rep Health Eff Inst. 2000b;94:5–74. [PubMed] [Google Scholar]
- Schwartz J. How sensitive is the association between ozone and daily deaths to control for temperature? Am J Respir Crit Care Med. 2005;171:627–631. doi: 10.1164/rccm.200407-933OC. [DOI] [PubMed] [Google Scholar]
- U.S. EPA 1999a. The Benefits and Costs of the Clean Air Act: 1990 to 2010. Washington, DC:U.S. Environmental Protection Agency, Office of Air and Radiation.
- U.S. EPA 1999b. Regulatory Impact Analysis—Control of Air Pollution from New Motor Vehicles: Tier 2 Motor Vehicle Emissions Standards and Gasoline Sulfur Control Requirements. Washington, DC:U.S. Environmental Protection Agency, Office of Air and Radiation.
- U.S. EPA 2003. Draft Regulatory Impact Analysis: Control of Emissions from Nonroad Diesel Engines. Washington, DC:U.S. Environmental Protection Agency, Assessment and Standards Division, Office of Transportation and Air Quality.
- Venners SA, Wang B, Xu Z, Schlatter Y, Wang L, Xu X. Particulate matter, sulfur dioxide, and daily mortality in Chongqing, China. Environ Health Perspect. 2003;111:562–567. doi: 10.1289/ehp.5664. [DOI] [PMC free article] [PubMed] [Google Scholar]
- Watkinson WP, Campen MJ, Nolan JP, Costa DL. Cardiovascular and systemic responses to inhaled pollutants in rodents: effects of ozone and particulate matter. Environ Health Perspect. 2001;109(suppl 4):539–546. doi: 10.1289/ehp.01109s4539. [DOI] [PMC free article] [PubMed] [Google Scholar]
- WHO 1977. International Classification of Diseases, Ninth Revision. Geneva:World Health Organization.
- WHO 1994. International Classification of Diseases, Tenth Revision. Geneva:World Health Organization.
- WHO 2000. Air Quality Guideline for Europe. WHO Regional Publication, European Series, No. 91. Copenhagen:World Health Organization. [PubMed]
- Wong CM, Ma S, Hedley AJ, Lam TH. Does ozone have any effect on daily hospital admissions for circulatory diseases? J Epidemiol Community Health. 1999;53:580–581. doi: 10.1136/jech.53.9.580. [DOI] [PMC free article] [PubMed] [Google Scholar]
- Wong CM, Ma S, Hedley AJ, Lam TH. Effect of air pollution on daily mortality in Hong Kong. Environ Health Perspect. 2001;109:335–340. doi: 10.1289/ehp.01109335. [DOI] [PMC free article] [PubMed] [Google Scholar]
- Xu X, Gao J, Dockery DW, Chen Y. Air pollution and daily mortality in residential areas of Beijing, China. Arch Environ Health. 1994;49:216–222. doi: 10.1080/00039896.1994.9937470. [DOI] [PubMed] [Google Scholar]
- Xu Z. Effect evaluation on smoking control plan for one year in Shanghai-China/WHO smoking control capability construction cooperation items [in Chinese] Chin J Health Educ. 2005;21:412–416. [Google Scholar]
- Xu Z, Yu D, Jing L, Xu X. Air pollution and daily mortality in Shenyang, China. Arch Environ Health. 2000;55:115–120. doi: 10.1080/00039890009603397. [DOI] [PubMed] [Google Scholar]
- Yunginger JW, Reed CE, O’Connell EJ, Melton LJ, III, O’Fallon WM, Silverstein MD. A community-based study of the epidemiology of asthma. Incidence rates, 1964–1983. Am Rev Respir Dis. 1992;146:888–894. doi: 10.1164/ajrccm/146.4.888. [DOI] [PubMed] [Google Scholar]
- Zanobetti A, Schwartz J, Samoli E, Gryparis A, Touloumi G, Atkinson R, et al. The temporal pattern of mortality responses to air pollution: a multicity assessment of mortality displacement. Epidemiology. 2002;13:87–93. doi: 10.1097/00001648-200201000-00014. [DOI] [PubMed] [Google Scholar]
- Zeger SL, Thomas D, Dominici F, Samet JM, Schwartz J, Dockery D, et al. Exposure measurement error in time-series studies of air pollution: concepts and consequences. Environ Health Perspect. 2000;108:419–426. doi: 10.1289/ehp.00108419. [DOI] [PMC free article] [PubMed] [Google Scholar]
- Zhang J, Lioy PJ. Ozone in residential air: concentrations, I/O ratios, indoor chemistry, and exposures. Indoor Air. 1994;4:95–105. [Google Scholar]