Abstract
Multinuclear three-dimensional solid-state MRI of bone, tooth, and synthetic calcium phosphates is demonstrated in vitro and in vivo with a projection reconstruction technique based on acquisition of free induction decays in the presence of fixed amplitude magnetic field gradients. Phosphorus-31 solid-state MRI provides direct images of the calcium phosphate constituents of bone substance and is a quantitative measurement of the true volumetric bone mineral density of the bone. Proton solid-state MRI shows the density of bone matrix including its organic constituents, which consist principally of collagen. These solid-state MRI methods promise to yield a biological picture of bone richer in information concerning the bone composition and short range-crystalline order than the fluid-state images provided by conventional proton MRI or the density images produced by radiologic imaging techniques. Three-dimensional solid-state projection reconstruction MRI should be readily adaptable to both human clinical use and nonmedical applications for a variety of solids in materials science.
The solid substance (1) of cancellous and compact bone, consisting of solid phases of calcium phosphate mineral and organic matrix, is most often characterized in vivo by noninvasive methods including ionizing radiation, among which are emission tomography based on radiolabeled pharmaceuticals, x-ray computed tomography, and dual energy x-ray absorptiometry. One of the few nonradiative methods is conventional (i.e., fluid state) proton NMR imaging (or MRI), which has been used recently to characterize the total bone substance (mineral plus matrix) in a specific region of cancellous bone tissue indirectly by imaging the marrow space. In effect, a negative image of the bone substance is produced. If the image has sufficiently high spatial resolution such that the marrow spaces between the bony trabeculae are resolved (which is difficult to achieve for humans in vivo), the microarchitectural details of the trabecular network may be geometrically analyzed in various ways (2), and the volume fraction of bone substance (which is related to the bone mineral density) may be determined. If the image has insufficient spatial resolution, signal dephasing caused by the microscopic distribution of magnetic susceptibility discontinuities between marrow and bone substance can be used to derive information (e.g., textural information) about the trabecular network (3, 4), which may or may not be related to the mass of bone.
However, none of the noninvasive characterization methods is capable of yielding direct information concerning the masses of bone mineral and matrix independently and are, therefore, incapable of yielding the extent of mineralization (the ratio of actual mineral density to full potential mineralization). Most importantly, they provide no information about the chemical composition or chemical structure of the mineral.
Bone mineral is a nonstoichiometric calcium-deficient apatite, whose crystal structure is basically that of the synthetic or geological mineral hydroxyapatite, Ca10(OH)2(PO4)6. Although the overall crystal structure and composition of bone apatite are similar to those of hydroxyapatite, there are highly significant compositional and functional differences between bone apatite and hydroxyapatite. These differences include smaller crystal size, reduced short-range crystalline order, the absence of OH− groups, and the presence of CO32− and HPO42− groups in bone apatite. (1, 5–9). In addition, the HPO42− in bone apatite is distinctly different in its environment from HPO42− in synthetic hydroxyapatites and other calcium phosphate phases containing HPO42− groups (8). These differences markedly affect the reactivity of bone crystals with ions and organic constituents present in extracellular fluids and in bone cells and, therefore, also affect the ability and effectiveness of bone apatite crystals in participating in the various biological and structural functions of the crystals in vivo (1). Importantly, these compositional and structural differences change significantly with the time that the crystals remain in the tissue (crystal maturation). Thus, the changes reflect the local and/or systemic rates of bone formation and resorption, i.e., the changes reflect the metabolism of bone tissue locally and/or systemically.
It is for this reason that a new approach, reported in this paper, has been developed to characterize bone by a method that is sensitive to the chemical composition and structure of bone apatite crystals; also, this method can, in principle, provide the true volumetric mass densities of bone mineral and matrix independently. Based on solid-state MRI, this methodology is compatible with the safety and tolerance concerns appropriate for living subjects. The ability to quantitatively image mineral and matrix chemistry, in addition to measuring true volumetric mineral and matrix density, in vivo, should prove extremely useful in studying bone growth, healing, and disease noninvasively. Frequent repeated examinations of patients would pose no risk caused by exposure to ionizing radiation, which is especially important in young and growing children and women of childbearing age.
Bone mineral and other solids have been generally regarded as beyond the purview of MRI because of the difficulty of eliciting and acquiring magnetic resonance (MR) signals from nuclei with exceedingly short spin–spin relaxation times (T2s). Yet, techniques for solid-state MR spectroscopy of analytical (i.e., subcentimeter sized) specimens (10) have evolved to a high degree of sophistication, in parallel with the fluid-state techniques that underlie the overwhelming preponderance of biomedical and clinical applications of MR. Within the last decade, methods for solid-state MRI have experienced rapid growth, albeit almost exclusively for nonmedical applications (11, 12). Most solid-state MRI techniques are not suitable for living systems because they require high-power radiofrequency (RF) or magnetic field gradient pulses of uniform intensity that may be impractical over large volumes or hazardous to live subjects.
MR is distinguished from the majority of other imaging modalities because it is richly endowed with information content carried in the form of relaxation and chemical shift information reflecting underlying molecular dynamics and structure. It is this inherent ability to reflect the microphysiology of tissues that makes MR so diagnostically powerful. In solids, although both spectral resolution and signal-to-noise ratio are much lower than in fluid systems, a broader variety of relaxation times and chemical shift parameters are operative, and these parameters can be used to characterize the material or subject under study. Thus, the motivation for the present work is to develop means to quantitatively image bone mineral chemistry and chemical structure, as well as image the mineral and matrix densities separately. This additional information will be a useful adjunct to the basic morphological and density characterization afforded by existing radiologic techniques.
Solid-state MRI differs radically from conventional (i.e., fluid-state) proton MRI used to characterize bone mineral: fluid-state proton MRI derives information concerning bone mineral indirectly by imaging the fluid of the marrow space, whereas the solid-state technique detects the mineral or matrix directly. Methods for solid-state MR spectroscopy of living subjects have been published (13–18, ‖), as have reports of MRI of bone protons associated with bone mineral**,‡‡ or tooth (19). Our laboratory has reported the application of free induction decay projection imaging for measuring true volumetric bone mineral density in ex vivo specimens of bone (20).
In the present report we demonstrate methods to obtain three-dimensional MR phosphorus-31 (31P), fluorine-19 (19F), and hydrogen-1 (proton or 1H) images of bone, tooth, and synthetic calcium phosphates, progressing from examples of isolated dry specimens to specimens with soft tissues intact and finally to an in vivo study involving chemically sensitive imaging. These methods, which avoid the rapidly switched field gradients and intense RF power levels usually used in solid-state MR, are readily adaptable to studies in human subjects.
EXPERIMENTAL DETAILS
Teeth were intact extractions containing no metallic restorations. In vitro bone specimens were cut from sections of long bones: typically 2-cm-long transverse sections of porcine, bovine, or ovine mid-diaphyseal tibiae. Some specimens were cleaned of soft tissue and dried, and some were maintained relatively hydrated with soft tissue and muscle intact (for these specimens enough of the overlying skin and muscle were removed to fit the RF coil). Synthetic calcium phosphates were obtained from commercial sources: hydroxyapatite, Ca10(OH)2(PO4)6, was from Aldrich, and fluoroapatite, Ca10F2(PO4)6, and β-tricalcium phosphate [TCP, Ca3(PO4)2] were from Clarkson Chromatography Products (South Williamsport, PA). Animal studies were approved by the Massachusetts General Hospital and Children’s Hospital institutional animal care and use committees and were in accord with all applicable guidelines.
The projection MRI (20–23) pulse sequence consists of a single, fixed-amplitude magnetic field gradient pulse, during which a short, hard RF pulse is issued after a suitable delay following the start of the gradient pulse to allow eddy currents (induced in the electrically conductive structures of the probe and magnet) to decay. A total of 256 samples of the free induction decay are then obtained while the gradient is held constant. This sequence is repeated for a total of 998 gradient directions distributed in a uniform pattern about the unit sphere. Typically, four acquisitions at each gradient direction were averaged. For smaller specimens, images were obtained at 2.0 T field strength (31P resonance frequency, 34.30 MHz; 19F resonance frequency, 79.65 MHz) in an 18-cm-bore-diameter magnet (Nalorac Cryogenics, Martinez, CA) equipped with a Spectroscopy Imaging Systems/Varian console. Rabbits were imaged in an Oxford Instruments (Oxford) 4.7 T (31P resonance frequency, 81.03 MHz; 1H resonance frequency, 200 MHz), 30-cm-bore-diameter magnet equipped with a Bruker Instruments (Fremont, CA; formerly General Electric) Omega console.
An RF pulse flip angle of about 10° and maximum gradient strength of about 60 mT m−1 (6G cm−1) were used if not otherwise specified. The sequence repetition time was 0.3 s at 2.0 T and 0.5 s at 4.7 T. Typical total acquisition times were 20 min to 3.4 h. A single-tuned solenoidal coil was used in the 2.0 T instrument, and surface coils (either single tuned or double tuned for combined 1H/31P measurements) were used at 4.7 T. Standard inversion recovery or saturation recovery pulse sequences were used to measure T1s; spectroscopic (nonimaging) and imaging measurements of T1 compared well. Image reconstruction was performed by weighting the 256 time domain samples of the free induction decays by the square of the time, blurring each sample onto the surrounding eight points of a 64 × 64 × 64 cubic reconstruction lattice, correcting the weighting of the lattice points for small variations in the local data density around each point, Fourier transforming, and finally correcting the intensities of the space domain points to compensate for the blurring step (24, ††). This direct Fourier reconstruction is much quicker than reconstructing by back projection. Three-dimensional (3D) segmentation and rendering of image data were performed with the analyze (Mayo Clinic, Rochester, MN) and avs (Advanced Visual Systems, Waltham, MA) software packages.
RESULTS AND DISCUSSION
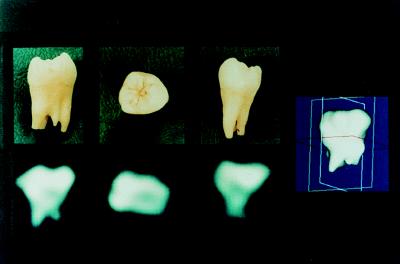
Simple 3D imaging is illustrated by Fig. 1, which shows the 31P solid-state MRI of an extracted human molar at 2.0 T. The three 2D views are orthogonal planes (in approximately the buccal-lingual, crown-apical, and mesial-distal orientations) selected from the full 3D data set. The dense crown regions are required to bear the greatest load during mastication and yield the brightest intensity in the 2D views because of the greater mass density of mineral. The accompanying photographs of the specimen posed in the three orientations demonstrate the correspondence between the actual specimen and the MRI data; however, the photographic views only approximate the actual orientation of the specimen during imaging and may be somewhat angulated with respect to the precisely determined MRI views. The spatial resolution is about 3 mm. It should be noted that the 2D images are slices from the 3D data set, not projective views (i.e., not integrated along the normal to the view plane) as would be obtained in plain film radiography or dual energy x-ray absorptiometry.
Figure 1.
Phosphorus-31 solid-state MRI of a human molar obtained by 3D projection imaging of 998 free induction decays at 2.0 T field strength. The three 2D images are planes of data selected from the full 3D data set. Alternatively, radiographic or dual energy x-ray absorptiometry-like projective views could have been easily shown as well. On the right is shown a solid body representation of the same data set, binary segmented by finding the surface containing all pixels above a threshold value and rendered by Gouraud shading.
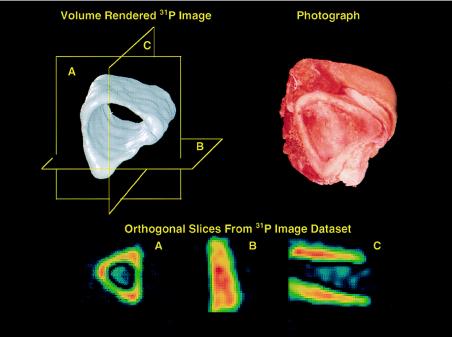
The presence of soft tissues poses no problem with artifacts for background 31P signals. Fig. 2 shows a section of freshly dissected porcine tibia, similarly imaged as above but with the soft tissues intact and fully hydrated. Because the concentration of phosphorus in bone is larger than that in soft tissue by several orders of magnitude, the 31P MR signal from solution metabolites (PCr, ATP, Pi, etc.) does not interfere with the signal from bone, despite the solution signals being spectrally quite narrow and, therefore, of intrinsically high receptivity and conspicuity.
Figure 2.
Phosphorus-31 solid-state MRI of a section of fresh intact porcine bone cut from the tibial mid-shaft region, showing the solid body representation (Upper Left) and a photograph of the specimen (Upper Right). The presence of soft tissue does not interfere with the imaging process. The three 2D slices of the data set (Lower) correspond to the planes shown in the solid body rendition.
Solid-state bone MRI need not necessarily be limited to 31P. Images of other isotopes may provide highly informative additional data about the specimen. For example, fluoride ion is readily taken up in bone as mineral is deposited and shows excellent potential as an orally administered MR-visible marker. Aqueous sodium fluoride in the drinking water of rats results in good solid-state MR 19F signal intensity from the tibiae of live animals because of the uptake of fluoride ions by the apatite crystals.§§ We imaged cylindrical phantoms of fluoroapatite diluted with hydroxyapatite to simulate the fluoride content of bone, although, because the concentration of the 19F nuclear species in bone is far lower than that of 31P, poorer spatial resolution must be accepted if imaging times are to be kept tolerable. A temporal sequence of solid-state 19F MR measurements might provide a means to determine the patterns and rates of fluoride uptake (and therefore of bone mineral deposition) within the skeleton.
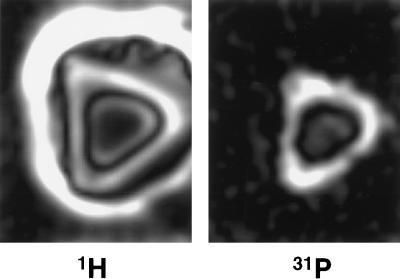
Bone may also be imaged with 1H solid-state MRI to show the total hydrogen content. Fig. 3 compares corresponding slices from the 4.7 T 31P and 1H 3D images of a specimen of porcine bone with soft tissues intact. Because the solid-state proton image shows protons in all of the solid phases (mineral and matrix) as well as in the soft tissues, areas of dense bone substance appear bright. However, in conventional proton MRI, bone substance appears dark because the solid phases yield no signal as a result of their very short T2. The fluid proton contribution to the total proton image may be removed by subtracting an image that is weighted to exclude short T2 components, e.g., by including a spin echo with long echo time in the pulse sequence.
Figure 3.
Cross sections from 3D proton (Left) and phosphorus-31 (Right) solid-state MR images of an intact fresh specimen of midshaft porcine tibia. Note that cortical bone is bright in the proton image, as opposed to what it would be in conventional proton MRI. Muscle appears dark and subcutaneous fat is quite bright because of the spin-lattice relaxation times T1 of these tissues and the pulse repetition time used to acquire the proton image.
Having multiple multinuclear images of the same volume permits the creation of derived images representing other characteristics of the subject by computing the derived images from the original images on a pixel-by-pixel basis (25). For example, because most of the proton signal from mineralized bone substance arises from the organic matrix, the proton and phosphorus images could be used to compute on a pixel-by-pixel basis the ratio of intensities of the phosphorus image (which measures only mineral) and the solid-state proton image (which measures mostly matrix), to obtain a new image showing the extent of mineralization. Such image data are not obtainable by any other noninvasive method. Bone mineral density is often (and incorrectly) used to express the total density of bone substance (26). However, there is evidence that osteoporosis, for example, is a heterogeneous disease in which subgroups of patients are characterized by normal and reduced extent of mineralization (27). Similar situations also exist in rapidly synthesized total bone mass, as occurs, for instance, in fracture healing, where mineralization lags significantly behind the synthesis of the organic matrix. This could have profound implications for the effective management of such clinical conditions if both mineral and matrix densities can be separately measured noninvasively in this manner.
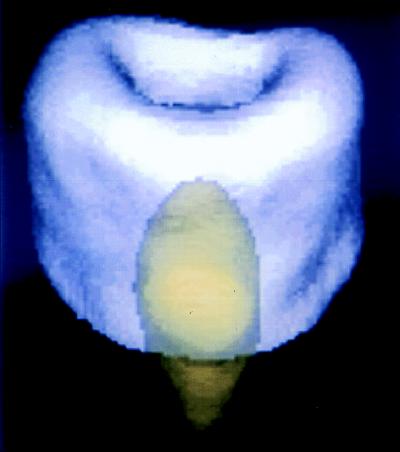
The 31P T1 of dry cortical bone is about 17–20 s at 2.0 T field strength and about 40 s at 4.7 T. The T1 of synthetic hydroxyapatite used is 0.5 s, permitting superb T1-based chemically sensitive discrimination between the synthetic and native mineral (the T1 of synthetic apatite varies with the conditions of its preparation). An implanted apatite ceramic was simulated by inserting a 10-mm-diameter by 10-mm-long plastic cylinder containing loosely packed synthetic hydroxyapatite into the medullary cavity of a section of porcine tibial bone. A 31P image at 2.0 T was obtained at a repetition time of 0.3 s and RF pulse flip angle of 20°. A second otherwise identical image was obtained with a flip angle of 90°. At the larger flip angle, the signal of the bone mineral, with longer T1, is saturated, yielding an image of only the synthetic material. Because of this differential response of the materials to the different pulse sequences, linear combinations of the raw images may be computed on a pixel-by-pixel basis to obtain quantitative “chemically pure” images (25), as has been done in Fig. 4. Such material-based discrimination between calcium phosphates of only subtly differing chemistry and chemical structure is impossible with radiologic techniques.
Figure 4.
Phosphorus-31 solid-state 3D projection reconstruction MR image of a section of the metaphyseal portion of porcine tibia containing a small capsule of synthetic hydroxyapatite powder to simulate a calcium phosphate-based prosthetic implant. The hydroxyapatite and the bone mineral, although chemically highly similar calcium phosphates, exhibit different MR spin lattice relaxation times T1. Two raw MR images, each with a different T1 sensitivity, were obtained and then appropriately combined on a pixel-by-pixel basis to yield chemically pure images of each material. The two images were then separately colorized and overlaid to produce the composite image. MR is unique among all 3D imaging methods applicable to solid materials, such as bone, ceramics, and polymers, because of its great sensitivity to chemical composition.
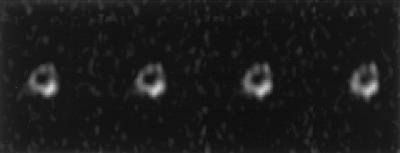
The principles in the previous paragraph are illustrated in Fig. 5, which shows several slices of the chemically sensitive 31P image of the right mid-femoral region of a live 5.5-kg New Zealand White rabbit. β-Tricalcium phosphate (TCP) was packed tightly into a 3-mm-diameter by 2-mm-long cylinder and inserted into a hole drilled transversely through the cortex of the right distal femur. The 31P image was obtained at 4.7 T, by using a 90° RF pulse flip angle. The 31P T1 of the live rabbit femur is 10 s in vivo, whereas that of TCP is 0.6 s. The large flip angle causes saturation of the bone signal but not that of the TCP implant. This technique could provide a considerable advantage in studying noninvasively the remodeling of bioactive materials in the body.
Figure 5.
Successive slices of a chemically sensitive phosphorus-31 solid-state 3D MR image of the mid-diaphyseal region of the femur of a live rabbit after surgical implantation of a cylinder of TCP, a prosthetic material commonly used for bone defect repair. The TCP mass projects partly out of the cortex (dense shell) of the femur. Enhancement of the TCP signal relative to the native bone mineral signal was achieved by using a large 90° RF pulse flip angle, which saturates the long T1 bone signal but not that of the short T1 implant material.
CONCLUSIONS
The primary advantage of solid-state MRI over other imaging techniques for synthetic calcium phosphates and bone is the sensitivity of MRI to chemical composition and structure. Its spatial resolution and sensitivity (which may be traded off with imaging time) are inherently low, making imaging times rather long, but still tolerable for live subjects, including humans. Additional spatial resolution may be gained only with enormously increased imaging time (12, 21, 22). However, the spatial resolution obtainable is adequate for many purposes, and when coupled with the chemical sensitivity, ability to resolve mixtures, and quantitative accuracy of MRI, the method can offer powerful advantages over conventional radiologic techniques for particular problems. These problems potentially include quantitative characterization of bone mineral and bone matrix (from which the extent of mineralization may be determined), the uptake of fluorinated tracers in bone, and the characterization of the remodeling process, in which both native bone mineral and synthetic calcium phosphates (implanted materials as well as transient intermediate phases) are identified, quantified, and selectively imaged.
These imaging methods could be readily applied to many nonmedical materials and have been in 2D form (15, 28, 29), although 2D images are incapable of yielding volumetric densities. The most interesting potential applications of the 3D imaging methods introduced here include those for which solid-state chemistry can vary with position within the specimen, as in ceramic or polymeric systems produced in situ by chemical reaction, or in which spatially dependent degradation processes occur.
Acknowledgments
Human dental extractions were kindly provided by Dr. Andrew Levine. Software assistance from J. Michael Vevea, Aiping Jiang, Fernando Boada, and James Christiansen and helpful discussions with Robert M. Neer are gratefully acknowledged. John Moore provided superb animal surgery and care services. Financial support was provided by National Institutes of Health Grants AR42258 and AR34081 from the National Institute of Arthritis and Musculoskeletal and Skin Diseases, AG14701 from the National Institute on Aging, and RR10099 and RR05873 from the National Institute of Research Resources and grants from the American Foundation for Aging Research, the Orthopaedic Research and Education Foundation, and the Peabody Foundation.
ABBREVIATIONS
- MR
magnetic resonance
- T1
spin-lattice relaxation time
- T2
spin–spin relaxation time
- 3D
three-dimensional
- 2D
two-dimensional
- TCP
β-tricalcium phosphate
- RF
radiofrequency
Footnotes
Dolecki, M., Sashin, D., Mosher, T. J., Herndon, J. H. & Smith, M. B. (1990) Abstracts, Ninth Annual Meeting, Society of Magnetic Resonance in Medicine, August 18–24, 1990, New York, p. 1229.
Jakob, P. M. & Haase, A. (1992) Abstracts, Eleventh Annual Meeting, Society of Magnetic Resonance in Medicine, August 8–14, 1992, Berlin, p. 3927.
Rohr, G., Nauert, A., Ilg, M. & Gewiese, B. (1994) Abstracts, Second Scientific Meeting, International Society of Magnetic Resonance in Medicine, August 6–12, 1992, San Francisco, p. 1568.
Chesler, D. A., Vevea, J. M., Boada, F. E., Reese, T., Chang, C., Barrére, B. J., Liu, A. M. & Thulborn, K. R. (1992) Abstracts, Eleventh Annual Meeting, Society of Magnetic Resonance in Medicine, August 8–14, 1992, Berlin, p. 665.
Lizak, M. J., Pfleiderer, B., Moore, J. & Ackerman, J. L. (1992) Abstracts, Eleventh Annual Meeting, Society of Magnetic Resonance in Medicine, August 8–14, 1992, Berlin, p. 4705.
References
- 1.Glimcher M J. In: Metabolic Bone Disease. Avioli L V, Krane S M, editors. San Diego: Academic; 1997. pp. 23–50. [Google Scholar]
- 2.Jara H, Wehrli F W, Chung H-W, Ford J C. Magn Reson Med. 1993;29:528–539. doi: 10.1002/mrm.1910290415. [DOI] [PubMed] [Google Scholar]
- 3.Ford J C, Wehrli F W, Chung H-W. Magn Reson Med. 1993;30:373–379. doi: 10.1002/mrm.1910300316. [DOI] [PubMed] [Google Scholar]
- 4.Majumdar S, Thomasson D, Shimakawa A, Genant H K. Magn Reson Med. 1991;22:111–127. doi: 10.1002/mrm.1910220112. [DOI] [PubMed] [Google Scholar]
- 5.Termine J D, Posner A S. Science. 1966;153:1523–1525. doi: 10.1126/science.153.3743.1523. [DOI] [PubMed] [Google Scholar]
- 6.Nancollas G H, LoRe M, Perez L, Richardson C, Zawacki S J. Anat Rec. 1989;224:234–241. doi: 10.1002/ar.1092240213. [DOI] [PubMed] [Google Scholar]
- 7.Wuthier R E, Wu L N, Sauer G R, Genge B R, Yoshimori T, Ishikawa Y. Bone Miner. 1992;17:290–295. doi: 10.1016/0169-6009(92)90753-z. [DOI] [PubMed] [Google Scholar]
- 8.Wu Y, Glimcher M J, Rey C, Ackerman J L. J Mol Biol. 1994;244:423–435. doi: 10.1006/jmbi.1994.1740. [DOI] [PubMed] [Google Scholar]
- 9.Rey C, Hina A, Glimcher M J. Cells Mater. 1995;5:345–356. [Google Scholar]
- 10.Mehring M. Principles of High Resolution NMR in Solids. Berlin: Springer; 1976. [Google Scholar]
- 11.Ackerman J L, Ellingson W A, editors. Advanced Tomographic Imaging Methods for the Analysis of Materials. Pittsburgh: Materials Research Society; 1991. [Google Scholar]
- 12.Cory D G. Annu Rep NMR Spectrosc. 1992;24:87–180. [Google Scholar]
- 13.Ebifegha M E, Code R F, Harrison J E, McNeill K G, Szyjkowski M. Phys Med Biol. 1987;32:439–451. doi: 10.1088/0031-9155/32/4/003. [DOI] [PubMed] [Google Scholar]
- 14.Brown C E, Battocletti J H, Srinivasan R, Allaway J R, Moore J, Sigmann P. Clin Chem. 1988;34:1431–1438. [PubMed] [Google Scholar]
- 15.Ackerman J L, Garrido L, Moore J R, Pfleiderer B, Wu Y. In: Magnetic Resonance Microscopy. Methods and Applications in Materials Science, Agriculture and Biomedicine. Blümich B, Kuhn W, editors. New York: VCH; 1992. pp. 237–260. [Google Scholar]
- 16.Ramanathan C, Wu Y, Pfleiderer B, Lizak M J, Garrido L, Ackerman J L. J Magn Reson. 1996;121:127–138. [Google Scholar]
- 17.Ramanathan C, Ackerman J L. J Magn Reson. 1997;127:26–35. doi: 10.1006/jmre.1997.1173. [DOI] [PubMed] [Google Scholar]
- 18.Mattei J P, Confort-Gouny S, Vion-Dury J, Roux H, Bisset J P, Cozzone P J. Calcif Tissue Int. 1995;56:529–532. doi: 10.1007/BF00298583. [DOI] [PubMed] [Google Scholar]
- 19.Ghosh P, Laidlaw H D, Fleischer K W, Barr A H, Jacobs R D. IEEE Trans Med Imag. 1995;14:616–620. doi: 10.1109/42.414627. [DOI] [PubMed] [Google Scholar]
- 20.Wu Y, Ackerman J L, Chesler D A, Li J, Neer R M, Wang J, Glimcher M J. Calcif Tissue Int. 1998;62:512–518. doi: 10.1007/s002239900471. [DOI] [PubMed] [Google Scholar]
- 21.Zhou X, Lauterbur P C. In: Magnetic Resonance Microscopy. Methods and Applications in Materials Science, Agriculture and Biomedicine. Blümich B, Kuhn W, editors. New York: VCH; 1992. pp. 3–27. [Google Scholar]
- 22.Callaghan P T. Principles of Nuclear Magnetic Resonance Microscopy. Oxford: Oxford Univ. Press; 1991. [Google Scholar]
- 23.Madio D P, Lowe I J. Magn Reson Med. 1995;34:525–529. doi: 10.1002/mrm.1910340407. [DOI] [PubMed] [Google Scholar]
- 24.Stearns C W, Chesler D A, Brownell G L. IEEE Trans Nucl Sci. 1990;37:773–777. [Google Scholar]
- 25.Moore J R, Garrido L, Ackerman J L. Magn Reson Med. 1995;33:293–299. doi: 10.1002/mrm.1910330303. [DOI] [PubMed] [Google Scholar]
- 26.Meunier P J, Boivin G. Bone. 1997;21:373–377. doi: 10.1016/s8756-3282(97)00170-1. [DOI] [PubMed] [Google Scholar]
- 27.Burnell J M, Baylink D J, Chestnut C H, III, Mathews M W, Teubner E J. Metabolism. 1982;31:1113–1120. doi: 10.1016/0026-0495(82)90161-5. [DOI] [PubMed] [Google Scholar]
- 28.Moore J R, Garrido L, Ackerman J L. Ceram Eng Sci Proc. 1990;11:1302–1319. [Google Scholar]
- 29.Suits B H, White D. Solid State Comm. 1984;50:291–295. [Google Scholar]


