Abstract
Oligonucleotide microarray-based hybridization is an emerging technology for genome-wide detection of DNA variations. We have extended this principle and developed a novel approach, called methylation-specific oligonucleotide (MSO) microarray, for detecting changes of DNA methylation in cancer. The method uses bisulfite-modified DNA as a template for PCR amplification, resulting in conversion of unmethylated cytosine, but not methylated cytosine, into thymine within CpG islands of interest. The amplified product, therefore, may contain a pool of DNA fragments with altered nucleotide sequences due to differential methylation status. A test sample is hybridized to a set of oligonucleotide (19–23 nucleotides in length) arrays that discriminate methylated and unmethylated cytosine at specific nucleotide positions, and quantitative differences in hybridization are determined by fluorescence analysis. A unique control system is also implemented to test the accuracy and reproducibility of oligonucleotides designed for microarray hybridization. This MSO microarray was applied to map methylated CpG sites within the human estrogen receptor α (ERα) gene CpG island in breast cancer cell lines, normal fibroblasts, breast tumors, and normal controls. Methylation patterns of the breast cancer cell lines, determined by MSO microarray, were further validated by bisulfite nucleotide sequencing (P <0.001). This proof-of-principle study shows that MSO microarray is a promising technique for mapping methylation changes in multiple CpG island loci and for generating epigenetic profiles in cancer.
[The sequence data described in this paper have been submitted to the data library under accession no. X03635.1 G1:31233.]
It is now clear that abnormally methylated cytosine within a CpG dinucleotide is a widespread phenomenon in cancer (Jones and Laird 1999). This epigenetic event has been observed in GC-rich regions, called CpG islands, frequently located in the promoter and exon 1 regions of genes. As a result of CpG island hypermethylation, chromatin structure in the promoter can be altered, preventing normal interaction with the transcriptional machinery (Baylin et al. 1998). If this occurs in genes critical to growth inhibition, the resulting silencing of transcription could promote tumor progression. In addition to classic genetic mutations, promoter CpG island hypermethylation has been shown to be a common mechanism for transcriptional inactivation of classic tumor suppressor genes (Baylin et al. 1998; Jones and Laird 1999) and genes important for cell cycle regulation (Costello et al. 1996; Nguyen et al. 2000), and DNA mismatch repair (Kane et al. 1997).
At present, several molecular biology methods are routinely used to determine the methylation status of a CpG island. Among these, bisulfite nucleotide sequencing is a standard technique for detailed mapping of methylated cytosine residues within a gene promoter. This meticulous method, developed by Frommer and colleagues (Frommer et al. 1992), relies on the ability of sodium bisulfite to deaminate cytosine residues into uracil in genomic DNA, whereas the methylated cytosine residues are resistant to this modification. The target DNA is then amplified by PCR with specific primers to yield fragments in which all uracil residues are converted to thymine, whereas methylated cytosine residues are amplified as cytosine. The PCR products are sequenced and the methylation status of individual CpG sites is then analyzed by comparing it with the unmodified sequences of a given promoter. Using this conventional method, many investigators have addressed the importance of promoter CpG hypermethylation in the regulation of specific gene transcription in cancer (Hiltunen et al. 1997; Stirzaker et al. 1997; Rice et al. 1998; Melki et al. 1999). The method, which requires cloning and sequencing of individual inserts, can be labor intensive and is restricted to the evaluation of DNA methylation on a gene-by-gene basis. Such an approach has given researchers a limited picture of complex epigenetic alterations in cancer. Clearly, a compelling need exists to develop novel technologies for the next phase of epigenome research.
Recently, considerable advances have been made in hybridization-based microarray technology for genome-wide analysis of gene mutations and single nucleotide polymorphisms (Ahrendt et al. 1999; Favis and Barany 2000; Wen et al. 2000). The technology uses thousands of short oligonucleotides arrayed on glass slides for detection of all possible nucleotide changes in target DNA. In this new approach, oligonucleotides are arrayed on solid supports that are known as probes, and the labeled complex DNA mixtures to be interrogated are known as targets (Hacia 1999).
In this study, we have built on this cutting-edge technology by developing a novel technique called methylation-specific oligonucleotide (MSO) microarray for DNA methylation analysis. The targets were derived from PCR products of bisulfite-modified DNA, whereas the probes used a series of arrayed oligonucleotides that can discriminate between converted and unconverted nucleotides, that is, unmethylated and methylated cytosine, at specific sites. Herein, we describe the MSO procedure and its application for mapping methylated CpG sites in the human estrogen receptor (ER) α gene CpG island in breast cancer cells, normal fibroblasts, breast tumors, and normal control samples.
RESULTS
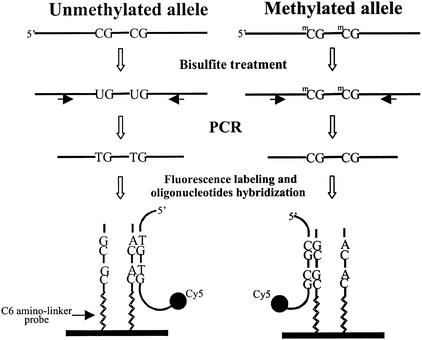
Figure 1 outlines the MSO strategy for DNA methylation analysis. Test DNA samples are bisulfite-modified, PCR-amplified products that contain pools of DNA fragments with altered nucleotide sequences due to their differential methylation status. As shown, the unmethylated allele of a given DNA sequence is expected to have the unmethylated cytosine of the test CpG sites converted to thymine, whereas these CpG sequences remain unchanged in the methylated allele. Target DNA is then hybridized to arrayed oligonucleotide probes specifically designed to discriminate between converted and unconverted nucleotides at these CpG sites.
Figure 1.
Schematic outline for analysis of DNA methylation based on oligonucleotide microarray. Genomic DNA is bisulfite treated and amplified by PCR for a specific CpG island region of interest. The amplified product is labeled with Cy5 fluorescence dye and hybridized to oligonucleotide probes attached to a glass surface. At left an oligonucleotide probe is designed to form a perfect match with a target DNA containing the unmethylated allele. At right a probe is designed to form a perfect match with the methylated DNA target.
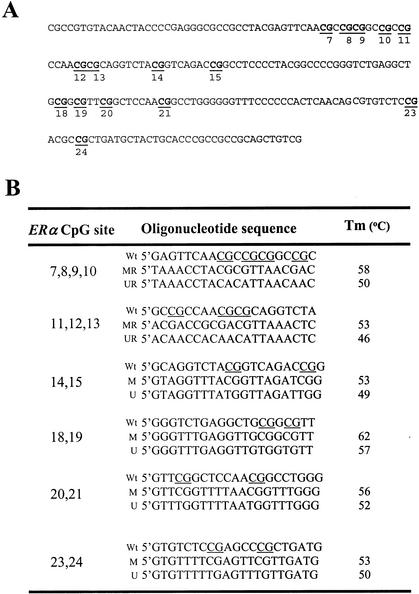
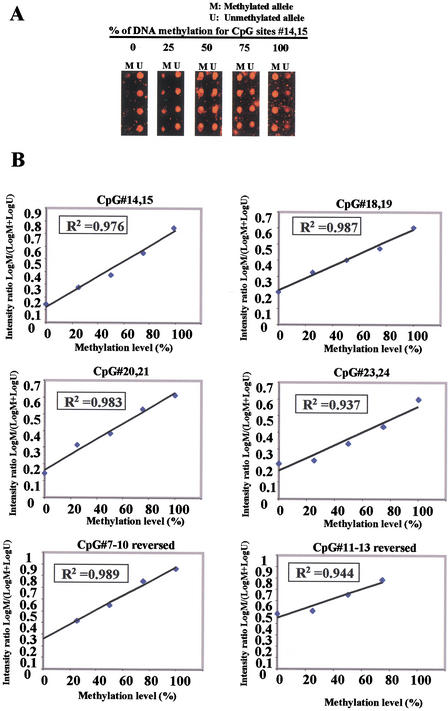
We determined the feasibility of this MSO strategy by assessing the methylation status of a CpG island located in the first exon of the ERα gene (Fig. 2A). A group of 12 arrayed oligonucleotides (19–23 nucleotides in length) was designed to test 15 CpG sites within the island; each set contained a pair of methylated and unmethylated oligonucleotides for interrogating 2 to 4 CpG sites in close proximity (Fig. 2B). First, control DNA targets were used to test the accuracy and reproducibility of probes designed for MSO hybridization. Both SssI methylase (SM)-treated and untreated control samples were subjected to bisulfite treatment and a 255-bp fragment in the ERα CpG island region was PCR amplified from these samples. The positive control generated in this way had 100% unconverted cytosine in the test CpG sites, whereas the negative control had all cytosine residues converted into thymine in the amplified DNA. The completeness of the SM treatment was validated by bisulfite DNA sequencing. Next, a series of MSO hybridization were performed with mixtures of Cy5-labeled SM-treated and untreated DNA targets at different proportions representing 0%, 25%, 50%, 75%, and 100% of DNA methylation to test the linearity of the protocol. An example of the MSO analysis for CpG#14,15 is shown in Figure 3A. The average intensity of hybridization signals from the four replicate spots (the average variation of replicates from all combinations of treated and untreated DNA target hybridizations was ∼15% of mean spot intensity) for the methylated (M) and unmethylated (U) alleles was then derived and used to calculate the intensity ratio of log M/log M+logU. In this case, a linear relationship (R2 = 0.976) was established, showing that the increase in DNA methylation was proportional to the increase in intensity ratios in the control samples. The result suggested that this set of oligonucleotide probes was optimal for the detection of methylation changes at CpG#14,15. This approach was applied to test other oligonucleotide probes and used to generate a set of standards for the calibration of DNA methylation changes in the test samples (Fig. 3B). We noticed that the regression line for CpG#11–13 reversed intersects much higher on the Y-axis than the rest of the CpG sites. This higher nonspecific hybridization is likely due to the lower melting temperature of the unmethylated probe. An oligonucleotide sequence such as this would result in the compression of the usable scale and makes the assessment of methylation status a little more challenging.
Figure 2.
(A) Nucleotide sequences of a downstream region of the human ERα CpG island (GenBank, accession no. X03635.1 G1:31233). The 15 CpG sites tested by MSO microarray are underlined and shown in bold. (B) Nucleotide sequences of methylated and unmethylated probes to be analyzed in MSO microarray.
Figure 3.
Standardization curve for MSO assays. (A) Mixtures of in vitro-methylated and untreated control DNA were prepared and amplified by PCR using bisulfite primers for the human ERα CpG island (see Methods). Target DNA was hybridized to MSO microarray. The Cy5 red fluorescence signals of the methylated (M) and unmethylated (U) alleles for CpG#14,15 are shown, reflecting the indicated percentage of methylation. (B) A calibration curve for measuring methylation changes at the ERα CpG sites. The intensity ratios (Y-axis) represent signal intensities of log M/log M+log U. The linear distribution shows that measurements of the different mixtures are well distinguished and can be used to determine the methylation status for test samples. The MSO assays were independently repeated three times with different target preparations.
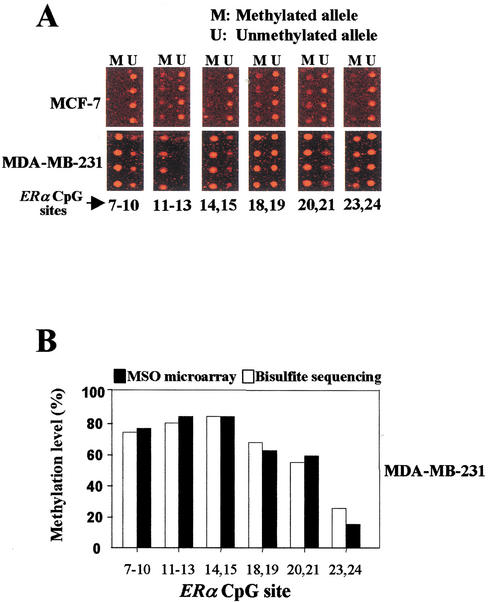
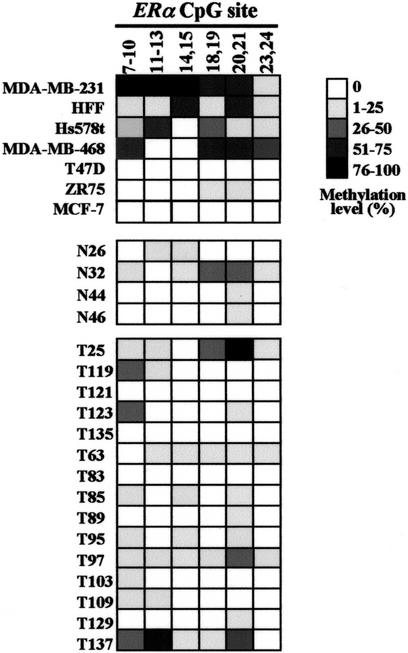
The MSO assay was applied to a panel of six breast cancer cell lines in which the methylation status of ERα was known previously (Ottaviano et al. 1994). Figure 4A shows representative examples of MSO results. By use of the standard curves derived from the aforementioned calibration controls, little or no methylation was detected in T47D, ZR75, or MCF-7 cells (Fig. 5). Extensive methylation of the ERα CpG island was observed in MDA-MB-231 and MDA-MB-468 cells, whereas a modest degree of methylation was seen in Hs578t cells. These MSO results were consistent with a previous methylation finding by Southern blot analysis (Ottaviano et al. 1994). This previous study also showed that hypermethylation of the ERα CpG island was associated with the silencing of this gene in these cell lines. To further validate the MSO findings, bisulfite sequence analysis was performed independently on MCF-7 and MDA-MB-231 cells. Again, no methylation was detected in MCF-7 cells, but extensive methylation was seen in MDA-MB-231 cells by bisulfite sequencing. The quantitative assessment of methylation in these two cell lines appears to be consistent with the data obtained by use of the MSO assays (P <0.001, assessed by linear regression analysis; Fig. 4B). Note that only the positive result of DNA hypermethylation in MDA-MB-231 cells is shown.
Figure 4.
Methylation analysis of 15 CpG sites in the human ERα CpG island using MSO microarray. The nucleotide positions of these sites are shown in Fig. 2B. (A) The red fluorescence images are shown for MCF-7 and MDA-MB-231 targets. For MCF-7 images, no methylation has been detected in the interrogating sites. The same probe can differentially discriminate between M (methylated allele) and U (unmethylated allele) in the Cy5-labeled targets for MDA-MB-231 cells. Various degrees of methylation were detected in MDA-MB-231 cell lines. This experiment was independently performed three times with different target preparations. (B) Comparison of methylation levels deteteced by the methylation-specific oligonucleotide microarray with those derived from bisulfite sequencing. The histograms show the percentage of methylation levels of CpG sites analyzed in MDA-MB-231 cells. Note that the methylation levels measured by the MSO microarray showed a significant correlation with data obtained from bisulfite sequencing (P <0.001, assessed by linear regression analysis).
Figure 5.
Methylation analysis of human ERα CpG island by MSO microarray. Summaries of the MSO results are shown for six breast cancer cell lines, one normal human fibroblast cell strain (HFF), four normal (N) breast tissue samples, and 15 primary breast tumors (T). Gray scale shown at right represents the methylation levels in percentage determined from the calibration curve for the test CpG sites (see example in Fig. 3).
Interestingly, our MSO study showed variable methylation of the ERα CpG island in a normal fibroblast strain HFF (Fig. 5). One possible explanation is that the expression of the ERα gene may be silenced in these male-derived cells via DNA hypermethylation in vitro.
The MSO assay was extended to study four normal mammary tissue samples and 15 primary breast tumors in which the methylation status of the ERα CpG island was not known previously (Fig. 5). With the exception of N32, the normal tissue DNA samples revealed little or no methylation by this MSO assay. Between 26% and 50% of DNA methylation was detected in most of the test CpG sites in N32. The initial methylation finding of this normal breast tissue (patient's age, 60 years old) may need further investigation as methylation of the ERα CpG island has commonly been seen in normal aging colorectal epithelia (Issa et al. 1994). Breast tumors showed an overall increase of DNA hypermethylation in the test sites relative to the normal controls. Five (T25, T119, T123, T97, and T137) of these fifteen tumors exhibited more methylation in a few of the test CpG sites. However, we did not observe a statistical correlation between this hypermethylation event and the ER-negativity status in these tumors. This could be attributed to the small number of breast tumors analyzed in this study. Alternatively, ER negativity may not always be associated with hypermethylation of the ERα CpG island in clinical specimens (Lapidus et al. 1998). To further validate the MSO findings in primary breast tumors, methylation-specific PCR (MS–PCR) was conducted in selected tumors and normal controls. One of the MSO test sites, ERα CpG#7–11, was used for this confirmation. A representation of the MS–PCR analysis was shown in Figure 6. By use of this approach, two normal breast tissues were found to be completely unmethylated (N46, N120), whereas the other was found to be partially methylated (N66). Analysis of the MS–PCR results on the 12 primary tumors showed that the methylation status of nine tumors matched that of MSO results. The remaining three MSO results could not be confirmed by MS–PCR (T135, T83, and T129). These tumors all had 0% methylation according to MSO analysis, but MS–PCR results showed a relatively faint band in the lane containing products amplified with methylated primers and a more prominent band in the lane containing products amplified with unmethylated primers (see, as an example, T129, in Fig. 6). It is conceivable that at very low levels of CpG island methylation, MS–PCR can detect methylation that is obscured by background hybridization in the MSO analysis.
Figure 6.
MS–PCR analysis of the ERα CpG#7–11 in primary breast tumors (T) and normal breast tissue (N). M and U indicate amplification using methylated and unmethylated sequence-specific primers, respectively. (Pos) Positive control; (Neg) negative control.
DISCUSSION
In this study, we have described a novel technique that combines bisulfite DNA assay and oligonucleotide microarray for a comprehensive analysis of DNA methylation. This MSO microarray has been successfully used to map methylated CpG sites within the ERα CpG island in cultured cells and clinical samples. The derived methylation information for cultured cells has been assessed quantitatively and independently confirmed by bisulfite sequencing analysis.
Another alternative, also based on the principle of oligonucleotide microarray, can achieve a comprehensive analysis of DNA methylation. In this case, oligonucleotide probes are designed such that their 3′ termini end just before interrogating CpG sites. These probes are arrayed on glass slides by attaching to the surface via their 5′ ends. Unlabeled bisulfite-modified targets are prepared, essentially following the steps described in this study. After target-probe annealing, in situ polymerase reaction is performed to allow extension to only one base [either Cy5(red)-ddTTP or Cy3(green)-ddCTP] away from an oligonucleotide primer. The extended molecule is identified on the basis of the incorporation of different fluorescence dyes for either the converted or unconverted nucleotides, that is, unmethylated or methylated cytosine residues, at the interrogating CpG sites. Quantitative analysis of methylation is determined by two-color fluorescence analysis.
This microarray-based analysis of DNA methylation is expected to provide new tools for research in this field. Until recently, most methylation assays have been limited to analyzing CpG islands of a few known genes and are restricted in throughput for a genome-wide analysis. In this regard, the MSO microarray potentially allows rapid screening of multiple CpG sites in many gene promoters. As of today, CpG island hypermethylation has been reported to be linked to the silencing of >100 genes in many types of cancers (see our web site: http://www.missouri.edu/∼hypermet). A DNA chip can be generated, containing hundreds of oligonucleotides designed to discriminate between methylated and unmethylated sequences in these gene promoters. Bisulfite-treated DNA from each of these loci can be amplified from test samples in a 96-well format to generate multiple targets for oligonucleotide hybridization. A gradient PCR approach will be used to allow the use of different primers with a wider spectrum of melting temperatures (Tm's). PCR products will be reamplified with nested primers and verified by use of a 96-well gel electrophoresis system. To further streamline processing of multiple DNA samples, a liquid handling system will be used to aliquot primers and DNA samples to the 96-well plates, and a robotic PCR system can facilitate the purification of Cy dye-labeled targets. This approach allows rapid dissection of complex epigenetic alterations during tumor progression.
As with other oligonucleotide microarrays, cross-hybridization between imperfect-match probes and targets was observed in our initial study using the MSO assay. To overcome this, we have found that selecting the optimal sequence composition for each oligonucleotide probe is critical in the assay. The specificity of a probe drops greatly when it contains more than four consecutive T or G residues. In addition, some probes may have inherently diminished hybridization signals, probably due to decreased duplex stability of targets and probes (Hacia 1999). Through careful data analysis, we have noticed that cross-reactivity might also increase when oligonucleotide probes are designed to query methylation differences in one single CpG site. This issue is easily overcome by designing probes to include two or more CpG sites. This design consideration may limit our ability to detect methylation changes in single CpG sites. Nonetheless, it is usually not necessary to assess the overall methylation status of a given CpG island by analyzing every CpG site within the locus. Also shown in this study is the use of a unique control system allowing testing the accuracy and reproducibility of the probes designed for microarray hybridization. This unique control system can also be used to calibrate the levels of methylation changes detected in the test samples by MSO. In some scenarios, when the background hybridization signals obscure the ability of MSO to detect low levels of methylation in test samples, this difficulty can be overcome by adjusting the stringency of the hybridization conditions and slide-washing conditions. Taken together, these implementations greatly alleviate common problems encountered in oligonucleotide hybridization.
In conclusion, the present technique can be readily reconfigured for high-throughput analysis of DNA methylation. It will contribute significant information to our understanding of CpG island methylation in cancer. It is also our hope that this microarray technique will allow researchers to study the effect of demethylating agents on the methylation status of critical genes, thereby assessing their usefulness in chemotherapy regimens.
METHODS
Cell Lines
Breast cancer cell lines MCF-7, T47D, ZR75, MDA-MB-231, MDA-MB-468, Hs578t, and human foreskin fibroblast strain HFF used in this study were routinely maintained in our laboratory as described (Laux et al. 1999). Fifteen breast tumors and four normal control samples from patients undergoing mastectomy at the Ellis Fischel Cancer Center were used as clinical specimens for this study. Specimen collection was approved by our Institutional Review Board. Genomic DNA was prepared from these cells using a QIAamp DNA mini kit (QIAGEN). For the preparation of control DNA targets, a blood DNA sample was treated with M. SssI methyltransferase (New England Biolabs) that methylates cytosine residues within all CpG dinucleotides in vitro.
Bisulfite Nucleotide Sequencing
Bisulfite modification of DNA samples was performed using the CpGenome DNA modification kit (Intergen). The modified DNA was used immediately or stored at −20°C for further analyses. Nested PCR was used to amplify a region within the ERα CpG island (nucleotides 267–640; GenBank accession no. X03635.1 G1:31233). Amplification conditions were similar to those described previously (Pieper et al. 1999), except that a gradient PCR approach was used. The following outer ER primers were used for the first round: 5′-ATGGTTTTATTG TATTAGATTTAAGGGAAT (ER primer1, nucleotides 267–296) and 5′-TATAACICTAAACTCITTCTCCAAATAATA (ER primer 2, nucleotides 611–640, I, inosine), and the following inner ER primers were used for the second round: 5′-AGTGTATTT GGATAGTAGTAAG (ER primer3, nucleotides 355–376). 5′-CTAACCITAAAACTACAAAAAAAA (ER primer4, nucelotides 587–610). Amplification conditions were as follows: 95°C for 10 min; followed by 35 cycles of 92°C for 1 min, a 0.3°C/sec ramp to 56°C for 3 min, a 0.5°C/sec ramp to 72°C, 72°C for 1 min, and ended with an extension of 72°C for 5 min and quick chill to 4°C on a PTC-100 thermocycler (MJ Research). One percent of the first-round PCR products was used for a second round of amplification under the conditions described above. PCR products were cloned using the TOPO TA cloning kit according to the manufacturer's instructions (Invitrogen). Part of the same PCR product was fluorescently labeled later for MSO microarray analysis. Plasmid DNA from 10 positive recombinant clones was isolated, and inserts were sequenced on an ABI PRISM 377 sequencer. The percentage of methylation levels in individual CpG sites was determined by dividing the total number of methylated sites at that locus with the number of clones analyzed and multiplying by 100.
MSO Microarray
Six sets of paired oligonucleotides (19–23 nucleotides in length) were designed to include two to four CpG sites of the ERα CpG island to be interrogated (Fig. 2B). These oligonucleotides were specific to the bisulfite-modified sequence of a portion of the ERα CpG island. Each was synthesized with an amino-linked C6 [NH2 (CH2)6] linker attached to its 5′ end (IDT). The oligonucleotides were suspended in 1× microspotting solution (Telechem) to a final concentration of 50 pmole/μL. Approximately 1 nL (0.05–0.1 pmole) of each oligonucleotide was printed in quadruplicate as microdots (100 μm diameter) on the superaldehyde-coated glass slides (Telechem) using a GMS 417 microarrayer (Affymetrix). The slides were washed thoroughly to remove unbound oligonucleotides following the manufacturer's protocol (Telechem) and were ready for hybridization. For target labeling, PCR products of bisulfite-treated DNA were labeled at the 3′ terminus with Cy5-dCTP (Amersham Pharmacia) by terminal transferase (New England Biolabs). The unincorporated dCTP was removed by passing the labeled target through a micro-Biospin column (Bio-Rad). The labeled product (2 μL per cm2 of glass slides with ∼4 pmole/μL of Cy5 incorporation) was resuspended in Unihybridization solution (1:4 dilution v/v; Telechem), denatured at 95°C for 5 min, and subsequently applied to a glass slide. The MSO hybridization was conducted in a moist hybridization chamber under a cover slip at 45°C for 4 h. The slide was rinsed and washed twice at room temperature with 2× SSC-0.2% SDS for a total of 15 min, followed by washing twice with 2× SSC at room temperature for 5 min, and dried by centrifugation at 500 rpm for 5 min.
Image Scanning and Data Processing
The MSO microarray slide was scanned with a GenePix 4000A scanner (Axon Instruments) at ∼600 PMT, a laser setting that preserves linearity and minimizes background. The images acquired by the scanner were analyzed with the software GenePix Pro 3.0. Each spot was defined by the positioning of a grid of circles over the array image. For each fluorescent image, the average pixel intensity within each circle was determined and a local background using mean pixel intensity was computed for each spot. Net signal was determined by subtraction of this local background from the mean average intensity for each spot. The data generated by the software was exported in a spreadsheet format and processed using Microsoft Excel. Statistical analyses were conducted using SigmaStat 2.0 software (Jandel Scientific).
MS–PCR
A portion of the patient tumor and normal bisulfide-treated DNA from the bisulfide nucleotide sequencing experiment was used as templates for MS–PCR. The following PCR primers were designed for the amplification of methylated or unmethylated DNA: methylated DNA ERα CpG#7–11 forward primer (nucleotides +31 to +55), 5′-TTTACGAGTTTAACGTC GCGGTCGT-3′; reverse primer (nucleotides +159 to +131), 5′-CTATTAAATAAAAAAAAACCCCCCAAACC-3′; unmethylated forward primer (nucleotides +25 to +55), 5′-GTTGTTT ATGAGTTTAATGTTGTGGTTGTT-3′; reverse primer (nucleotides +159 to +131), 5′-CTATTAAATAAAAAAAAACCCCCCA AACC-3′. PCR amplification were performed as follows: 95°C for 10 min; followed by 35 cycles of 94°C for 1 min, 63°C for 1 min, and 72°C for 90 sec, and ended with an extension of 72°C for 5 min and quick chill to 4°C on a PTC-100 thermocycler (MJ Research). Products amplified with both types of primers were examined on 1% agarose gel.
Acknowledgments
This work was supported by National Cancer Institute grants CA-69065 and -84701 and by U.S. Army Medical Research Command grant DAMD17-98-1-8214.
The publication costs of this article were defrayed in part by payment of page charges. This article must therefore be hereby marked “advertisement” in accordance with 18 USC section 1734 solely to indicate this fact.
Footnotes
E-MAIL huangh@health.missouri.edu; FAX (573) 884-5206.
Article published on-line before print in December 2001: Genome Res., 10.1101/gr. 202801.
Article and publication are at http://www.genome.org/cgi/doi/10.1101/gr.202801.
REFERENCES
- Ahrendt SA, Halachmi S, Chow JT, Wu L, Halachm I N, Yang SC, Wehage S, Jen J, Sidransky D. Rapid p53 sequence analysis in primary lung cancer using an oligonucleotide probe array. Proc Natl Acad Sci. 1999;96:7382–7387. doi: 10.1073/pnas.96.13.7382. [DOI] [PMC free article] [PubMed] [Google Scholar]
- Baylin SB, Herman JG, Graff JR, Vertino PM, Issa J P. Alterations in DNA methylation: A fundamental aspect of neoplasia. In: Vande Woude GF, Klein G, editors. Advances in cancer research. Vol. 72. San Diego, CA: Academic Press; 1998. pp. 141–196. [PubMed] [Google Scholar]
- Costello JF, Berger MS, Huang H-JS, Cavenee WK. Silencing of p16/CDK2 expression in human gliomas by methylation and chromatin condensation. Cancer Res. 1996;56:2405–2410. [PubMed] [Google Scholar]
- Favis R, Barany F. Mutation detection in K-ras, BRCA1, BRCA2, and p53 using PCR/LDR and a universal DNA microarray. Ann NY Acad Sci. 2000;906:39–43. doi: 10.1111/j.1749-6632.2000.tb06588.x. [DOI] [PubMed] [Google Scholar]
- Frommer M, McDonald LE, Millar DS, Collis CM, Watt F, Grigg GW, Molloy PL, Paul CL. A genomic sequencing protocol that yields a positive display of 5-methylcytosine residues in individual DNA strands. Proc Natl Acad Sci. 1992;89:1827–1831. doi: 10.1073/pnas.89.5.1827. [DOI] [PMC free article] [PubMed] [Google Scholar]
- Hacia JG. Resequencing and mutational analysis using oligonucleotide microarrays. Nat Genet. 1999;21:42–47. doi: 10.1038/4469. [DOI] [PubMed] [Google Scholar]
- Hiltunen MO, Alhonen L, Koistinaho J, Myohanen S, Paakkonen M, Marin S, Matti-Veli K, Janne J. Hypermethylation of the APC (adenomatous polyposis coli) gene promoter region in human colorectal carcinoma. Int J Cancer. 1997;70:644–648. doi: 10.1002/(sici)1097-0215(19970317)70:6<644::aid-ijc3>3.0.co;2-v. [DOI] [PubMed] [Google Scholar]
- Issa JP, Ottaviano YL, Celano P, Hamilton SR, Davidson NE, Baylin SB. Methylation of the oestrogen receptor CpG island links ageing and neoplasia in human colon. Nat Genet. 1994;7:536–540. doi: 10.1038/ng0894-536. [DOI] [PubMed] [Google Scholar]
- Jones PA, Laird PW. Cancer epigenetics comes of age. Nat Genet. 1999;21:163–167. doi: 10.1038/5947. [DOI] [PubMed] [Google Scholar]
- Kane MF, Loda M, Gaida GM, Lipman J, Mishra R, Goldman H, Jessup JM, Kolodner R. Methylation of the hMLH1 promoter correlates with lack of expression of hMLH1 in sporadic colon tumors and mismatch repair-defective human tumor cell lines. Cancer Res. 1997;57:808–811. [PubMed] [Google Scholar]
- Lapidus RG, Nass SJ, Butash KA, Parl FF, Weitzman SA, Graff JG, Herman JG, Davidson NE. Mapping of ER gene CpG island methylation-specific polymerase chain reaction. Cancer Res. 1998;58:2515–2519. [PubMed] [Google Scholar]
- Laux DE, Curran EM, Welshons WV, Lubahn DB, Huang TH-M. Hypermethylation of the Wilms' tumor suppressor gene CpG island in human breast carcinomas. Breast Cancer Res Treatment. 1999;56:35–43. doi: 10.1023/a:1006222803788. [DOI] [PubMed] [Google Scholar]
- Melki JR, Vincent PC, Clark SJ. Concurrent DNA hypermethylation of multiple genes in acute myeloid leukemia. Cancer Res. 1999;59:3730–3740. [PubMed] [Google Scholar]
- Nguyen TT, Nguyen CT, Gonzales FA, Nichols PW, Yu MC, Jones PA. Analysis of cyclin-dependent kinase inhibitor expression and methylation patterns in human prostate cancers. Prostate. 2000;43:233–242. doi: 10.1002/(sici)1097-0045(20000515)43:3<233::aid-pros10>3.0.co;2-s. [DOI] [PubMed] [Google Scholar]
- Ottaviano YL, Issa JP, Parl FF, Smith HS, Baylin SB, Davidson NE. Methylation of the estrogen receptor gene CpG island marks loss of estrogen receptor expression in human breast cancer cells. Cancer Res. 1994;54:2552–2558. [PubMed] [Google Scholar]
- Pieper RO, Lester KA, Fanton CP. Confluence-induced alterations in CpG island methylation in cultured normal human fibroblasts. Nucleic Acids Res. 1999;27:3229–3235. doi: 10.1093/nar/27.15.3229. [DOI] [PMC free article] [PubMed] [Google Scholar]
- Rice JC, Massey-Brown KS, Futscher BW. Aberrant methylation of the BRCA1 CpG island promoter is associated with decreased BRCA1 mRNA in sporadic breast cancer cells. Oncogene. 1998;17:1807–1812. doi: 10.1038/sj.onc.1202086. [DOI] [PubMed] [Google Scholar]
- Stirzaker C, Millar DS, Paul CL, Warnecke PM, Harrison J, Vincent PC, Frommer M, Clark SJ. Extensive DNA methylation spanning the Rb promoter in retinoblastoma tumors. Cancer Res. 1997;57:2229–2237. [PubMed] [Google Scholar]
- Wen WH, Bernstein L, Lescallett J, Beazer-Barclay Y, Sullivan-Halley J, White M, Press MF. Comparison of TP53 mutations identified by oligonucleotide microarray and conventional DNA sequence analysis. Cancer Res. 2000;60:2716–2722. [PubMed] [Google Scholar]


