

Abstract
Functional characterizations of thousands of gene products from many species are described in the published literature. These discussions are extremely valuable for characterizing the functions not only of these gene products, but also of their homologs in other organisms. The Gene Ontology (GO) is an effort to create a controlled terminology for labeling gene functions in a more precise, reliable, computer-readable manner. Currently, the best annotations of gene function with the GO are performed by highly trained biologists who read the literature and select appropriate codes. In this study, we explored the possibility that statistical natural language processing techniques can be used to assign GO codes. We compared three document classification methods (maximum entropy modeling, naïve Bayes classification, and nearest-neighbor classification) to the problem of associating a set of GO codes (for biological process) to literature abstracts and thus to the genes associated with the abstracts. We showed that maximum entropy modeling outperforms the other methods and achieves an accuracy of 72% when ascertaining the function discussed within an abstract. The maximum entropy method provides confidence measures that correlate well with performance. We conclude that statistical methods may be used to assign GO codes and may be useful for the difficult task of reassignment as terminology standards evolve over time.
The remarkably rapid emergence of high-throughput methods for acquiring information about sequences and function of genes provides a wealth of valuable new data. These methods include high-throughput gene expression measurement (Schena et al. 1995; Chee et al. 1996), yeast two-hybrid screens (Uetz et al. 2000), genome sequencing (Cole et al. 1998; Adams et al. 2000), randomized gene disruption (Ross-Macdonald et al. 1999; Tissier et al. 1999; Winzeler et al. 1999), single nucleotide polymorphism detection (Cargill et al. 1999; Halushka et al. 1999), and bulk biochemical functional assays (Martzen et al. 1999). Efficient interpretation of these data is challenging because the number and diversity of genes exceed the ability of any single investigator to track the complex relationships established by the data sets.
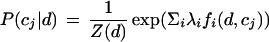
To provide some standards for describing gene function, investigators have developed controlled vocabularies for annotation. The vocabularies include a pioneering classification for Escherichia coli gene function (Riley 1993), the Munich Information Center for Protein Sequences (MIPS) classification (Mewes et al. 2000), and Gene Ontology (GO) Consortium's recent widespread effort across multiple organisms (Ashburner et al. 2000). These vocabularies contain a set of codes associated with specific genetic attributes and functions. The GO is a hierarchically arranged set of codes that permits multiple inheritance; it is organized into three broad components: molecular function, cellular location, and biological process (see Fig. 1). The vocabulary is fluid and consistently undergoes revision.
Figure 1.

The gene ontology. The gene ontology is divided into three major parts: biological process, cellular component, and molecular function. In this study we worked with gene functions within the biological process subtree. We focused on children of cell communication and cell growth and maintenance.
Unfortunately, annotating genes with these controlled vocabulary codes is a labor-intensive task. An expert inspects the literature (and, in principle, other available data) associated with each gene to determine the appropriate function code. It is likely that one-time annotation will not be sufficient; as our knowledge of biology increases and expands into new areas, the vocabularies will undergo refinement and coding may need to be repeated.
The emergence of powerful methods for analyzing text raises the possibility that gene annotation can be facilitated using natural language processing (NLP) techniques. Investigators have annotated genes with informative keywords (Andrade and Valencia 1997; Shatkay et al. 2000) and sought out specific relationships within text, such as macromolecular interactions (Hishiki et al. 1998; Craven and Kumlien 1999; Ng and Wong 1999; Proux et al. 2000; Thomas et al. 2000; Stephens et al. 2001). Some work has focused on the assignment of predefined codes to genes. Eisenhaber and Bork (1999) developed a rule-based system to identify protein localization from SWISS-PROT records. Tamames et al. (1998) developed a system to assign three broad terms—Energy, Communication, and Information—to genes from database annotations.
In this study we developed a method to assign GO codes to genes using statistical NLP techniques. We built a document classifier based on the maximum entropy principle to associate abstracts with GO codes. Then we annotated each gene by combining the GO code classifications from all of their abstracts using a weighted voting scheme. Such a method should reduce the time and labor necessary for gene annotation.
The NLP techniques we employed fall under the heading of supervised machine learning (Manning and Schutze 1999); the text in the unclassified abstract is compared to training examples that have been previously identified as relevant to specific GO codes. The unclassified text is assigned to categories based on similarities with the training examples. Ideally, experts should compile the requisite training examples. However, this is a labor-intensive task. To expedite the process for the purposes of this study we used human-assigned MeSH major headings (Hutchinson 1998). Some GO codes correspond well to specific headings; for other codes we devised ad hoc queries. In general, reliable human annotations will not be available in analyzing text, thus highlighting the need for a general purpose method that relies solely on the unannotated text.
Maximum entropy modeling is effective in generic text classification tasks (Ratnaparkhi 1997; Manning and Schutze 1999; Nigam et al. 1999). Models that classify documents can be characterized by their entropy. Low entropy models depend on making many distinctions when classifying documents and can suffer from overinterpretation of the training data. High entropy models make fewer distinctions but do not take full advantage of the signal within the training data. Maximum entropy methods are based on the assumption that the best models are those with the highest entropy that are still consistent with the training data.
One advantage of maximum entropy classification is that in addition to assigning a classification, it provides a probability of each assignment being correct. These probabilities can be helpful in combining multiple gene annotation predictions. If they are reliable measures of prediction confidence, they can be leveraged in a voting scheme; the influence of low confidence predictions can be mitigated when combined with other high confidence predictions.
We conducted experiments to annotate Saccharomyces cerevisiae genes with codes from a subset of GO. We chose this organism because many of its genes have manually curated GO annotations that can be used as a gold standard. We used two gene-document sets for testing. One set was a high quality list of PubMed citations hand-annotated by the curators of the Saccharomyces Genome Database (SGD; Cherry et al. 1998). The other set consisted of literature associated with sequence homologs of yeast genes.
We employed two types of performance measures in this study. To evaluate document classification, we used accuracy; to evaluate gene annotation, we used precision and recall. Accuracy is the percentage of predictions on a document test set for which the classifier prediction was correct. True positives are the genes that truly have the function and were correctly assigned the annotation. Precision is the percentage of annotated genes that are true positives. Recall is the percentage of genes that truly have the function that are true positives; recall is equivalent to sensitivity.
In this study we (1) evaluated the performance of document classifiers to obtain genetic functions and (2) evaluated gene annotation from literature. Because the crux of our annotation strategy is a document classifier, we compared its accuracy against two other types of classifiers. After establishing the effectiveness of a maximum entropy classifier, we evaluated the classifier's probabilistic estimates as robust confidence estimates of prediction. Finally we used a voting scheme to combine document classifications into gene annotations. We estimated precision and recall to evaluate gene annotations in yeast. Because our classifications of documents have reliable confidence estimates, our annotations of genes should also. As we choose higher confidence cutoff values, we can often achieve better precision because we are more certain of the predictions we make but at the cost of lower recall because we likely miss low confidence correct annotations.
RESULTS
Construction of the Training and Test Corpora
We constructed training and test corpora of documents for the 21 GO codes by searching PubMed for each code's corresponding MeSH heading and title words (see Fig. 1). The queries and the number of abstracts per GO code are listed in Table 1A. We split the results into three sets based on publication date; documents published before 2000 constituted the training set, documents published in 2000 constituted the test2000 set, and documents published in 2001 constituted the test2001 set. A few of the documents are relevant to more than one GO code (see Table 1B). Table 2 lists the properties of the two data sets of abstracts associated with S. cerevisiae genes.
Table 1.
The Training and Testing Corpus
| Category | GO code | Training | Test 2000 | Test 2001 | PubMed query |
|---|---|---|---|---|---|
| Autophagy | GO:0006914 | 177 | 22 | 1 | (autophagy [TI] OR autophagocytosis [MAJR]) AND (Proteins) [MH] OR Genes [MH]) AND 1940:1999 [DP] |
| Biogenesis | GO:0016043 | 1023 | 132 | 4 | (biogenesis [TI] OR ((cell wall [MAJR] OR cell membrane structures [MAJR] OR cytoplasmic structures [MAJR]) AND (organization [TI] OR arrangement [TI]))) AND (Genetics [MH]) AND 1984:1999 [DP] |
| Cell adhesion | GO:0007155 | 1025 | 133 | 5 | (cell adjesion [MAJR]) AND (genetics [MH]) AND 1993:1999 [DP] |
| Cell cycle | GO:0007049 | 1085 | 303 | 19 | (cell cycle [MAJR]) AND Genes [MH] AND 1996:1999 [DP] |
| Cell death | GO:0008219 | 1154 | 434 | 28 | (cell death [MAJR]) AND Genes [MH] AND 1997:1999 [DP] |
| Cell fusion | GO:0006947 | 740 | 20 | 0 | (cell fusion [MAJR] OR (mating [TI] AND Saccharomyces Cerevisiae [MAJR]) AND (Genetics [MH]) AND 1940:1999 [DP] |
| Cell motility | GO:0006928 | 1094 | 269 | 23 | (cell movement [MAJR]) AND (Genetics [MH]) AND 1995:1999 [DP] |
| Cell proliferation | GO:0008283 | 394 | 0 | 0 | (cell proliferation [TI]) AND (Genes [MH]) AND 1940:1999 [DP] |
| Cell–cell signaling | GO:0007267 | 237 | 41 | 0 | (synaptic transmission [MAJR] OR synapses [MAJR] OR gap junctions [MAJR]) AND (Genes [MH]) AND 1940:1999 [DP] |
| Chemimechanical coupling | GO:0006943 | 1011 | 147 | 6 | (contractile proteins [MAJR] OR kinesins [MAJR]) AND (Genes [MH]) AND 1993:1999 [DP]| |
| Intracellular protein traffic | GO:0006886 | 1107 | 322 | 28 | (endocytosis [MAJR] OR exocytosis [MAJR] OR transport vesicles [MAJR] OR protein transport [MAJR] OR nucleocytoplasmic [TI] AND (Genetics [MH]) AND 1994:1999 [DP] |
| Invasive growth | GO:0007125 | 492 | 52 | 4 | ((invasive [TI] AND growth [TI]) OR neoplasm invasiveness [MAJR]) AND (Genetics [MH]) AND 1940:1999 [DP] |
| Ion homeostasis | CO:0006873 | 424 | 64 | 5 | ((na [TI] OR k [TI] OR ion [TI] OR calcium [TI] OR sodium [TI] OR hydrogen [TI] OR potassium [TI] OR pH[TI] OR water [TI] AND (concentration [TI] OR senses [TI] OR sensing [TI] OR homeostasis [TI] OR homeostasis [MAJR]) AND (genetics [MH]) AND 1940:1999 [DP] |
| Meiosis | GO:0007126 | 1003 | 151 | 7 | ((meiosis {MAJR])) AND (Genes [MH] OR Proteins [MH]) AND 1986:1999 [DP] |
| Membrane fusion | GO:0006944 | 317 | 58 | 4 | (membrane fusion [MAJR]) AND (Genetics [MH]) AND 1940:1999 [DP] |
| Metabolism | GO:0008152 | 1005 | 225 | 30 | (metabolism [MAJR]) AND Genes [MH] AND 1989:1999 [DP] |
| Oncogenesis | GO:0007048 | 1043 | 168 | 15 | (cell transformation, neoplastic [MAJR] AND Genes [MH] AND 1994:1999 [DP] |
| Signal transduction | GO:0007165 | 1168 | 302 | 25 | (signal transduction [MAJR]) AND Genes [MH] AND 1995:1999 [DP] |
| Sporulation | GO:0007151 | 847 | 49 | 0 | (sporulation [TI] AND (genetics [MH]) AND 1940:1999 [DP] |
| Stress response | GO:0006950 | 1068 | 253 | 22 | (Wounds [MAJR] OR DNA repair [MAJR] OR DNA Damage [MAJR] OR Heat-Shock Response [MAJR] OR stress [MAJR] OR starvation [TI] OR soxR [TI] OR (oxidation-reduction [MAJR] NOT Electron-Transport [MAJR])) AND (Genes [MH]) AND 1996:1999 [DP] |
| Transport | GO:0006810 | 1022 | 84 | 8 | (biological transport [MAJR] OR transport [TI]) AND (Genes [MH]) AND 1985:1999 [DP] |
This table lists the category name in the first column, the corresponding gene ontology code in the second column, and the PubMed query used to obtain abstracts in the final column. For the training dataset, the articles were obtained by using the query as listed in the table. Within a PubMed query the [MAJR] label specifies MeSH major headings, [MH] specified MeSH headings, [TI] specifies title words, and [DP] species publication data ranges. The test2000 and test2001 datasets were obtained by modification of the publication date limit to restrict articles to those published in 2000 and 2001, respectively. Titles were omitted from the test data sets. The table lists the number of articles obtained for each category for the training and test sets.
Table 2.
Description of Articles Associated with Genes
| Article set | Unique articles | Genes with aticles | Articles/Gene | |
|---|---|---|---|---|
| mean | median | |||
| SGD-curated articles | 20101 | 4205 | 12.0951 | 4 |
| BLAST-obtained articles | 23496 | 3160 | 58.7316 | 16 |
Articles were associated with genes via two mechanisms. In one dataset articles were associated with genes manually by experts (SGD-curated articles); in the other dataset, articles were associated with genes by collecting references from similar non-yeast protein sequences obtained by BLAST search (BLAST-obtained articles). The second column lists the number of unique articles in each dataset; the third lists the number of genes with one or more article. The fourth and fifth columns describe the mean and median number of articles associated with each gene.
Comparing Document Classification Algorithms
We compared the classification accuracy of two different classifier families,—naïve Bayes and nearest-neighbor—to maximum entropy classification. We also examined different parameter settings for each of the classifiers, such as vocabulary size. We trained each classifier on the training set described above and fit their parameters by maximizing performance on the test2000 data set. The results of the classification trials on the test2000 data set are summarized in Table 3A. An ideal classifier would obtain 100% accuracy.
For maximum entropy classification trials, we reported the highest accuracy over the 200 generalized iterative scaling (GIS) iterations for different vocabulary sizes. Based on these results, we chose to stop at iteration 186 with 100 words/code for maximum entropy classification. Although 500 words/code perform slightly better, it is less robust than 100 words. Either doubling to 200 words or splitting to 50 words does not significantly affect performance; however, going from 500 to 750 words degrades the performance on the test2000 set by more than a full percent. The best performance for naïve Bayes is with a vocabulary of 500 words; the best performance for nearest-neighbor is with 50 neighbors and 5000 words.
Table 3B lists the performance of each of the classifiers on the smaller held out test2001 data set after parameter optimization on the test2000 data set. Maximum entropy has the best performance (72.12% accuracy) compared to nearest-neighbor (61.54%) and naïve Bayes (59.62%). Results of maximum entropy classification for individual categories are reported in Table 4.
Table 4.
Document Classification Accuracy for Different Categories for Test 2000 with Maximum Entropy Classification
| Category | Number | Exact match | Partial match |
|---|---|---|---|
| Autophagy | 22 | 59.09% | 68.18% |
| Biogenesis | 132 | 58.33% | 61.36% |
| Cell_adhesion | 133 | 66.17% | 70.68% |
| Cell_cycle | 303 | 45.87% | 68.65% |
| Cell_death | 434 | 75.81% | 79.72% |
| Cell_fusion | 20 | 65.00% | 75.00% |
| Cell_motility | 269 | 71.38% | 74.35% |
| Cell_proliferation | 0 | – | – |
| Cell-cell_signaling | 41 | 73.17% | 92.68% |
| Chemi-mechanical_coupling | 147 | 79.59% | 82.31% |
| Intracellular_protein_traffic | 322 | 68.63% | 72.67% |
| Invasive_growth | 52 | 69.23% | 71.15% |
| Ion_homeostasis | 64 | 79.69% | 81.25% |
| Meiosis | 151 | 77.48% | 82.78% |
| Membrane_fusion | 58 | 48.28% | 53.45% |
| Metabolism | 225 | 67.56% | 74.22% |
| Oncogenesis | 168 | 63.10% | 70.83% |
| Signal_transduction | 302 | 59.93% | 67.55% |
| Sporulation | 49 | 73.47% | 81.63% |
| Stress_response | 253 | 64.82% | 73.52% |
| Transport | 84 | 60.71% | 70.24% |
For each code listed in the first column we list the number of articles for which that code is relevant in the second column. The “Exact Match” column lists the percentage of articles for which the classifier predicts the code listed. Because some abstracts have multiple correct codes, the “Partial Match” column lists the percentage of articles for which the classifier assigned any correct code to the article, even if its is not the listed code.
Assigned Maximum Entropy Probabilities Can Be Used to Rank Predictions
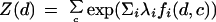
In this study we established that although the document classifier may misclassify a document, the correct class is almost always assigned a high probability and is contained in the top four predictions. Maximum entropy classification assigns a probability to each of the 21 codes for each abstract. A good classifier would assign the correct classification a high probability; a perfect classifier would assign the correct classification the highest probability. For abstracts in test2000 we sorted the predicted GO codes by probabilities and calculated how often the nth prediction was correct (Fig. 2). The top prediction was correct 72.8% of the time, as shown in Table 3. Predictions that were ranked greater than four rarely contained accurate predictions. The accuracy of the prediction drops off gradually with its rank.
Figure 2.

Performance on test2000 of maximum entropy classifier for ranked classifications. The maximum entropy classifier assigns for each code a probability of its relevance to the unclassified document. We ranked each code by its probability for the documents in test2000 and have calculated accuracy for each rank (light gray bars). Some of the documents in test2000 have multiple correct classifications. The articles with more than a single correct classification were removed and accuracy was recalculated for each rank (dark gray bars). Although the accuracy of the highest-rank prediction is only slightly reduced from 72.8% to 72.0%, the accuracy of the second- and third-ranked classes is somewhat more reduced from 17.7% to 13.7% and 6.2% to 4.2%, respectively.
Because some abstracts in the test sets (∼9%) have multiple relevant GO codes, we were concerned that the accuracy results were inflated by those abstracts. We eliminated the abstracts in test2000 with more than a single correct prediction and again calculated how often the nth prediction was correct (Fig. 2). The accuracy of the top prediction in this case is reduced slightly to 72.0%. The second and third predictions are somewhat less accurate. The accuracy of the predictions are not dramatically altered.
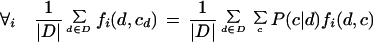
Accuracy of Prediction Tracks with Confidence Scores
To define a reliable voting scheme, it was critical to establish robust confidence estimates for correct document classification. We tested the probability of the predicted GO code as a measure of confidence for the prediction. With reliable confidence scores, we expect that document classifications with high confidence scores are likely to have been classified correctly. To assess whether the reliability of the classifier prediction tracked with the confidence score, we separated the test2000 predictions into 10 groups by confidence score. For those predictions with the highest confidence scores (ranging from .9 to 1) the classifiers prediction was correct 92.89% of the time (see Fig. 3). For predictions with lower confidence scores, the accuracy was proportionately less; the algorithm appears to estimate low confidence predictions conservatively.
Figure 3.

Confidence scores are reliable indicators of accuracy. For the test2000 data set we binned the maximum entropy predictions by confidence score, the estimated probability of the predicted code given the document, and calculated accuracy on each subset. Each data point has an x-error bar indicating the size of the bin and a 95% confidence interval on the accuracy estimate. As the confidence score increases along the x-axis, the accuracy of the prediction increases.
Predicting Gene Function from Curated Abstracts
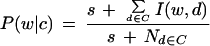
We evaluated our efforts to annotate yeast genes based on abstracts from SGD. With the voting scheme described in Methods, the maximum entropy classifier predicted gene function for the 835 genes with three or more associated abstracts and relevant true assignments from the GO Consortium. Even though many of the 21 categories we studied do not apply to yeast, we still included them in our calculations. Different thresholds of confidence can be used as a cutoff to assign an annotation to a gene. Typically, higher confidence values obtain higher precision at the cost of a lower recall. We computed the precision and recall for different confidence thresholds for each of the categories and plotted them in Figure 4. Ideally, precision remains 100% at all levels of recall. Table 5A lists the sensitivity (or recall) for each of the different GO codes.
Figure 4.

Predicting gene annotation from curated articles. Plot of precision versus recall for gene predictions from curated articles within the Saccharomyces Genome Database. Predictions were attempted on all genes with three or more associated articles; correctness of the prediction was verified with annotations from the Gene Ontology constortium. (A) Plot for categories for which predictions are reliable. (B) Plot for categories for which predictions are less accurate but still informative. (C) Plot for categories for which predictions are poor. The quality of the predictions appear to correlate with the quality of the training set.
Table 5.
Assigning Annotations to Genes from ArticlesTable 5A. Performance on Genes Using SGD: Curated Articlesa
| Category | Num | Exact match | Partial match | ||||
|---|---|---|---|---|---|---|---|
| Rank | Rank | ||||||
| 1 | 2 | 3 | 1 | 2 | 3 | ||
| Metabolism | 648 | 24.69% | 22.22% | 13.89% | 47.22% | 31.02% | 20.83% |
| Cell_cycle | 135 | 71.11% | 17.04% | 8.15% | 79.26% | 37.04% | 25.93% |
| Signal_transduction | 38 | 28.95% | 34.21% | 10.53% | 50.00% | 36.84% | 26.32% |
| Meiosis | 5 | 100.00% | 0.00% | 0.00% | 100.00% | 80.00% | 20.00% |
| Intracellular_protein_traffic | 66 | 33.33% | 39.39% | 13.64% | 60.61% | 59.09% | 43.94% |
| Sporulation | 9 | 11.11% | 0.00% | 0.00% | 66.67% | 44.44% | 55.56% |
| Cell_fusion | 27 | 55.56% | 18.52% | 14.81% | 100.00% | 59.26% | 37.04% |
| Stress_response | 26 | 11.54% | 26.92% | 23.08% | 57.69% | 46.15% | 34.62% |
| Biogenesis | 192 | 48.96% | 18.23% | 15.10% | 75.52% | 45.31% | 37.50% |
| Invasive_growth | 1 | 0.00% | 0.00% | 0.00% | 0.00% | 0.00% | 0.00% |
| Transport | 37 | 43.24% | 18.92% | 27.03% | 72.97% | 64.86% | 64.86% |
| Ion_homeostasis | 13 | 0.00% | 7.69% | 84.62% | 61.54% | 46.15% | 84.62% |
Only those genes with three or more articles were annotated.
Predicting Gene Function from SWISS-PROT Abstracts Obtained by BLAST
Similarly, we assigned functions to yeast genes based on the abstracts obtained from SWISS-PROT records of homologs found with BLAST. Table 5B describes the prediction results for all 695 genes with three or more associated abstracts and relevant GO annotations. Table 5C describes the prediction results for all 353 genes with 3 to 24 abstracts and GO annotations. We noted improved performance when considering those genes with fewer abstracts. We calculated and plotted precision and recall for the genes described in Table 5C for selected codes in Figure 5.
Figure 5.

Predicting gene annotation from BLAST-obtained articles. Plot of precision versus recall for gene predictions based on articles obtained from SWISS-PROT records of BLAST hits. Predictions were attempted on all genes with 3 or more associated articles but fewer than 25; correctness of prediction was verified with annotations from the Gene Ontology Consortium.
DISCUSSION
Document Classification Is Successful
We experimented with three different classifiers and found that maximum entropy is the most effective method, with an accuracy of 72.8%. Our findings are consistent with recent reports within the statistical natural language processing literature (Nigam et al. 1999; Rosenfeld 2000). Frequently in statistical natural language modeling tasks, there is insufficient data to estimate adequately the large number of parameters involved. Naïve Bayes compensates for this limitation by making a strong independence assumption that the words are associated with codes independent of each other (Manning and Schutze 1999). This is untrue in text classification tasks, in which many dependencies exist between words. Maximum entropy relaxes this assumption by allowing differential weights for different word–code associations, as in equations 2 and 3.
Maximum entropy assigned 72.8% of codes correctly over 21 categories. Moreover, the correct classification is present consistently in its top four choices (Fig. 2) and performance is reasonably consistent across all categories (Table 4). The performance is reproducible on the held-out test2001 data set; this indicates we did not overoptimize parameters (see Table 3B).
It should be recognized that the classification of documents is not exact; there are often ambiguities. Funk and Reid (1983) examined 760 biomedical articles that had been assigned MeSH headings by two experts. They found that the major MeSH headings, controlled vocabulary terms that represent the central concepts of the document, were assigned with only a 61.1% consistency. This study illustrates the subjective nature of document classification; the same sort of inconsistency may fundamentally limit performance on documents analyzed in our study.
Maximum Entropy Classifies Documents with Reasonable Estimates of Classification Accuracy
When classifications are imperfect, it is important that they be associated with confidence scores. The maximum entropy classifier assigns probabilities to each possible prediction. After sorting predictions by probability score, we observe that a code's prediction accuracy matches its probability rank (Fig. 2). Thus, the probability of the predicted code can be used as a measure of confidence on the prediction (see Fig. 3).
Gene Annotation Success Depends Critically on Training Set Quality
Annotation efforts of genes from the curated set of abstracts yielded uneven results. The precision–recall performance for some of the GO codes is reliable (Fig. 4A), whereas others are passable (Fig. 4B) and some are poor (Fig. 4C). At one extreme, for the code meiosis, we obtained the ideal precision–recall plot; a 100% precision was achieved at all levels of recall. In other words, all of the correct genes were annotated. Invasive growth (16.7% precision at 100% recall), sporulation (100% precision at 11.1% recall), and stress response (9.1% precision at 76.9% recall) were the three codes that were difficult to annotate genes with.
Because the classifier performs consistently across all categories when the testing and training sets were similar (Table 4), the discrepant performance is explained by how well a training set represents the biological processes. In general, the availability of a major MeSH heading corresponding to the code ensures the quality of our PubMed search-based training set. Three of the four reliably predicted codes, plotted in Figure 4A, had a single corresponding MeSH term; two of the five codes plotted in Figure 4B had a single corresponding MeSH term. Of the three codes in Figure 4C, one code—invasive growth—had only a single gene and thus a biased sample of text. For the other two codes, sporulation and stress response there were no corresponding MeSH terms for either, and ad hoc strategies were fabricated to create the article sets. These strategies may not have been effective.
An ideal training set should be constructed by experts. The National Library of Medicine relies on experts to read the articles to assign MeSH headings (Bachrach and Charen 1978). These headings are likely to have a low false-positive rate (high specificity) but may suffer from false negatives (low sensitivity) since experts assign some correct headings but may miss others. Our reliance on MeSH terms therefore assures that we get good training data when a MeSH heading corresponds directly to a GO code. However, the query strategy is limited when there are no appropriate MeSH terms. Better training sets consisting of more specific paragraphs from whole-text articles and abstracts selected under expert supervision would address many of these difficulties.
Granularity of Code May Be an Issue
In this study we chose an arbitrary level in the GO hierarchy to test. We found that although some of the categories are quite specific at this level, others, such as metabolism are quite general. For such categories, our approach would be more successful had we further broken down such large categories into smaller more specific ones.
Using BLAST to Rapidly Annotate Sequences
The strategy shown in this study has promise for whole-genome annotation. We filtered out all yeast sequences so the annotations are based only on sequences from other species. This strategy may be applied for rapid first-pass annotation of recently sequenced genes.
The limitation of this approach is that the references associated with protein sequences are often uninformative. We observed that the predictions on those genes with fewer references are actually more reliable (Table 5C) and this may be related to a diversity of language and topics associated with large sets of articles that obscure the more basic functions of a gene. As more resources such as the articles manually associated and maintained by SGD are made available, it will become possible to exploit a better set of references for sequences.
Annotation Is a Challenging Recurring Problem
Although a careful one-pass annotation is useful, it is certain that as our knowledge of biology develops, controlled vocabularies such as GO will grow and change. In fact, during this study, GO underwent considerable structural alterations. In addition, entirely new controlled vocabularies may emerge to serve the specific needs of specialized scientific communities as genomic-scale methodologies become more prevalent. For these reasons, annotation should not be considered a one-time task. We anticipate that genes will be annotated repeatedly. The key is to maintain an organized, machine-readable repository of articles for each gene so that they may be mined and annotated as necessary. This underscores the wisdom of the approach taken by SGD to maintain a set of high quality curated references (Cherry et al. 1998). We anticipate that larger corpuses of full text in the future will become available for analysis (through efforts such as PubMed Central, for example [Roberts et al. 2001]). We anticipate that the data sets will provide further useful information for extraction using techniques based on statistical and linguistic analysis.
METHODS
Functional Classifications from Gene Ontology
Our work focused on the biological process codes from the GO. Prediction of gene process from literature seemed to be most critical, as sequence signals in the gene product might be directly predictive of molecular function (Krogh et al. 1994; Huang and Brutlag 2001) and cellular localization (Horton and Nakai 1997; Emanuelsson et al. 2000). We chose gene functions that were the direct descendants of cellular maintenance and growth and cell communication, the biological process categories most relevant to single-cell organisms (see Fig. 1).
In total we used 21 gene function categories (see Table 1A). We omitted some categories due to difficulties in precisely defining the associated literature. These included cell recognition, budding, cell-size and -shape control, cell-volume regulation, pseudohyphal growth, and pH regulation. We included the response-to-external-stimulus category with the related stress-response category.
Creating Data Sets for Functional Annotation
Construction of a Training Corpus for Document Classification
We sought to create a corpus containing ⩾1000 PubMed abstracts relevant to each functional category. These comprised training sets for the classification algorithms. The best approach to this would be careful examination of many articles by qualified experts. However, obtaining a large volume of abstracts in this manner is very difficult. Instead, we used MeSH term headings and title words to query PubMed for relevant abstracts (Bachrach and Charen 1978; Hutchinson 1998). For each code we found relevant MeSH terms that were semantically similar to the code or one of its children in GO. Then we used those terms to construct a PubMed query for each GO code; most queries included specific MeSH terms as a major heading for the article and also the genes or genetics MeSH headings (see Table 1A). For many categories, such as signal transduction, a MeSH term was available; other categories required use of an appropriate combination of title words and MeSH terms. To balance the size of the training sets, we adjusted the publication date so that ∼1000 abstracts could be obtained. Also abstracts from January 1, 2000, or after were not used in training.
Test Sets to Validate Document Classification
To examine the ability of the document classification strategy, we constructed two independent test sets using the same queries as above but with later publication dates. Abstracts from the year 2000 made the test2000 test set; abstracts from 2001 made the test2001 test set. Because the titles were sometimes used to select the articles, we omitted the title from the document when testing. The test data sets are described in Table 1.
Test Sets to Simulate Genome-Scale Annotation
We created two data sets of abstracts, summarized in Table 2, associated with S. cerevisiae genes. Each gene was linked to a small set of abstracts using two strategies. The first strategy took advantage of the curated abstracts for S. cerevisiae genes maintained by the Saccharomyces Genome Database at Stanford University (courtesy of Kara Dolinski, SGD; Cherry et al. 1998). The second strategy associated abstracts to genes indirectly through homology searching. We use each translated yeast gene in a BLAST search of SWISS-PROT (Altschul et al. 1990; Bairoch and Apweiler 1999), and we took the abstracts from all nonyeast hits significant to e-value 10–6. Because they are manually chosen, the first method consists of abstracts that are more relevant to the genes. However, the second method is more representative of abstracts that would be obtained by rapid automated genome search and annotation.
Document Preprocessing
We used the abstracts and title fields from the PubMed records for all data sets except for test2000 and test2001. From these documents, we found 63,992 unique tokens by tokenizing on white space, punctuation, and common nonalphanumeric characters, such as hyphens and parentheses. From these, we excluded stopwords, which we defined as tokens that appeared in ⩽4 or ⩾10,000 documents. This left a total of 15,741 unique words. Then we represented all documents as 15,741 dimensional vectors of word counts.
Machine Learning Approaches
We compared performance of maximum entropy classification to two standard document classification approaches: naïve Bayes and nearest-neighbor algorithms. All algorithms were trained on the same training set. We optimized the parameters from the classification algorithms based on the performance on the test2000 corpus and reserved the test2001 corpus for an unbiased evaluation.
Maximum Entropy Classification
The motivation behind this classification strategy is to model training data with a probability distribution that satisfies certain constraints while remaining as close to a uniform distribution as possible. A full description of the method is outside the scope of this paper but has been provided elsewhere (Ratnaparkhi 1997; Manning and Schutze 1999).
In maximum entropy classification, the user defines category-specific features. Each feature fi (d,c) is a binary function of any document d and any class (or code) c. In this application, each feature fi is defined relative to a specific word wi and class ci. The feature fi (d,c) is unity only if d contains wi and c is ci. For example, one feature fexample might be
 |
1 |
where wexample is “cell” and cexample is ‘metabolism’.
The probability of each class for a test document is calculated with an exponential model:
 |
2 |
where c is a class, d is a document, λi's are feature weights, and Z(d) is a normalization constant:
 |
3 |
Each λi weight is selected so that the following constraint on the probability density is satisfied: the expectation of fi must equal its observed frequency in the training data. This expectation should be calculated over the true distribution of documents. However, this distribution is unknown, so we estimate the expectation for the feature empirically with the training documents D.
 |
4 |
The above is the formal definition of the constraint. Here cd is the correct classification of document d specified in the training set, and P is the probability calculated from the statistical model, and |D| is the number of instances in the training set. The left-hand side is the fraction of times fi is observed within the training data; the right-hand side is the estimate of the expectation of fi from the model.
We used the GIS algorithm to pick λis that satisfy equation 4 (Ratnaparkhi 1997). Because the GIS algorithm is subject to overfitting, we conducted 200 iterations. We picked an optimal stopping iteration among the first 200 based on performance of the parameters at each iteration on the test2000 set.
We defined the features as specific words co-occurring with a specific code. We experimented with different numbers of features per code: 10, 50, 100, 250, 500, 750, 1000, 2000, and 4000 words/code. We selected the features by choosing pairs of categories and the words most correlated to them independently based on the χ2 measure described below.
Naïve Bayes Classification
We perform naïve Bayes classification as a comparison benchmark. In naïve Bayes, the probability of each word appearing in a document of a certain class is estimated directly from the training data (Manning and Schutze 1999). For this study we calculated the conditional probability of each word given the document class
 |
5 |
In this equation, c is a specific class, d is a document within the class c, Nd∈C is the number of documents within the class c, and s is a pseudocount to compensate for unseen events. I(w,d) is an indicator function that is 1 if the word w is in the document d, 0 otherwise. Here we set s = 0.4. Once all of these probabilities are obtained, we can estimate the probability that an unknown document belongs to a class
 |
6 |
where P(c) is a prior probability estimated directly from the training data. The class c with the highest value for the unclassified document d is assigned as the classification of the document.
We experimented with different vocabulary sizes for naïve Bayes classification, including the full 15,741 words and also with reduced vocabularies of 100, 500, 1000, and 5000 words selected by χ2 criteria described below.
Nearest-Neighbor Classification
We also performed nearest-neighbor classification as a benchmark. In nearest-neighbor classification, a distance metric is employed to calculate the distance between the word vector of an unclassified abstract in the test set and each of the abstracts in the training set (Manning and Schutze 1999). We then classify the unknown article as the most prevalent category among a prespecified number of the closest training abstracts. In this study we determine distance using a cosine-based metric:
 |
7 |
where a and b are vectors of word counts. We varied the prespecified number of neighbors, trying 1, 5, 20, 50, 100, and 200 neighbors. We also experimented with different vocabularies, including the full vocabulary of 15,741 words and smaller vocabularies of 100, 500, 1000, and 5000.
Feature Selection: Choosing Words for Vocabularies
In all the above descriptions, we experimented with different vocabulary sizes. For the naïve Bayes and nearest-neighbor classifiers, we used a χ2 distribution test to identify the words whose distribution is most skewed across all 21 GO codes in the training set (Manning and Schutze 1999). We took only the words with the highest scoring χ2 values.
Because of its formulation, we used a slightly different strategy for the maximum entropy classifier. As discussed above, features were defined relative to a code and a word. We use the χ2 test to find the words that are most unevenly distributed when comparing abstracts relevant to a code to other abstracts. A word that scores high against a code is used with that code to define a feature. We took only the words with the highest scoring χ2 values.
Voting Scheme
The voting scheme takes classifications of individual abstracts associated with a gene and combines them into a single gene classification. Maximum entropy classification provides the probabilities of a document's relevance to each of the 21 codes. The ad hoc parameter fr is the expected fraction of associated abstracts that should discuss a function if it is relevant to the gene. Here we selected a value of one-third for fr in all experiments; ideally a specific fr should be selected for each function separately depending on its prevalence in the literature. If N is the number of abstracts associated with the gene, analysis of each abstract with maximum entropy classification obtains N probability values for each GO code. We averaged the top ceil(fr*N) probabilities for each code to score the code's relevance to the gene. This score ranges between 0 and 1; higher code scores indicate greater relevance to the gene. Genes with scores above a predetermined cutoff are assigned the code; the cutoffs were varied to create precision–recall plots.
Validation
Validation consisted of comparing performances on three tasks. The first, and most straightforward, is the classification of the test2000 and test2001 data set documents. The second is gene annotation based on the corpus of curated abstracts hand chosen to be descriptive of yeast genes. The final, and most indirect test, consists of gene annotation based on abstracts referenced with sequences homologous to yeast genes.
Document Classification
We applied the different document classifiers described above trained on the same training set to predict the subject matter of the documents in test2000 and test2001. Accuracy of classification was calculated for the different classifiers using different parameters. The test2000 set was used to optimize parameters; performance was measured on the test2001 set to insure that overfitting did not occur.
Annotating Yeast Genes with Curated Articles
Using the maximum entropy classifier we assigned GO codes to each gene, based on the gene's curated abstracts from SGD. We made predictions only on those genes with three or more associated abstracts. To validate our predictions, we used the annotations assigned by the GO Consortium (Ashburner et al. 2000). If an annotation was more specific than 1 in our set of 21, we mapped it back to a relevant ancestor based on the GO hierarchy. A total of 991 genes were annotated with GO codes relevant to this study by the consortium. In total, 835 genes were annotated and also had the requisite number of abstracts. We calculated the precision and recall at various thresholds for each of the annotations using the GO Consortium assignments as a gold standard.
Annotating Yeast Genes with Articles Obtained by BLAST Search
We annotated genes based on the maximum entropy classifications of the abstracts obtained by BLAST. We made predictions only on those genes with three or more abstracts. To validate our predictions we also used the annotations assigned by the Gene Ontology Consortium here. In total, 695 genes were annotated by the GO Consortium and also had the requisite number of abstracts. This procedure was repeated eliminating those genes with >24 abstracts. There were 353 such genes annotated by the GO Consortium. We calculated the precision and recall at various thresholds for each of the annotations using the GO Consortium assignments as a gold standard.
Computation
We conducted all computations on either a SUN Ultra 4 server with four 296 MHz UltraSPARC-II processors or a SUN Enterprise E3500 server with eight 400 MHz UltraSPARC-II processors. PubMed database queries and data preprocessing were implemented using perl (Schwartz and Christianson 1997), C (Kernighan and Ritchie 1988), Python (Lutz and Ascher 1999), and the biopython toolkit (www.biopython.org). All mathematical computations were performed with Matlab (Mathworks).
Table 1B.
| Corpus | No. articles with N codes | Total articles | |||
|---|---|---|---|---|---|
| 1 | 2 | 3 | 4 | ||
| Training | 15444 | 888 | 60 | 9 | 16401 |
| Test 2000 | 2682 | 231 | 27 | 1 | 2941 |
| Test 2001 | 184 | 22 | 2 | 0 | 208 |
Some of the articles within the training set were obtained in more than one of the queries; thus these articles have more than a single relevant GO classification. This table lists the number of abstracts in each data set and the number of abstracts with one, two, three, and four relevant codes.
Table 3A.
Document Classification Performance of Different Supervised Machine Learning Algorithms
| Maximum entropy | |||||||||
| No. of words/code | 10 | 50 | 100 | 250 | 500 | 750 | 1000 | 2000 | 4000 |
| Iteration | 83 | 109 | 186 | 104 | 169 | 104 | 199 | 65 | 69 |
| Accuracy | 68.62 | 72.73 | 72.8 | 72.56 | 72.83 | 71.54 | 71.44 | 69.47 | 67.66 |
| Naïve Bayes | |||||||||
| No. of words | 100 | 500 | 1000 | 5000 | All | ||||
| Accuracy | 63.89 | 66.92 | 66.88 | 65.59 | 63.79 | ||||
| Nearest neighbor | |||||||||
| Neighbors | No. of words | ||||||||
|---|---|---|---|---|---|---|---|---|---|
| 100 | 500 | 1000 | 5000 | All | |||||
| 1 | 58.04 | 54.06 | 52.84 | 53.28 | 52.19 | ||||
| 5 | 60.52 | 57.53 | 57.84 | 58.38 | 56.82 | ||||
| 20 | 59.71 | 59.91 | 60.8 | 61.88 | 61.24 | ||||
| 50 | 59.23 | 60.39 | 61.85 | 62.9 | 62.26 | ||||
| 100 | 58.76 | 60.29 | 61.41 | 62.77 | 61.54 | ||||
| 200 | 56.65 | 59.16 | 60.08 | 61.31 | 60.05 | ||||
Document classification performance for three different algorithms on the Test 2000 dataset for a series of parameters. For maximum entropy classification, we attempted different numbers of word-features/code; also we tested the accuracy at each iteration of the GIS optimization algorithm. Here we report in each column the number of words/code used, the highest accuracy obtained, and the first iteration obtaining that highest accuracy. For naïve Bayes classification, we calculated accuracy on different vocabularies. The size of the vocabulary and the accuracy is reported in each column. For nearest-neighbor classification we calculated accuracy for different numbers of neighbors and different vocabularies. The accuracy data is reported in a grid, with different numbers of neighbors for each row, and with different vocabularies for each column. The best performance achieved for each method is underlined.
Table 3B.
| Classifier | Accuracy |
|---|---|
| Maximum entropy (100 words/category) | 72.12 |
| Naïve Bayes (500 words) | 59.62 |
| Nearest neighbor (5000 words, 50 neighbors) | 61.54 |
For each classification algorithm, we fix the optimal parameters based on the data in Table 3A. The classifier is run with optimal parameters on Test 2001; the accuracy is reported in this table.
Table 5B.
Performance on Genes Using BLAST Obtained Articlesa
| Category | Num | Exact match | Partial match | ||||
|---|---|---|---|---|---|---|---|
| Rank | Rank | ||||||
| 1 | 2 | 3 | 1 | 2 | 3 | ||
| Metabolism | 557 | 33.21% | 22.44% | 14.18% | 42.73% | 28.01% | 16.52% |
| Cell_cycle | 97 | 37.11% | 21.65% | 7.22% | 54.64% | 32.99% | 16.49% |
| Signal_transduction | 36 | 41.67% | 25.00% | 8.33% | 47.22% | 27.78% | 13.89% |
| Meiosis | 1 | 0.00% | 0.00% | 0.00% | 0.00% | 0.00% | 0.00% |
| Intracellular_protein_traffic | 38 | 23.68% | 13.16% | 13.16% | 55.26% | 26.32% | 31.58% |
| Sporulation | 9 | 0.00% | 0.00% | 0.00% | 11.11% | 55.56% | 22.22% |
| Cell_fusion | 20 | 0.00% | 0.00% | 0.00% | 40.00% | 30.00% | 10.00% |
| Stress_response | 19 | 5.26% | 0.00% | 15.79% | 26.32% | 42.11% | 21.05% |
| Biogenesis | 130 | 18.46% | 13.85% | 9.23% | 46.15% | 27.69% | 20.00% |
| Invasive_growth | 0 | N/A | N/A | N/A | N/A | N/A | N/A |
| Transport | 26 | 69.23% | 7.69% | 11.54% | 76.92% | 19.23% | 30.77% |
| Ion_homeostasis | 12 | 8.23% | 0.00% | 0.00% | 25.00% | 16.67% | 8.33% |
Only those genes with three or more articles were annotated.
Table 5C.
Performance on Genes Using BLAST Obtained Articlesa
| Category | Num | Exact match | Partial match | ||||
|---|---|---|---|---|---|---|---|
| Rank | Rank | ||||||
| 1 | 2 | 3 | 1 | 2 | 3 | ||
| Metabolism | 286 | 24.48% | 15.73% | 19.58% | 32.87% | 20.98% | 21.68% |
| Cell_cycle | 47 | 40.43% | 29.79% | 4.26% | 57.45% | 31.91% | 14.89% |
| Signal_transduction | 10 | 70.00% | 20.00% | 0.00% | 70.00% | 30.00% | 0.00% |
| Meiosis | 0 | N/A | N/A | N/A | N/A | N/A | N/A |
| Intracellular_protein_traffic | 20 | 45.00% | 15.00% | 10.00% | 80.00% | 20.00% | 15.00% |
| Sporulation | 3 | 0.00% | 0.00% | 0.00% | 0.00% | 33.33% | 0.00% |
| Cell_fusion | 6 | 0.00% | 0.00% | 0.00% | 0.00% | 50.00% | 0.00% |
| Stress_response | 6 | 0.00% | 0.00% | 16.67% | 66.67% | 16.67% | 16.67% |
| Biogenesis | 60 | 21.67% | 15.00% | 10.00% | 50.00% | 28.33% | 18.33% |
| Invasive_growth | 0 | N/A | N/A | N/A | N/A | N/A | N/A |
| Transport | 12 | 66.67% | 0.00% | 16.67% | 75.00% | 25.00% | 33.33% |
| Ion_homeostasis | 6 | 16.67% | 0.00% | 0.00% | 16.67% | 16.67% | 16.67% |
Only those genes with more than three but less than twenty-five articles were annotated. For each table we list only the categories for which there was at least one gene with it as its annotation by the GO Consortium. Each row focuses on only the genes for which the category in the first column is a GO Consortium annotation. The “Num” column indicates the number of genes annotated by GO Consortium that we attempted to classify. The exact match columns are specific to a ranked prediction and list the percentage of times that the category in the first column was predicted with the rank. Partial match is similar, except we include other categories that are correct predictions for the gene in the percentage.
Acknowledgments
This work was supported by NIH LM06244 and GM61374, NSF DBI-9600637, and a grant from the Burroughs-Wellcome Foundation. S.R. was supported by NIH GM-07365, P.D.S. by NIH CA-88480, and J.T.C. by a Stanford Graduate Fellowship. We thank Mike Liang for assistance in code optimization and Kara Dolinski of SGD for a curated data set of gene-associated articles.
The publication costs of this article were defrayed in part by payment of page charges. This article must therefore be hereby marked “advertisement” in accordance with 18 USC section 1734 solely to indicate this fact.
Footnotes
E-MAIL russ.altman@stanford.edu; FAX (650) 725-7944.
Article and publication are at http://www.genome.org/cgi/doi/10.1101/gr.199701.
REFERENCES
- Adams MD, Celniker SE, Holt RA, Evans CA, Gocayne JD, Amanatides PG, Scherer SE, Li PW, Hoskins RA, Galle RF, et al. The genome sequence of Drosophila melanogaster. Science. 2000;287:2185–2195. doi: 10.1126/science.287.5461.2185. [DOI] [PubMed] [Google Scholar]
- Altschul SF, Gish W, Miller W, Myers EW, Lipman DJ. Basic local alignment search tool. J Mol Biol. 1990;215:403–410. doi: 10.1016/S0022-2836(05)80360-2. [DOI] [PubMed] [Google Scholar]
- Andrade MA, Valencia A. Automatic annotation for biological sequences by extraction of keywords from MEDLINE abstracts. Development of a prototype system. Proc Int Conf Intell Syst Mol Biol. 1997;5:25–32. [PubMed] [Google Scholar]
- Ashburner M, Ball CA, Blake JA, Botstein D, Butler H, Cherry JM, Davis AP, Dolinski K, Dwight SS, Eppig JT, et al. Gene ontology: Tool for the unification of biology. The Gene Ontology Consortium. Nat Genet. 2000;25:25–29. doi: 10.1038/75556. [DOI] [PMC free article] [PubMed] [Google Scholar]
- Bachrach CA, Charen T. Selection of MEDLINE contents, the development of its thesaurus, and the indexing process. Med Inform. 1978;3:237–254. doi: 10.3109/14639237809014183. [DOI] [PubMed] [Google Scholar]
- Bairoch A, Apweiler R. The SWISS-PROT protein sequence data bank and its supplement TrEMBL in 1999. Nucleic Acids Res. 1999;27:49–54. doi: 10.1093/nar/27.1.49. [DOI] [PMC free article] [PubMed] [Google Scholar]
- Cargill M, Altshuler D, Ireland J, Sklar P, Ardlie K, Patil N, Lane CR, Lim EP, Kalyanaraman N, Namesh J, et al. Characterization of single-nucleotide polymorphisms in coding regions of human genes. Nat Genet. 1999;22:231–238. doi: 10.1038/10290. [DOI] [PubMed] [Google Scholar]
- Chee M, Yang R, Hubbell E, Berno A, Huang XC, Stern D, Winkler J, Lockhart DJ, Morris MS, Fodor SP. Accessing genetic information with high-density DNA arrays. Science. 1996;274:610–614. doi: 10.1126/science.274.5287.610. [DOI] [PubMed] [Google Scholar]
- Cherry JM, Adler C, Ball C, Chervitz SA, Dwight SS, Hester ET, Jia Y, Juvik G, Roe T, Schroeder M, et al. SGD: Saccharomyces Genome Database. Nucleic Acids Res. 1998;26:73–79. doi: 10.1093/nar/26.1.73. [DOI] [PMC free article] [PubMed] [Google Scholar]
- Cole ST, Brosch R, Parkhill J, Garnier T, Churcher C, Harris D, Gordon SV, Eiglmeier K, Gas S, Barry CE, 3rd, et al. Deciphering the biology of Mycobacterium tuberculosis from the complete genome sequence. Nature. 1998;393:537–544. doi: 10.1038/31159. [DOI] [PubMed] [Google Scholar]
- Craven M, Kumlien J. Constructing biological knowledge bases by extracting information from text sources. Proc Int Conf Intell Syst Mol Biol. 1999;10:77–86. [PubMed] [Google Scholar]
- Eisenhaber F, Bork P. Evaluation of human-readable annotation in biomolecular sequence databases with biological rule libraries. Bioinformatics. 1999;15:528–35. doi: 10.1093/bioinformatics/15.7.528. [DOI] [PubMed] [Google Scholar]
- Emanuelsson O, Nielsen H, Brunak S, von Heijne G. Predicting subcellular localization of proteins based on their N-terminal amino acid sequence. J Mol Biol. 2000;300:1005–1016. doi: 10.1006/jmbi.2000.3903. [DOI] [PubMed] [Google Scholar]
- Funk M E, Reid CA. Indexing consistency in MEDLINE. Bull Med Libr Assoc. 1983;71:176–183. [PMC free article] [PubMed] [Google Scholar]
- Halushka MK, Fan JB, Bentley K, Hsie L, Shen N, Weder A, Cooper R, Lipshutz R, Chakavarti A. Patterns of single-nucleotide polymorphisms in candidate genes for blood-pressure homeostasis. Nat Genet. 1999;22:239–247. doi: 10.1038/10297. [DOI] [PubMed] [Google Scholar]
- Hishiki T, Collier N, Nobata C, Okazaki-Ohta T, Ogata N, Sekimizu T, Steiner R, Park HS, Tsujii J. Developing NLP Tools for Genome Informatics: An Information Extraction Perspective. Genome Inform Ser Workshop Genome Inform. 1998;9:81–90. [PubMed] [Google Scholar]
- Horton P, Nakai K. Better prediction of protein cellular localization sites with the k nearest neighbors classifier. Proc Int Conf Intell Syst Mol Biol. 1997;5:147–152. [PubMed] [Google Scholar]
- Huang JY, Brutlag DL. The EMOTIF database. Nucleic Acids Res. 2001;29:202–204. doi: 10.1093/nar/29.1.202. [DOI] [PMC free article] [PubMed] [Google Scholar]
- Hutchinson D. Medline for health professionals: How to search PubMed on the Internet. Sacramento, CA: New Wind; 1998. [Google Scholar]
- Kernighan BW, Ritchie DM. The C Programming Language, 2. Englewood Cliffs NJ: Prentice Hall; 1988. [Google Scholar]
- Krogh A, Brown M, Mian IS, Jolander K, Haussler D. Hidden Markov models in computational biology. Applications to protein modeling. J Mol Biol. 1994;235:1501–1531. doi: 10.1006/jmbi.1994.1104. [DOI] [PubMed] [Google Scholar]
- Lutz M, Ascher D. Learning Python (Help for Programmers), 1. Cambridge, UK: O'Reilly; 1999. [Google Scholar]
- Manning CM, Schutze H. Foundations of Statistical Natural Language Processing. Cambridge, MA: The MIT Press; 1999. [Google Scholar]
- Martzen MR, McCraith SM, Spinelli SL, Torres FM, Fields S, Grayhack EJ, Phizicky EM. A biochemical genomics approach for identifying genes by the activity of their products. Science. 1999;286:1153–1155. doi: 10.1126/science.286.5442.1153. [DOI] [PubMed] [Google Scholar]
- Mewes HW, Frishman D, Gruber C, Geier B, Hasse E, Kaps A, Lemcke K, Mannhaupt G, Pfeiffer F, Schuller C, et al. MIPS: A database for genomes and protein sequences. Nucleic Acids Res. 2000;28:37–40. doi: 10.1093/nar/28.1.37. [DOI] [PMC free article] [PubMed] [Google Scholar]
- Ng SK, Wong M. Toward Routine Automatic Pathway Discovery from On-line Scientific Text Abstracts. Genome Inform Ser Workshop Genome Inform. 1999;10:104–112. [PubMed] [Google Scholar]
- Nigam, K., Lafferty, J., and McCallum, A. 1999. Using maximum entropy for text classification. IJCAI-99 Workshop on Machine Learning for Information Filtering, pp. 61–67.
- Proux D, Rechenmann F, Julliard L. A pragmatic information extraction strategy for gathering data on genetic interactions. Proc Int Conf Intell Syst Mol Biol. 2000;8:279–285. [PubMed] [Google Scholar]
- Ratnaparkhi A. A simple introduction to maximum entropy models. Institute for Research in Cognitive Science, Technical Report. Philadelphia: University of Pennsylvania; 1997. pp. 97–108. [Google Scholar]
- Riley M. Functions of the gene products of Escherichia coli. Microbiol Rev. 1993;57:862–952. doi: 10.1128/mr.57.4.862-952.1993. [DOI] [PMC free article] [PubMed] [Google Scholar]
- Roberts RJ, Varmus HE, Ashburner M. Information access. Building a ‘GenBank‘ of the published literature. Science. 2001;291:2318–2319. doi: 10.1126/science.291.5512.2318b. [DOI] [PubMed] [Google Scholar]
- Rosenfeld R. Two decades of statistical language modeling: Where do we go from here? Proceedings of the IEEE. 2000;88:1270–1278. [Google Scholar]
- Ross-Macdonald P, Coelho PS, Roemer T, Agarwal S, Kumar A, Jansen R, Cheung KH, Sheehan A, Symoniatis D, Umansky L, et al. Large-scale analysis of the yeast genome by transposon tagging and gene disruption. Nature. 1999;402:413–418. doi: 10.1038/46558. [DOI] [PubMed] [Google Scholar]
- Schena M, Shalon D, Davis RW, Brown PO. Quantitative monitoring of gene expression patterns with a complementary DNA microarray. Science. 1995;270:467–470. doi: 10.1126/science.270.5235.467. [DOI] [PubMed] [Google Scholar]
- Schwartz RL, Christianson T. Learning Perl, 2. Cambridge, UK: O’Reilly; 1997. [Google Scholar]
- Shatkay H, Edwards S, Wilbur WJ, Boguski M. Genes, themes and microarrays: Using information retrieval for large-scale gene analysis. Proc Int Conf Intell Syst Mol Biol. 2000;8:317–328. [PubMed] [Google Scholar]
- Stephens M, Palakal M, Mukhopadhyay S, et al. Detecting gene relations from Medline abstracts. Pac Symp Biocomput. 2001;52:483–495. doi: 10.1142/9789814447362_0047. [DOI] [PubMed] [Google Scholar]
- Tamames J, Ouzounis C, Casari G, Raje R, Mustafa J. EUCLID: Automatic classification of proteins in functional classes by their database annotations. Bioinformatics. 1998;14:542–543. doi: 10.1093/bioinformatics/14.6.542. [DOI] [PubMed] [Google Scholar]
- Thomas J, Milward D, Ouzounis C, Pulman S, Carroh M. Automatic extraction of protein interactions from scientific abstracts. Pac Symp Biocomput. 2000;1:541–552. doi: 10.1142/9789814447331_0051. [DOI] [PubMed] [Google Scholar]
- Tissier AF, Marillonnet S, Klimyuk V, Patel K, Torres MA, Murphy G, Jones JD. Multiple independent defective suppressor-mutator transposon insertions in Arabidopsis: A tool for functional genomics. Plant Cell. 1999;11:1841–1852. doi: 10.1105/tpc.11.10.1841. [DOI] [PMC free article] [PubMed] [Google Scholar]
- Uetz P, Giot L, Cagney G, Mansfield TA, Judson RS, Knight JR, Lockshon D, Narayan V, Srinivasan M, Pochart P, et al. A comprehensive analysis of protein–protein interactions in Saccharomyces cerevisiae. Nature. 2000;403:623–627. doi: 10.1038/35001009. [DOI] [PubMed] [Google Scholar]
- Winzeler EA, Shoemaker DD, Astromoff A, Liang H, Anderson K, Andre B, Bangham R, Benito R, Boeke JD, Bussey H, et al. Functional characterization of the S. cerevisiae genome by gene deletion and parallel analysis. Science. 1999;285:901–906. doi: 10.1126/science.285.5429.901. [DOI] [PubMed] [Google Scholar]