Abstract
The human genome project is producing an enormous amount of sequence data, based on which single base changes between individuals can be identified. Unfortunately, computer tools that were adequate for sequence assembly are less than ideal for the characterization of polymorphism data [single nucleotide (snp) or insertion/deletion (indel)] and other sequence features, and their relationship to each other. We have developed viewGene as a flexible tool that takes input from a number of sequence formats and analysis programs (Genbank, FASTA, RepeatMasker, Cross match, BLAST, user-defined data) to construct a sequence reference scaffold that can be viewed through a simple graphical interface. polymorphisms generated from many sources can be added to this scaffold through the same sequence formats, with a variety of options to control what is displayed. Large amounts of polymorphism data can be organized so that patterns and haplotypes can be readily discerned. in our laboratory, viewGene has been used to view annotated genbank records, find nonrepetitive sequence fragments for polymorphism detection, and visualize similarity search results. Manipulation, cross-referencing, and haplotype viewing of snp data are essential for quality assessment and identification of variants associated with genetic disease, and viewGene provides all three of these important functions.
Several genomic viewers are now available to view assemblies of genomic sequence, including the annotation of genes, repeats, polymorphisms, and other sequence features. The Human Genome Project Working Draft (http://genome.ucsc.edu), Project Ensembl (http://www.ensembl.org), and the NCBI Map Viewer (http://www.ncbi.nlm.nih.gov) all provide graphical interpretations of genome data at the chromosome level. These sites are useful as search tools to find a feature of interest, if it exists in the public record, and visualize how it relates to other annotated features, contigs, and genetic and radiation hybrid maps. The viewers are less useful, however, to characterize a collection of variants or other features that are newly discovered in the laboratory. viewGene has been developed to provide the functionality of a genome viewer at the “local level” (generally under a megabase of sequence; the current code can handle larger sequences but at suboptimal performance). User data can be viewed in relation to the results of standard annotation software, or annotation taken from the above genome sites or other custom analysis or annotation. Data sources can be combined in viewGene and displayed in a common coordinate system for further analysis.
viewGene is being used in our laboratory to assist in several aspects of SNP detection and characterization. It has proved useful in preprocessing segments of DNA by facilitating the combination of repeat, internal duplication, and GC content data (data that can come from vastly different file formats) to discover unique DNA subsequences that can be used in sequencing and DNA chip-based techniques for SNP detection (Cutler et al. 2001). The results of SNP detection can then be added to the graphical view to help distinguish by eye those patterns that give computer algorithms difficulty. We are beginning to use viewGene to find haplotype patterns and provide a starting point to choose markers for more detailed association studies. Comparison of discovered SNPs to known differences and comparative analysis between human sequence and sequence from other organisms are made easier by the control that viewGene provides over which polymorphisms are displayed. viewGene itself does not handle the association and phylogenetic analysis, but it does provide a “filter” that can speed up the performance of this analysis on ongoing SNP generation in the laboratory.
viewGene is written in the Java programming language, which is well suited for a graphical application in our multiplatform environment. The code has been tested on Microsoft Windows, Sun Solaris, Linux, and Macintosh (OS X) computers and should run on any operating system that has access to a Java 1.2 virtual machine. The code at present is a Java application; future directions include an applet version of the code that will run through a web browser, providing another level of platform independence.
METHODS
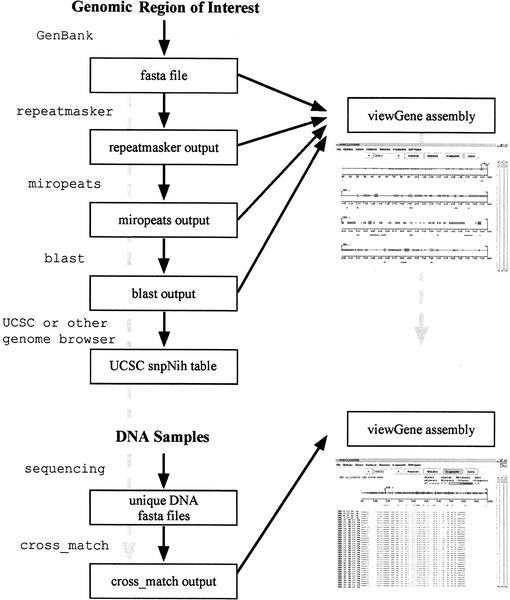
Figure 1 provides a workflow diagram for a SNP discovery project that illustrates two of the uses of viewGene. A region of interest is localized to a particular GenBank contig. The sequence data are subjected to RepeatMasker, Miropeats, and BLAST analysis. These tools all provide information about the uniqueness of areas in the contig. viewGene is used to display this information as a “map” to help decide which areas are unique and, therefore, favorable to sequencing. In addition, information on the location of SNPs that have already been found in the region, which is available on the UCSC genome site (searched by contig), is parsed with a simple routine and added to the display.
Figure 1.
Workflow diagram. Flowchart for a hypothetical SNP discovery project, with two possible uses of viewGene. A genomic reference sequence for a region of interest is processed with several sequence analysis programs (RepeatMasker, miropeats, BLAST). viewGene is being used to visualize the unique sequence and neighboring genomic features. Target areas are sequenced in a number of DNA samples, and the resulting sequences are aligned to the reference sequence. viewGene is being used again to compare the cross match results to the BLAST and UCSC data already compiled.
A number of DNA samples for the areas in question are sequenced, the result being a set of FASTA records of sequence. viewGene is not dependent on a particular method of obtaining sequence data. These FASTA records are aligned to the region of interest by a tool such as cross match. The results of the alignment are loaded into viewGene to (1) gauge the success of the sequencing, (2) compare variations found by sequencing to those already looked at from BLAST and annotation databases, and (3) compare the variation among different DNA samples, getting a qualitative look at frequencies, haplotypes, and other patterns that may demand further investigation.
This sample workflow combines aspects of several projects that viewGene is being used for in our laboratory. We have tried to make it as general and uncomplicated as possible, and we believe that new uses for its interfacing and imaging capabilities will continue to present themselves.
Visualization
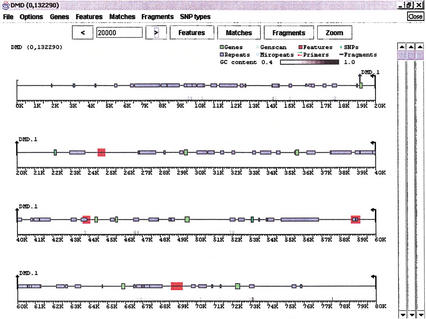
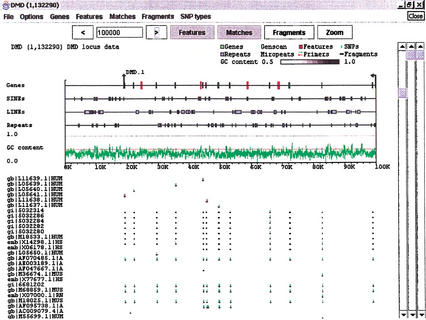
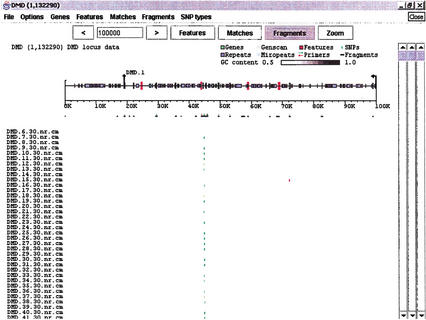
The viewGene window is divided into three separate subwindows: Features, Matches, and Fragments. A “line” of sequence contains all three components, even though there may not be data in all of them. When viewGene first opens an assembly (Fig. 2), the window is filled with as many condensed lines as can fit within it. If a subwindow is expanded via the onscreen controls (Figs. 3 and 4), the view changes to a single line that uses all of the available window space. Figure 2 shows the two different screen layouts for a viewGene session. Any view that can be generated on the screen can be saved as a JPG or GIF file, or printed. The software is able to print at a higher resolution than it can display on the screen.
Figure 2.
The Features subwindow: Data from GenBank record AL031542, containing 13 exons of the human dystrophin gene, is shown with green boxes representing the exons of “CDS” tags, blue boxes representing “repeat region” tags, and red areas defining “misc feature” tags. The user can click on any box and obtain details about the feature, control which types and classes of features are displayed, and label features. Grey bars above the scale denote areas where sequence GC content is above a threshold value (in this case,40%).
Figure 3.
Expanded Features subwindow. The dystrophin region from Fig. 2 with several additions. The Features subwindow has been expanded to separate classes of features, and to present GC content as a line graph. Sequence and exon data are still derived from the GenBank record, but the repeat information (blue boxes) has been replaced by output from RepeatMasker. Clicking on a particular repeat will bring up the corresponding data from the RepeatMasker output. Light blue areas on the Genes line denote internally repeated regions derived from Miropeats. Clicking on one of these areas will bring up the Miropeats output file and, in addition, will highlight the matching area elsewhere on the sequence. A BLAST search of the dystrophin region against the nr database has been loaded into the Matches subwindow. Dark bars denote the matching areas, and green and red tick marks identify base differences between the matched sequence and dystrophin (green for substitutions, red for indels).
Figure 4.
The Fragments subwindow. The Features and Matches subwindows have both been condensed. Cross match data from a set of individual samples that were sequenced in the dystrophin region has been added to the Fragments window. The output has been restricted to only those base changes that appear both in Matches (BLAST data) and Fragments (user data). Haplotypes and other patterns among samples can be picked out from this type of view.
The Features subwindow holds information that is general to the sequence under study. This may simply be a GenBank record, or it may include information from gene location and prediction programs such as Sim4 (Florea et al. 1998) or Genscan (Burge and Karlin 1997), or other analysis programs such as RepeatMasker (http://www.genome.washington.edu/UWGC/analysistools/repeatmask.htm) or Miropeats (Parsons 1995). Coordinating such information is critical for the preprocessing of DNA segments suitable for further SNP identification. Figure 2 shows an example of a GenBank record (containing exons of the dystrophin gene) in viewGene.
Characterization
The Matches and Fragments subwindows hold information about specific examples of the sequence under study. Information in the Matches subwindow can come from FASTA records that directly match the target sequence, BLAST searches (Altschul et al. 1990), or Cross match output (http://www.genome.washington.edu/UWGC/analysistools/swat.htm) for more complicated comparisons containing missing data or INDELs. Both of these subwindows take the same data types and, thus, are open to many different types of data comparisons. The primary use of these two windows, however, is to compare electronic data (from a BLAST comparison) with laboratory data (cross match alignments of sequence samples derived in the laboratory). The electronic and physical data can be compared and contrasted directly from the analysis files themselves. Figure 3 shows an example of BLAST data in the Matches subwindow, and Figure 4 contains BLAST-to-cross match data comparison using both Matches and Fragments. The Human Genome Project Working Draft page allows one to download the annotation databases as text files, for any chromosome and range specified. As an example of non-BLAST electronic data, viewGene can load data from the snpNih table of polymorphisms from the Working Draft site. Some preprocessing must be done to locate the region of interest in the UCSC Working Draft build and save the output to a text file, but it provides another source against which to compare laboratory data. Future versions of viewGene will further simplify the use of annotation data from the UCSC annotation database and other sources.
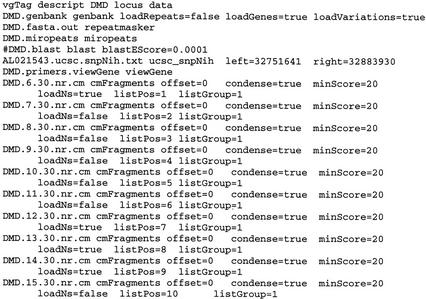
vviewGene can load data files directly one at a time, but complicated analysis is made easier through the intermediary of a viewGene assembly file. This “script” includes information about how to load each file, including starting position and minimum data quality to load. Other standard analysis program outputs will be added to future versions of viewGene, but currently the assembly file can also contain direct descriptions of features, matches, and fragments. These descriptions can be derived from unsupported file formats or analysis programs by developing simple parsing routines. A viewGene assembly file can also point to other viewGene assembly files, allowing custom information to be available over repeated experiments on a given sequence. Figure 5 contains an example of a viewGene assembly file. Detailed instructions on the construction of assembly files are included in the program documentation.
Figure 5.
viewGene assembly file. The file shown was used to generate Fig. 4. The example has been truncated; the actual file contains 96 cmFragment lines corresponding to the DNA samples used. Each type of output file has several options associated with it, including grouping of related information and controlling loading of information based on quality scores. The file DMD.primers.viewGene contains custom data items in a simple format that can be easily generated by the user from most input sources. Details on the different file types and options for viewGene assembly files, as well as several examples and scripts used for formatting, are available from the viewGene web page.
A menu of display options allows the user not only to control the size of fragments displayed, but also to fine tune exactly which base differences are displayed. For example, the user can choose to show transitions that occur in nonrepeated sequence, or ascertain whether there are any G → A changes within the exons of dystrophin. Any of these fine-tuned data can be displayed and printed at any desired scale, or output in text form for further work. The GC content graph is a special case of the Graph area of the Features subwindow, which can be configured to show other information. The number of instances of a given base or SNP type, combinations of bases and/or SNP types, and the number of instances of a given feature type can all be graphed in this window. The data used to generate the graphs can also be output as text.
Translation
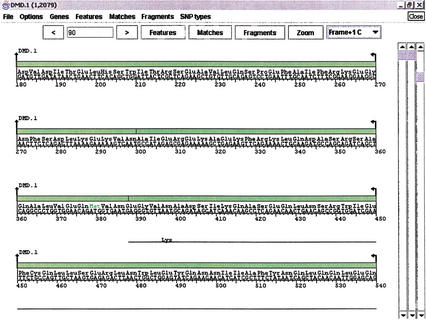
An important area of sequence analysis involves changes in those parts of a sequence that code for proteins. viewGene will splice together regions that are designated as exons, to translate them into amino acids and visualize where differences in the sequence change the translation. Figure 6 shows an example of amino acid translation. The window contains all of the same controls and subwindows as a “standard” viewGene window, but it also allows for protein translation over the six different possible reading frames.
Figure 6.
Protein polymorphisms. An area of the exons from the dystrophin region has been translated to demonstrate an amino acid change. The window contains all of the same controls and subwindows as the “parent” viewGene window (Figs. 2, 3, and 4), but it also allows for protein translation over the six possible reading frames. The figure shows that at base 397–399 in the user data, a base difference changed the amino acid from Asn to Lys.
viewGene performs a “mechanical” translation of the sequence data provided to it. Gene boundaries obtained by prediction algorithms, such as those used by Genscan, may be similar to known genes in the same location but may translate to different proteins. Care must be taken when using this feature that the intended coding sequence is being examined.
viewGene will set the translation frame to produce the largest contiguous amino acid string (from a Met codon to a Stop codon), but the user can change to any of the six possible translation frames. All of the data in the Matches and Fragments subwindows that existed within exons will be included with this new “subsequence”. Types of base changes can be shown or hidden and, in addition, amino acid changes can be shown by type (hydrophilic, hydrophobic, acidic, basic) or hidden.
Summary
viewGene is a useful tool to aid in the visualization and characterization of sequence and polymorphism data. It provides a simple, graphical interface to view and manipulate files in many standard analysis formats and flexible output options. The resulting viewGene visualizations can be printed or saved as graphic output files. Positional coordinates and sequence data are also accessible through the interface. In the laboratory, viewGene provides graphical viewing and printing of genetic sequence data, combination of data from widely different sources into a consistent form, and filtering capabilities to speed the analysis of newly discovered SNPs.
Currently, viewGene is best used on regions of up to a megabase of sequence. Assemblies that do not contain user data may be larger, depending on the resources of the host computer. The viewGene interface is being actively optimized to use larger regions and more publicly available annotation sources, most notably the Human Genome Project Working Draft databases, and other new features will be added in time.
viewGene was developed in the Java 1.2 programming language, using Metrowerks CodeWarrior and Sun Microsystems development tools. The distribution will contain a Java class archive sufficient to run viewGene in any environment that supports the Java 1.2 language, as well as the sample data set used to create the accompanying figures and other examples of assembly files and scripts for parsing common data types. Currently supported file formats are GenBank, Sim4, and Genscan genes; RepeatMasker and Miropeats similarity analysis data; FASTA, BLAST, and Cross match sequence data. The viewGene distribution is available free of charge for academic and research uses; commercial uses may require a licensing fee. The viewGene homepage at http://chakravarti.som.jhmi.edu/viewGene/viewGene.html can be consulted for more information.
WEB SITE REFERENCES
http://genome.ucsc.edu, The Human Genome Project Working Draft.
http://www.ensembl.org, Project Ensembl.
http://www.ncbi.nlm.nih.gov, NCBI Map Viewer.
Acknowledgments
This work was supported by grants NIH HG01847 and NIH MH60007. We are grateful to Michael Zwick, David Cutler, and Debra Mathews for their advice and use of the program in its various incarnations.
The publication costs of this article were defrayed in part by payment of page charges. This article must therefore be hereby marked “advertisement” in accordance with 18 USC section 1734 solely to indicate this fact.
Footnotes
E-MAIL chakravarti@jhmi.edu; FAX (410) 502-7544.
Article and publication are at http://www.genome.org/cgi/doi/10.1101/gr.211202.
REFERENCES
- Altschul SF, Gish W, Miller W, Myers EW, Lipman DJ. Basic local alignment search tool. J Mol Biol. 1990;215:403–410. doi: 10.1016/S0022-2836(05)80360-2. [DOI] [PubMed] [Google Scholar]
- Burge C, Karlin S. Prediction of complete gene structures in human genomic DNA. J Mol Biol. 1997;268:78–94. doi: 10.1006/jmbi.1997.0951. [DOI] [PubMed] [Google Scholar]
- Cutler DJ, Zwick ME, Carrasquillo MM, Yohn CT, Tobin KP, Kashuk C, Mathews DJ, Shah NA, Eichler EE, Warrington JA, Chakravarti A. High-throughput variation detection and genotyping using microarrays. Genome Res. 2001;11:1913–1925. doi: 10.1101/gr.197201. [DOI] [PMC free article] [PubMed] [Google Scholar]
- Florea L, Hartzell G, Zhang Z, Rubin GM, Miller W. A computer program for aligning a cDNA sequence with a genomic DNA sequence. Genome Res. 1998;8:967–974. doi: 10.1101/gr.8.9.967. [DOI] [PMC free article] [PubMed] [Google Scholar]
- Parsons JD. Miropeats: Graphical DNA sequence comparisons. Comput Appl Biosci. 1995;11:615–619. doi: 10.1093/bioinformatics/11.6.615. [DOI] [PubMed] [Google Scholar]


