Abstract
We present a novel web-based resource, Gene3D, of precalculated structural assignments to gene sequences and whole genomes. This resource assigns structural domains from the CATH database to whole genes and links these to their curated functional and structural annotations within the CATH domain structure database, the functional Dictionary of Homologous Superfamilies (DHS) and PDBsum. Currently Gene3D provides annotation for 36 complete genomes (two eukaryotes, six archaea, and 28 bacteria). On average, between 30% and 40% of the genes of a given genome can be structurally annotated. Matches to structural domains are found using the profile-based method (PSI-BLAST). and a novel protocol, DRange, is used to resolve conflicts in matches involving different homologous superfamilies.
A protein performs its function through the specific tertiary structure it adopts, which is a consequence of its amino acid sequence. To date, in silico biology has largely attempted to assign functions to protein sequences solely by sequence similarity to proteins in the sequence database. Many resources exist which group proteins into families [e.g., PROSITE (Hofmann et al. 1999), PRINTS (Apwieler et al. 2001b), and Pfam (Bateman et al. 2000)] and provide facilities for searching with a new sequence to determine functional properties by inheritance from a putative relative.
On a genome-wide basis, GeneQuiz (Iliopoulos et al. 2000) was one of the first resources which attempted to provide functional annotations for a complete genome, Saccharomyces cerevisiae, by assigning functions from related sequences in the sequence databases (Holm and Sander 1994). Approximately 60% of the genes could initially be annotated in this way, and for about 20% of the genes, structures could also be assigned. Among the most powerful methods currently available for assigning distantly related sequences to sequence families are the profile-based methods (e.g., PSI-BLAST; Altschul et al. 1997) and Hidden Markov models, particularly SamT (Karplus et al. 1998). Various studies (Park et al. 1998, Salamov et al. 1999) have demonstrated their sensitivity over other methods (e.g., BLAST, FASTA) for remote homolog detection. Muller et al. (1999) showed that approximately one-third of a set of very distant homologs from the SCOP database, previously identified through similarities in their structures, could be matched using PSI-BLAST. Using these techniques, GeneQuiz is currently able to assign functions for between 30% and 80% of genes in any given genome.
The Proteome database at the EBI (Apweiler et al. 2001a) also represents a wide-ranging sequence-based analysis of the genes across a wide range of complete genomes and partially completed genomes. This system attempts to assign genes to their related InterPro/CluSTr families and store all available information; they also provide a range of comparative genomics tools for their analyzed genomes.
However, in addition to inheriting functions for genome sequences, further significant benefits can be obtained by identifying the structural family to which the sequences belong. Knowledge of the structure allows the mapping of functionally important residues identified experimentally or from sequence alignments to their physical locations, thus providing important insights into functional mechanisms and the impact of single nucleotide polymorphisms (SNPs). Furthermore, because structure is much more conserved than sequence, multiple alignments generated from structural comparisons are much more accurate than those generated from sequence alone, particularly for distant homologs. Thus, multiple structure alignments and the profiles derived from them can often improve the detection of conserved residues (e.g., catalytic residues), or sites associated with function (Valdar and Thornton 2001).
Because several recent analyses have demonstrated the need to be cautious when inheriting functional information between distant homologs (<30% sequence identity; see Todd et al. 2001), structural information can often help to validate putative functions. Knowledge of the structural family allows 3D models to be built for the sequence from which active sites can be predicted (Laskowski et al. 1996; Luscombe et al. 1997) and the effects of mutations on functional properties can be assessed. Models also allow further structural studies such as docking of putative ligands and simulation of protein–protein interactions.
Considerable progress has been made in providing structural annotation for genes and whole genomes. The most powerful methodologies, which employ sequence profiles (e.g., PSI-BLAST) or fold recognition methods (e.g., GenThreader, 3D-PSSM), can provide some structural annotation for up to 50% of small microbial genomes, for example, Mycoplasma genitalium (Huynen and Bork 1998; Muller et al. 1999; Salamov et al. 1999). Profile-based methods generally assign about 40% of the proteins in M. genitalium (Muller et al. 1999), whereas threading algorithms currently provide annotations for nearly 50% of this genome (Jones 1999). Teichmann et al. (1999) give a full review of the state of the art in structure annotation of genomes.
However, most of the publicly available resources developed using these approaches simply provide links from the gene sequence to the structural relatives in the protein databank (PDB, Berman et al. 2000) with no direct information on structural family. For example, although the genome annotation resource GeneQuiz lists structural relatives for about 10% of the genes in the yeast genome, there are no direct links to structural families. Another more recently established genome resource linked to the Molecular Modeling Database (MMDB) (Wang et al. 2000) provides links from genes in genomes to proteins of known structure as a list of structural relatives for each gene. Those regions of genes which, using BLAST, can be assigned unambiguously are presented and those authors demonstrated how 3D structure can be used to inform functional predictions. Again, no information on structural family is provided.
Conversely, although many of the structural databases have now set up sequence libraries which list the sequence relatives identified for proteins of known structure, there is no direct link to the genome nor means of browsing structural assignments for other genes from the same genome. For example, Park et al. (1997) recently developed the Protein DataBank Intermediate Sequence Library (PDB-ISL), which contains sequence relatives to structural domains in the SCOP database (Lo Conte et al. 2000). Sequence libraries of this sort allow for more sensitive sequence searching when using profile-based methods such as PSI-BLAST. They extend sequence diversity in the family so that further searches identify more distant relatives as well as the initial family members.
The Superfamily database (Gough et al. 2001) uses Hidden Markov models (HMMs) to represent each family in the SCOP database. These HMMs are then used to identify sequence relatives to each SCOP family in a library of genomic sequences.
Sequence relatives have also been recruited into the CATH domain structure database using a protocol based on PSI-BLAST and a consensus approach (DomainFinder) for assigning a domain structure to a specific region of the gene sequence (Pearl et al. 2001). However, there are no direct links from the sequence back to the genome. The Gene3D resource has been set up to address that need, and to provide links between the structural annotations for genes in completed genomes. In addition, unlike other available resources (e.g., GeneQuiz, Wang et al. 2000) which often link genes to whole PDB structures, Gene3D clearly identifies the domain regions for which structural annotation can be provided.
In one of the earlier comparative genome analyses involving structural data, Gerstein (1997) used FASTA (Pearson and Lipman 1988) to assign folds and assess their distribution in different organisms. Interestingly, the data indicated that most organisms' complement of folds is highly enriched in mixed alpha/beta type folds, much more so than the current structural databases. This may reflect the tendency for enzymes to adopt predominantly alpha/beta folds. To facilitate this type of analysis, Gene3D also provides statistics on the distribution of fold groups and structural families within each genome. These data can be used to perform comparative genome analyses and determine any differential fold usage which may be associated with differences in phenotypes.
METHODS AND RESULTS
Structural assignments in Gene3D are based on the CATH domain structure classification system. This is a hierarchical system which at the lower levels groups structures and sequences together that have a common ancestor, based on structural similarity, sequence identity, and common functional features (Pearl et al. 2001). The initial assignments are made using a combination of PSI-BLAST (Altschul et al. 1997) and IMPALA (Schaffer et al. 1999). Initial processing is performed by DomainFinder (Pearl et al. 2002), an algorithm which identifies clear matches of gene sequences to protein domains in CATH, and final processing is accomplished by the genome-wide annotation method, DRange (see Methods). Using this method we have provided structural annotation for between 30– and 40% of 36 of the complete genomes in GenBank. The use of structural domains allows great confidence in the domain boundary assignments generated by PSI-BLAST; structural domains are complete domains, whereas sequence domains, which can be small (less that 50 residues), may only represent motifs and not complete structural domains. A web server has been set up to retrieve these assignment data and to provide tools for cross-genome analysis.
Gene3D is a web-based resource of structural assignments to whole genes available on the World Wide Web at http://www.biochem.ucl.ac.uk/bsm/cath_new/Gene3D.
Resource Description
Gene3D provides the biologist with structural assignments which link directly to functional and structural information maintained within the CATH database (Pearl et al. 2001), a dictionary of functional information for homologous structural superfamilies [the Dictionary of Homologous Superfamilies (DHS), Bray et al. 2000], and a resource providing derived structural and functional data with additional functional links (PDBsum, Laskowski 2001). Importantly, the DHS contains multiple structural alignments annotated in various ways, for example with PROSITE motifs indicating functionally important positions.
Unlike other resources, which simply provide listings of structural domains matched to gene regions, Gene3D employs a suite of programs (DRange) to remove conflicting assignments and provides the biologist with curated confident nonconflicting assignments for the genes in whole genomes. Each genome also has brief summary statistics presented which indicate the distribution of fold types and protein structural families. The current content of Gene3D is made up of the genes and genomes from 36 genomes (Table 1) and the associated structural assignments. This will be updated on a regular basis as new genomes are released to the public gene databanks.
Table 1.
Assignment Statistics for Each Genome
| Organism | Celeg | sacc | aero | aful | mjan | mthe | pabyssi |
| Total residues | 7687386 | 2973530 | 638684 | 662214 | 480086 | 526546 | 535767 |
| Total coverage | 780323 | 379345 | 110547 | 162470 | 104799 | 116705 | 126282 |
| Percentage covered | 10.15 | 12.76 | 17.31 | 24.53 | 21.83 | 22.16 | 23.57 |
| Remaining residues | 6907063 | 2594185 | 528137 | 499744 | 375287 | 409841 | 409485 |
| Potential extra domains | 69070.6 | 25941.9 | 5281.37 | 4997.44 | 3752.87 | 4098.41 | 4094.85 |
| Genes | 16315 | 6284 | 2694 | 2388 | 1704 | 1855 | 1764 |
| Domains assigned | 7438 | 3259 | 871 | 1388 | 875 | 986 | 1022 |
| No. of genes with assignment | 3960 | 1897 | 512 | 799 | 538 | 610 | 617 |
| Percent of genes assigned | 24.27 | 30.19 | 19.01 | 33.46 | 31.57 | 32.88 | 34.98 |
| Organism | Pyro | aquae | bbur | bsub | Cjej | cpneu | cpneuA |
| Total residues | 568465 | 482512 | 282455 | 1216011 | 508329 | 361654 | 362202 |
| Total coverage | 118997 | 124311 | 61327 | 313853 | 120715 | 72247 | 72085 |
| Percentage covered | 20.93 | 25.76 | 21.71 | 25.81 | 23.75 | 19.98 | 19.90 |
| Remaining residues | 449468 | 358201 | 221128 | 902158 | 387614 | 289407 | 290117 |
| Potential extra domains | 4494.68 | 3582.01 | 2211.28 | 9021.58 | 3876.14 | 2894.07 | 2901.17 |
| Genes | 2062 | 1522 | 825 | 4072 | 1619 | 1051 | 1067 |
| Domains assigned | 961 | 1052 | 514 | 2660 | 993 | 597 | 595 |
| No. of genes with assignment | 574 | 606 | 290 | 1493 | 588 | 335 | 333 |
| Percent of genes assigned | 27.84 | 39.82 | 35.15 | 36.67 | 36.32 | 31.87 | 31.21 |
| Organism | Ctra | dra1 | ecoli | hinf | hpyl | hpyl99 | mgen |
| Total residues | 312177 | 777034 | 1358281 | 520535 | 495345 | 493679 | 174922 |
| Total coverage | 68776 | 181767 | 341229 | 147433 | 101455 | 101180 | 42767 |
| Percentage covered | 22.03 | 23.39 | 25.12 | 28.32 | 20.48 | 20.50 | 24.45 |
| Remaining residues | 243401 | 595267 | 1017052 | 373102 | 393890 | 392499 | 132155 |
| Potential extra domains | 2434.01 | 5952.67 | 10170.5 | 3731.02 | 3938.9 | 3924.99 | 1321.55 |
| Genes | 894 | 2577 | 4266 | 1694 | 1523 | 1482 | 479 |
| Domains assigned | 581 | 1518 | 2677 | 1200 | 803 | 801 | 353 |
| No. of genes with assignment | 322 | 890 | 1597 | 683 | 473 | 475 | 196 |
| Percent of genes assigned | 36.02 | 34.54 | 37.44 | 40.32 | 31.06 | 32.05 | 40.92 |
| Organism | Mpneu | mtub | nmenA | paer | rpxx | Synecho | tmar |
| Total residues | 237564 | 1329160 | 584613 | 1859257 | 278955 | 1032549 | 580647 |
| Total coverage | 45848 | 307541 | 138067 | 458736 | 70406 | 222185 | 144015 |
| Percentage covered | 19.30 | 23.14 | 23.62 | 24.67 | 25.24 | 21.52 | 24.80 |
| Remaining residues | 191716 | 1021619 | 446546 | 1400521 | 208549 | 810364 | 436632 |
| Potential extra domains | 1917.16 | 10216.2 | 4465.46 | 14005.2 | 2085.49 | 8103.64 | 4366.32 |
| Genes | 674 | 3915 | 2026 | 5557 | 831 | 3151 | 1813 |
| Domains assigned | 369 | 2579 | 1144 | 3910 | 580 | 1893 | 1181 |
| No. of genes with assignment | 208 | 1440 | 673 | 2212 | 326 | 1112 | 675 |
| Percent of genes assigned | 30.86 | 36.78 | 33.22 | 39.81 | 39.23 | 35.29 | 37.23 |
| Organism | Tpal | uure | vcho1 | xfas | |||
| Total residues | 349767 | 227646 | 855150 | 738838 | |||
| Total coverage | 69848 | 38947 | 208440 | 164002 | |||
| Percentage covered | 19.97 | 17.11 | 24.37 | 22.20 | |||
| Remaining residues | 279919 | 188699 | 646710 | 574836 | |||
| Potential extra domains | 2799.19 | 1886.99 | 6467.1 | 5748.36 | |||
| Genes | 1007 | 609 | 2593 | 2669 | |||
| Domains assigned | 598 | 330 | 1756 | 1320 | |||
| No. of genes with assignment | 334 | 194 | 969 | 784 | |||
| Percent of genes assigned | 33.17 | 31.86 | 37.37 | 29.37 |
The first of the rows gives the total number of residues within an organism's genes available for structural assignment. The next rows give the number of residues that have a structural assignment and percentage of residues that have an assignment. To complement this the amount of residues left to annotate can provide a crude estimate of how many extra structural domains may be present. This was simply calculated by dividing the remaining residues by a typical domain length of 100 residues (Pearl et al. 2001). The next rows quote the number of genes in the organism, the number of structural domains that have been assigned, and the number of genes that have one or more structural assignments. Finally all of this is summarized as a percentage of genes that have one or more structural assignments.
celeg: Caenorhabditis elegans; sacc: Saccharomyces cerevisiae; aero: Aeropyrum pernix; aful: Archeoglobus fulgidus; mjan: Methanococcus jannaschii; mthe: Methanobacterium thermoautotrophicum; pabyssi: Pyrococcus abyssi; pyro: Pyrococcus horikoshii; aquae: Aquifex aeolicus; bbur: borrelia burgdoferi; bsub: bacillus subtillus; cjej: Campylobacter jejuni; cpneu: Chlamydia pneumonia; cpneuA: Chlamydophilia pneumoniae; ctra: Chlamydia trachomatis; dra1: Deinococcus radiodurrans; ecoli: Escherichia coli; hinf: Haemophilus influenzae; hpyl: Helicobacter pylori; hpyl99: Helicobacter pylori J99; mgen: Mycoplasma genitalium; mpneu: Mycoplasma pneumoniae; mtub: Mycobacterium tuberculosis; nmenA: Neisseria meningitidis; paer: Pseudomonas aeruginosa; rpxx: Rickettssia prowazekii; syencho: Synechocystis PCC86803; tmar: Thermotoga maritima; tpal: Treponema pallidum; uure: Ureaplasma urealyticum; vchol: Vibrio cholerae; xfas: Xylella fastidiosa.
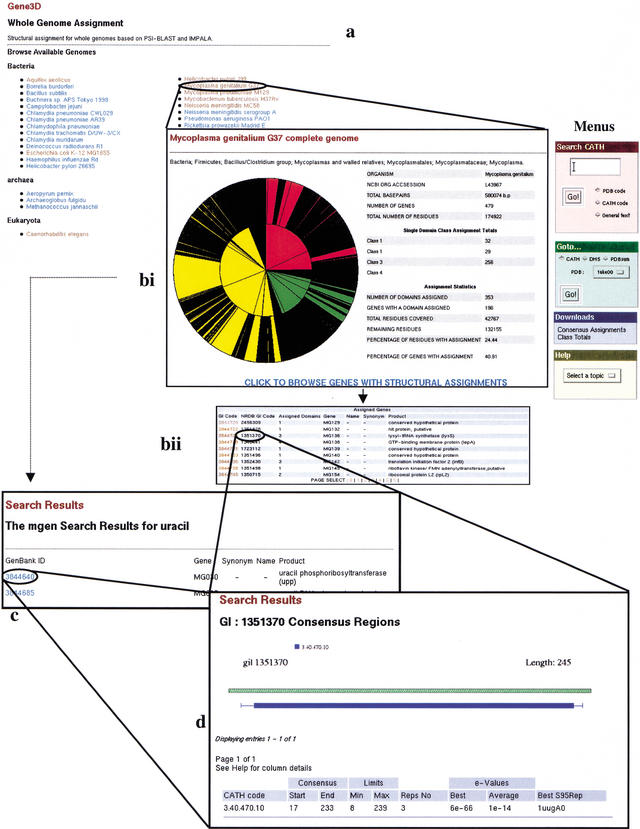
The server is made up of interlinked web pages, which allow the user to browse the structural assignments made to those complete genomes that are publicly available at the NCBI (currently 36 genomes). These consist of two components: a series of help files including a brief tutorial, and the genomic structural assignments. Access to both of these is through the main interface. Upon selecting the ‘browse genomes’ option, the user is presented with a list of the available genomes. This list is updated with new genomes upon their release, and with every update of the CATH database (Fig. 1a). Each genome has a page summarizing the assignment statistics with an available option for listing a summary of all of the structural domains assigned to the genome (Fig. 1bi). The complete domain assignment data for the whole genome are also available for download.
Figure 1.
An overview of the Gene3D server. (a) Genome Selection page. From here you can pick a genome to search. This brings up the assignment statistics page. Choosing ‘full’ also includes a summary of all the domains assigned to the genome. ‘Brief’ presents you with just the statistics. (b) Once a genome is selected, you get the statistics page. From here you can choose to search the genome using a keyword search; you can pick a gene from the list presented in the search results page (marked C). If you select a gene, you will go straight to that gene's domain assignments. (c) The Keyword search page. If you chose to search the genome using a key word (in this case, ‘uracil’), you will be presented with every gene in that genome which is associated with this key word. From here you can pick your gene of interest. (d) The assignment results page. If you chose a gene on the statistics page or on the search results page, you will be presented with the assignment results. These are presented as a diagram of the domain assignments (below the green hashed representation of the gene) and a summary of the PSI-BLAST results which led to this assignment (in the table below). From here you can link to the CATH database, the DHS, and PDBsum to gather further functional and structural information.
From each genome page, the user can elect to either choose a gene of interest (Fig. 1bi) or use the search engine to find genes of interest within their chosen genome. A list of genes with structural assignments will be returned and the user may select a specific gene (Fig. 1c). Once a gene is selected (either by searching the genome or by selecting from the initial assignment list), a diagram of the gene and the placement of domains along the gene is presented (Fig. 1d). This is accompanied by the PSI-BLAST data that matched the domain with the gene region. Importantly, this page serves as the portal that links the structural assignments to the functional data within the CATH database. On the right of this page is the menu (Fig. 1, “Menus”), which allows you to choose a structural domain within your gene and go to the appropriate entry in CATH, the DHS, or PDBsum.
CATH is a structural classification database which provides details regarding the interrelationships between differing structures and structural families (see Methods). CATH is further linked to the DHS, which provides both functional and structural information about the features common between proteins within a given superfamily in the CATH database. Recent research into enzyme superfamilies in CATH (Todd et al. 2001) has suggested that provided relatives have 40% or more sequence identity and that there is considerable similarity in function, although substrates may vary. The DHS provides information that allows the user to assess the extent to which function varies within a superfamily. PDBsum is a resource of processed and analyzed PDB files providing a wealth of structural data and links to other protein databases on the web (e.g., SWISS-PROT, KEGG, SCOP, PROCHECK). Each level of the Gene3D database presents the user with the option to download any applicable data files.
Statistics for the Genes in Whole Genomes
Basic statistics are presented for each genome (Fig. 1bi, Table 1). These give an indication of the quality and level of coverage attained for each genome. The total number of genes and the total number of residues in each genome are quoted alongside the number of domains assigned. Also calculated is the number of genes with at least one domain assigned, alongside the percentage of the organisms' genes this represents. A coverage score (i.e., the number of the total residues which are part of a domain assignment) is also presented. With the summary statistics is a pie chart showing the diversity of domains in an organism compared to the diversity of domains in the CATH structural database. The colored segments represent the four CATH classes (yellow, all-alpha domains; red, all-beta domains; green, alpha/beta domains; blue, domains with little secondary structure). The inner circle is divided so that each segment indicates a different architecture, and the outer circle is divided so that each segment represents a different fold (topology). The size of each segment indicates the proportion of the CATH structural database represented by that class, architecture, or topology. For each organism, those folds that have been assigned are left colored and those folds that have not been assigned to the organism are colored black. The pie chart gives a quick visual indication of how many of the folds present in the CATH structural database have been identified within an organism, which in turn indicates the structural diversity within an organism. Visual inspection of any two will allow rapid identification of which appears to be the most structurally diverse organism.
An example of this is the comparison of the M. genitalium genome with the genome of Caenorhabditis elegans. The pie chart for M. genitalium indicates that very few of the all-beta folds within the CATH structural database have been found in its genome. However, the pie charts for C. elegans indicate that approximately half of the all-beta folds have been identified in its genome. Inspection of the structural assignment data reveals that the superfamilies of immunoglobulin-like proteins are expanded within the C.elegans genome. C.elegans is a multicellular organism which requires complex cell–cell interaction. Many of the cell-surface functions responsible for mediation of cell–cell interactions are performed by proteins that are part of the immunoglobulin superfamilies, which are all-beta folds. M. genitalium, a single-celled organism, does not require the many forms of cell–cell interaction required by C.elegans and does not display the use of many of the superfamilies of all-beta immunoglobulin-like folds. The pie charts give an indication of some underlying biological differences between organisms which can be elucidated by close inspection of the assignment data.
Application of Gene3D in Genome Analysis
An example of the use of Gene3D to mine this information is the E.coli gene yaaF. This gene (GenBank ID:140159 or 1786213) is listed by GenBank as being a hypothetical gene and part of the hypothetical operon of unknown function, yaa. When the E.coli genome is searched for ‘hypothetical’ genes, a list of predicted genes is presented, one of which is yaaF. Selecting this gene from the list presents a diagram of the CATH homologous superfamilies that match this gene's product. A single homologous superfamily (CATH ID: 3.90.245.10) matches nearly the complete length of the gene (304 residues). The closest structural match is the only domain (domain 0) from PDB structure 1mas chain A. To get further information, 1masA0 is selected from the menu in the ‘Goto’ box; from here, the CATH database, the DHS, or PDBsum may be selected. Selecting the CATH database takes the user to its entry within the CATH database, which shows that this structure is a mixed alpha/beta domain of the ‘Inosine-uridine Nucleoside N-ribohydrolase’ fold and that the homologous superfamily is a family of hydrolases. If the DHS is selected, a page of curated functional data is presented to the user. This adds further SWISS-PROT (Bairoch and Apweiler 2000), PROSITE, and ligand data. These functional data indicate that the members of this homologous superfamily are purine nucleoside hydrolases (Enzyme Commission number: 3.2.2.1) that also possess PROSITE pattern PS01247 (Inosine uridine-preferring nucleoside hydrolase family signature). The yaaF gene product also contains this PROSITE motif, in the same position, with a cysteine-to-threonine substitution at the second position. The length and the high statistical significance of the match between yaaF and homologous superfamily 3.90.245.10 suggest that YaaF is a gene and, as a member of CATH Homologous superfamily 3.90.245.10, is a purine nucleoside hydrolase. This information could now be used to design the experiments to confirm this and discover the role of this gene within E. coli. This may also assist in the elucidation of the role of the yaa operon.
We can also use the data in Gene3D to examine the functions of homologous superfamilies that are multiply expanded within genomes or sets of genomes. Such superfamilies, it is postulated, are likely to be involved in adaptations specific to that organism/group of organisms. We have identified putatively 204 homologous superfamilies whose compliment within specific genomes has been expanded with relation to the other genomes in our set. Many of these homologous superfamilies have no known function or are labeled as putative genes by the genome sequencing projects. Where there is functional data, it can often be shown that a homologous superfamily does display a function which is specific to the organism/group of organisms. An example of which is the CATH homologous superfamily 1.10.101.10. We identified 11 homologs of this domain in Bacillus subtilis spread across nine genes (Table 2); in all cases, the best matched known structure is 1lbu01. The average prevalence of this gene across all of our organisms is 0.514 domains per organism; thus, these 11 domains represent an approximately 20-fold increase in the relative number of these domains present within the B. subtilis genome. Four of these genes have unknown functions (GenBank annotation), although three genes (ykuG, yqeE, and yvjB) do have recognized similarities with other genes. Where the genes containing these 11 domains were present in SWISS_PROT, they were all part of the N-acetylmuramoyl-L-alanine amidase family 3. A search of the literature for these genes revealed that yqeE had been experimentally determined as a sigma-K-dependent peptidoglycan hydrolase. Further inspection of the alignment of these domains shows that they all share only four common conserved residues (three glycines at positions 41, 65, and 71 and a glutamine at position 61). Glycine residues rarely take part in catalysis, so it seems likely that these residues play a structural role. The functional annotations of these proteins suggest that these genes are involved in the turnover and lysing of the bacterial cell wall in B. subtilis, and this should inform experimental design in establishing the role of three genes with an unknown function. B. subtilis is a sporulating bacterium that would have need of a series of complex cell wall/spore coat metabolizing enzymes for moving from the spore state to the vegetative state. Therefore it is possible that these domains and proteins have differing specificities and take part in different steps in cell wall or spore coat metabolism.
Table 2.
Table of the Functional Data Collected for B. subtilis
| Genbank ID | Gene ID | Gene length | E.C. number | GenBank annotation | Swissprot annotations | Literature summary |
|---|---|---|---|---|---|---|
| 2632506 | YbjG | 732 | Unknown | |||
| 2633600 | XlyB/yjpB | 317 | involved in defective prophage PBSX-mediated lysis | |||
| 2633635 | XlyA | 297 | 3.5.1.28 | major role in defective prophage PBSX-mediated lysis | a putative endolysin involved in host cell lysis | |
| 2633778 | ykuG | 760 | similar to hypothetical proteins from B. subtilis | FUNCTION: Autolysins are involved in processes such as cell separation, cell-wall turnover, transformation, formation of the flagella and sporulation. | ||
| 2634351 | ctpA/yzbD | 466 | carboxy-terminal processing protease | Has a high affinity for teichoic acid endowed peptidoglycan. | ||
| 2634711 | sleB/typeA | 305 | spore cortex-lytic enzyme | CATALYTIC ACTIVITY: Hydrolyses the link between N-acetylmuramoyl residues and L-amino acid residues in bacterial cell-wall glycopeptides. | spore cortex lytic enzyme | |
| 2635016 | yqeE | 250 | similar to N-acetylmuramoyl-L-alanine amidase | sigma-K-dependent peptidoglycan hydrolase | ||
| 2635053 | cwlA | 272 | 3.5.1.28 | cell-wall hydrolase (minor autolysin); N-acetylmuramoyl-L-alanine amidase | SIMILARITY: Belongs to the N-acetylmuramoyl-L-alanine amidase family 3. | amidase |
| 2636050 | yvjB | 480 | unknown; similar to carboxy-terminal processing protease |
Comparative Analysis of Fold Usage across the Genome
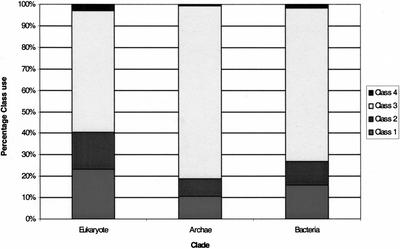
Figure 2 shows that the distribution of fold classes within the clades approximates that which can be found in the structural databases (CATH, SCOP), as reported (Gerstein 1998). All of the genomes are greatly enriched in the alpha/beta folds and as such show a depleted complement of mainly alpha and mainly beta folds in relation to the structure databases. The archaea and bacteria are depleted in all-beta folds; this is a result of not possessing the families of cell/cell signaling receptors that make wide use of the immunoglobulin-like folds. The observed depletion in mainly alpha folds may be due to underrepresentation of mainly alpha folds in the structural databases. It has been shown that 20% to 30% of a genome's proteins are likely to have a transmembrane helical domain (Wallin and von Heijne 1998; Krogh et al. 2001); such domains are greatly depleted within the structural databases.
Figure 2.
Chart of relative distribution of CATH fold classes within each clade. Class 1, All-alpha; Class 2, All-beta; Class 3, Alpha/Beta; Class 4, Few secondary structures.
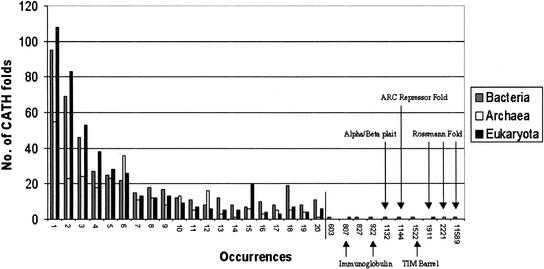
There are many folds that are only used once by any given clade, whereas there are a few folds that are multiply reused by the organisms in a given clade (Fig. 3). It is interesting to note that these top five folds have also been described as superfolds (Pearl et al. 2001) as they have been found to recur most frequently within the CATH database. They are also known as frequently occurring domains in SCOP (FODS-SCOP). These recurrent folds make up around 20% of the structural databases. That these folds are seen to be the most used by the three clades may be the result of two differing effects. The first of these is that these folds are truly the most used folds in modern organisms. On the other hand, because we have the greatest number of homologous superfamilies for these folds in the structural databases, we correspondingly have a greater number of sequence families and are better able to recognize members of these folds' sequence families within the genomes. Circularly, it seems likely that we have found so many examples of these structures because they are disproportionately more common in these organisms.
Figure 3.
The distribution of fold families and the repetition of their use as defined by the number of occurrences.
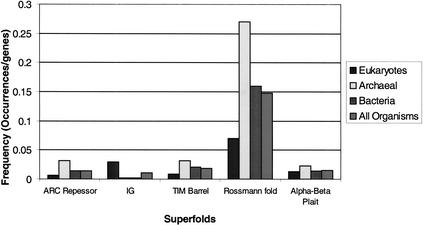
The frequency distribution of the five superfolds is shown in Figure 4. This illustrates the frequency of a given fold per gene within one of the three major kingdoms. Illustrated alongside these is the frequency of occurrence of a superfold among all of the organisms. The bacteria most closely match the frequency distribution seen across all the clades; however this is hardly surprising, because the distribution is skewed towards the bacteria as there are more bacterial genes in the set of organisms. Notable is the archaea's use of the superfolds. Many of the archaea in this set of genomes are extremophiles, and one may expect they require very stable proteins in order to survive. It is possible that superfolds are stable folds (Orengo et al. 1994), and it would follow that the archaea may make great use of them; certainly more study is required to confirm this. Another feature of this graph is that the eukaryotes make much greater use of the immunoglobulin-type folds compared to the other clades. This largely comes from the input of the genes from Caenorhabditis elegans, which is the only multicellular organism, and is a consequence of the use of such domains in cell signaling pathways.
Figure 4.
The frequency of superfold usage in the three kingdoms expressed as the number of occurrences of the fold divided by the total number of genes in the organisms used in the given kingdom. The results are presented alongside the frequency within all organisms.
DISCUSSION
Gene3D provides a resource for the biochemist and biologist alike. It can simply be used as a tool to find structural assignments for individual genes. More usefully, querying the database allows the examination of gene families of interest within an organism based on possession of common traits (e.g., common functions). Future additions to the server will include the ability to query the underlying Oracle relational database. This will include the ability to perform comparative queries, returning datasets compiled from multiple genomes. The compilation of such value-added databases represents some of the first steps required to fully integrate large quantities of data from the genomic data resources, which will aid differential genome analysis and the study of protein structure/function evolution and genome evolution. Furthermore, identification of those gene sequence families for which we can already provide accurate structural assignments can be used to aid the identification of those sequence families for which representative structures are still needed, and as such will aid today's structural genomics initiatives.
The database can be accessed via the World Wide Web (http://www.biochem.ucl.ac.uk/bsm/cath_new/Gene3D). This server allows the user to search the preprocessed assignment data for structural assignments stored for any gene in the GenBank NRDB100 list. A further part of the server allows access to the statistics for each genome and the ability to search for any gene in that organism for which DRange-processed assignments have been made. (http://www.biochem.ucl.ac.uk/bsm/cath_new/Gene3D/Genome.html). Preprepared downloads of all the NCBI's genomes can also be obtained via our ftp server (ftp://ftp.biochem.ucl.ac.uk/pub/cathdata/Gene3D/).
METHODS
Dataset Selection
A library of sequences was set up containing gene sequences from GenBank and representative sequences from the CATH database. The nonredundant database from GenBank (at 100% identity) was used (NRDB100) (Benson et al. 2000). Genomic sequence data for complete genomes is also gathered from GenBank. Only those genomes published as complete are selected, and draft genome sequences are not used.
The CATH database is a hierarchical database of protein domains split into four main levels (Class, Architecture, Topology, and Homologous superfamily). At the Class level, proteins are divided up based on their secondary structure content (Table 3). The next level, Architecture, describes the positions of the secondary structure elements in space. The third level, Topology, describes the fold of the domain and indicates how the secondary structure elements are joined together in space. Finally, the Homologous superfamily level groups those domains which have a clear evolutionary relationship. Each homologous superfamily is further subdivided into families based on sequence similarity at 35%, 60%, 95%, and 100% sequence identities.
Table 3.
Description of the Major CATH Classes
| Cath class | Description |
|---|---|
| Class 1 | all alpha helical protein domains |
| Class 2 | all beta sheet protein domains |
| Class 3 | alpha and beta protein domains |
| Class 4 | domain with few secondary structure elements |
| Class 5 | full PDB chains grouped into sequence families whose individual domains are classified within CATH classes 1–4 |
| Class 6 | single domain PDB chains that have not been classified within CATH classes 1–4 |
| Class 7 | full PDB chains grouped into sequence families whose individual domains are not classified within CATH classes 1–4 |
Classes 1–5 represent protein structures that have been fully classified within the CATH database. Classes 6 and 7 represent proteins that have been integrated into the database but have only completed the initial classification steps.
Representative structures/sequences were selected for each S95 sequence family in the CATH Protein Family Database (the CATH PFDB, where each sequence family contains members that are 95% sequence identical or higher) (Pearl et al. 2001). Each of these protein sequence families falls into one of five main categories (CATH classes 1 to 5) or one of two additional categories (CATH classes six and seven) which refer to proteins currently being integrated into the CATH classification (see Table 3).
For testing the Collapse module (see below), which resolves overlaps between the same homologous superfamilies on the same gene region, a test set of 200 nonredundant genes displaying various forms of overlapping assignments were selected and used for empirical cutoff assignment. Domains were selected because they displayed the types of overlap found in the assignment data.
Identification of Sequence Relatives to Proteins in the CATH Database Using PSI-BLAST and DomainFinder
In the first step, CATH S95reps are matched to sequences within the NRDB100 from GenBank (Pearl et al. 2001). Sequence matching is performed using PSI-BLAST, and only matches with an expectation value (E-value) of less than or equal to 5×10⁻⁴ are included in the profile for the next iteration. This parameter is recommended by Brenner et al. (1998) and validated by Pearl et al. (2002). PSI-BLAST was benchmarked to derive conservative thresholds for reliably predicting sequence domains for inclusion as input for the DomainFinder and DRange algorithms. A dataset of 1351 representative sequences (CATH S35Reps) was derived from the single-segment domains in the CATH structural domain database. These are derived from the majority of homologous superfamilies in CATH (773 families from the April 5, 2000 release of CATH). Sequences with less than 35% sequence identity to their other selected relatives were included, thus ensuring that the dataset contained only remote homologs. Remote homologs were chosen so that the performance in recognizing distant relatives could be assessed. This is necessary because homologs with sequence identities >35% are easily identified by pairwise sequence comparison methods (Pearl et al. 2001). The 1351 single-segment homologs give a total of 911,925 (1351×1,350/2) pairwise relationships (false + true). Optimally the PSI-BLAST algorithm should detect all of the true pairwise relationships within a homologous superfamily (H-family, 2478 in total) without any false positives.
PSI-BLAST was run for a range of E-values. Hits were recorded and scored when an S35Rep matched another S35Rep from the same homologous superfamily. Matches between S35Reps in different H-families with the same fold (same T-level), were not counted. The H-families in CATH are assigned very conservatively. Matches having the same fold group but differing homologous superfamilies suggest putative evolutionary relationships, for which we have no strong functional evidence. An overlap measure of 50% was also introduced, which was calculated as the percent of the query sequence that aligned with the target.
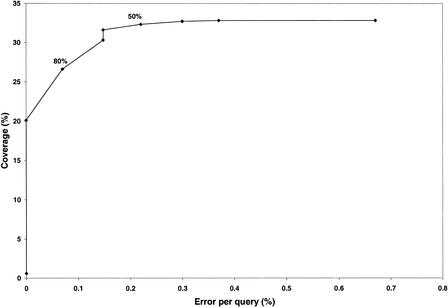
To annotate the genome for the purposes of reliable analysis, we wanted to maximize the coverage yet minimize the error rate. Figure 5 shows coverage plotted against error per query (EPQ) for differing overlap thresholds from 0% to 100% in steps of 10%. Selecting an overlap threshold of 50% with an E-value of 5.0×10⁻⁴ in a one-to-one relationship, half (50%) of the target is identified in 32% of the cases, with an EPQ of 0.22%. These values were used to recruit putative homologs using PSI-BLAST. However, this is the error rate of the raw data, and postprocessing (DomainFinder and DRange) of the data subsequent to this reduces the error rate further.
Figure 5.
Error per query (%) by Coverage (%) obtained for one-to-one relationships. The coverage is measured using the CATH-35 sequences. This graph shows the percent coverage of true positives divided by the total number of possible assignments against the numbers of errors per query. These values are plotted for the differing percentages of the query domain (Q) in the alignment.
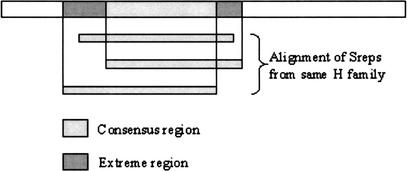
The PSI-BLAST matches are compiled into a list of CATH superfamily assignments for various regions in each gene sequence. By applying a clustering algorithm (DomainFinder, Pearl et al., (2002), S95Rep assignments for each region on the gene are converted into a consensus description. Where two S95Reps with the same CATH code are assigned to the same region of a gene, boundary data from the region where the S95Reps overlapped (the consensus region) and the regions either side, where they did not overlap, (the extremes) are recorded as illustrated in Figure 6. All downstream processing is then performed by DRange, a suite of code that attempts to resolve any clashes between two different homologous superfamilies (H Families) that have been assigned to the same gene region.
Figure 6.
Domain Finder. This illustrates the derivation of consensus and extreme regions for domain assignment.
DomainFinder's clashes may arise due to the way in which the CATH database is necessarily compiled. CATH is cautious in its assignment of homologous superfamilies. Proteins which have diverged to an extent that their sequence and/or structural similarity falls below the cutoffs used to assign homologs are placed in separate homologous superfamilies unless there is sufficient additional functional evidence to merge the families. Problems for any database of domain families arise when there is not enough functional evidence available at the time of classification. In these cases, proteins with clear structural similarity but no clear sequence similarity will be assigned to the same fold group but not the same homologous superfamily. This ensures that homologous superfamilies remain self-consistent and that they do not include evolutionarily unrelated proteins. However, when distant sequences from the same protein family are placed in different H families (due to lack of functional evidence), they may match the same region of a gene of unknown structure. It will then appear that two different H families have been assigned to the same region of a gene even though the two superfamilies may actually be evolutionarily related.
Additionally, domain clashes may also arise when the N terminus of one assigned domain overlaps with the C terminus of an adjacent assigned domain on a gene. These clashes arise because domains within homologous superfamilies may contain additional residues (extensions) at their C or N terminus. Such extensions are part of the natural variability within homologous superfamilies. When domains are aligned to genes, their extensions may extend along the gene and may overlap with adjacent domain assignments, causing a clash.
DRange: A Suite of Modules to Verify Domain Assignments
The DRange suite, described below, contains four modules for cleaning the data and resolving clashes where domains from two different homologous superfamilies have been assigned to the same region of a gene. Decisions made are based on reasonable biological criteria for determining whether the overlapping regions are evolutionarily related or whether the overlapping regions fall within a tolerable level of overlap. When overlapping, clashing assignments are found, the DRange process accepts those assignments that are from different homologous superfamilies but from the same fold group and only assigns a fold to that region of the gene. In cases where the fold is different, the assignment that has the greatest sequence evidence in support is kept (Multiparse module). Finally, where there is insufficient sequence evidence, both domains are kept if the overlap is small; otherwise, both are excluded (CleanAssign module).
Collapse Module
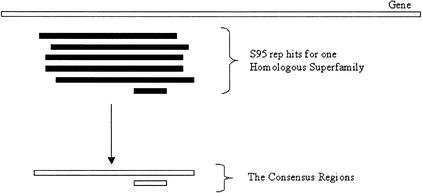
The first of the steps in DRange is a module called Collapsewhich clears up any “noise” in the data (amounting to around 3% of the assignments). The strict cutoffs in the DomainFinder algorithm can lead to an over-cautious assignment of consensus regions. This problem, illustrated in Figure 7, arises when a homologous superfamily matches a distantly related gene and does not achieve a global alignment with the gene. The DomainFinder algorithm will not merge the smaller assignment with the others, as it does not overlap to a great enough extent. Collapse looks to find consensus regions of the same homologous superfamily that overlap enough to be merged together.
Figure 7.
This figure indicates how DomainFinder's cautious assignment of consensus regions can produce consensus regions that the DRange protocol considers to be noise. In this instance, several S95 rep hits have hit a region of a gene (indicated in black). The DomainFinder algorithm has attempted to merge these into a consensus region but one of them is considered by DomainFinder to be too small to belong with the others (it has insufficient overlap with the others), and a second consensus, made from only one Srep hit, is built. For the purposes of the Gene3D resource, it is sufficient that the smaller domain is merged into the larger region.
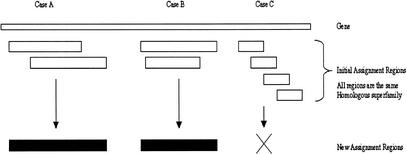
Figure 8 illustrates the three main types of same homologous superfamily overlap found. In the first two cases, merging the assigned regions is legitimate, but in the final case it would not be allowed (this would be chaining). Any two regions to be merged must overlap by at least 60%, and the extremes (see above) must not extend beyond 20% of the length of the larger domain. Chaining may occur when a gene has a repeated sequence motif. The homologous superfamily regions that are assigned to each motif may overlap; if these were merged together, they would produce a domain that was not similar to the sequence of the homologous superfamily. To avoid chaining, any resulting merged region must not be larger than 30% of the length of the largest initial domain.
Figure 8.
The Collapse module consensus assignments. Boxes, shown in white, represent consensus regions on the ‘Gene’, and the ‘New assignment’ boxes, in black, represent the possible outcomes of collapsing the initial assignments. The Collapse module seeks to allow cases A and B without allowing case C (Chaining). In case A, the two regions from the same homologous superfamily overlap to a great enough extent that they are merged together. In case B, one region is contained within another region of the same homologous superfamily and they are merged. In case C, it is clear that the top and bottom regions do not overlap, so merging of all four regions is not allowed.
Multiparse Module
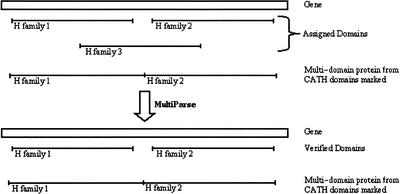
Resolving clashes between different homologous superfamilies starts with the Multiparse module. This uses the domain boundaries within CATH classified multidomain proteins to verify which domains should be accepted and which rejected when two domains from differing CATH superfamilies clash. The module does not resolve clashes where the gene will only have a single domain assigned; these are resolved by the CleanAssign module (see below). The clash of three domain assignments (labeled homologous superfamilies H1, H2, and H3) and the resolution process is illustrated in Figure 9. In the example, a gene is hit by a multidomain protein which comprises two domains belonging to homologous superfamilies H1 and H2, whose domain boundaries have already been determined. Because the multidomain sequence matches the full gene, the gene is presumed to contain the same domains as the multidomain protein from CATH. Those domain assignments that match the multidomain protein and its domain boundaries are allowed (from H families 1 and 2), and the data for the third domain assignment (H family 3) are removed from the list of consensus matches.
Figure 9.
The process of domain resolution using MultiParse. Genes are indicated as boxes and the domains as the tagged lines. The multidomain protein is labeled with the two domains identified within it. Because the multidomain represents a global hit, it is assumed that the gene has similar pattern of domains; as a result, assignments for H families 1 and 2 are kept, whereas the assignment for H family 3 is lost.
CleanAssign
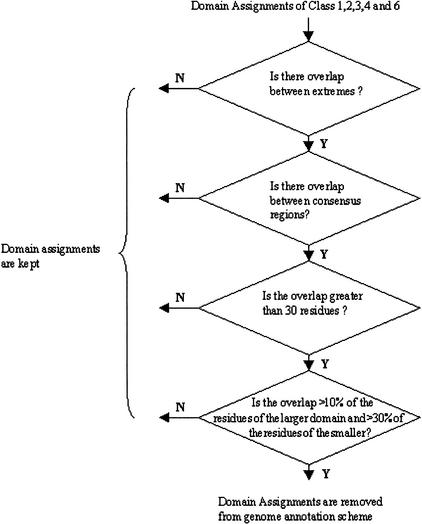
The next module (CleanAssign) combines a simple overlap detection algorithm and a simple decision tree to decide whether the overlaps represent a cross assignment (i.e., a gene region where two different CATH fold groups/homologous superfamilies have been assigned) or an acceptable overlapping of domains from different superfamilies. In the case of a cross assignment, no reliable annotation of that sequence can be made and these data are removed from the process of genome annotation. On the other hand, if two separate regions of the gene are assigned different H families but only their ends overlap, this may constitute an acceptable overlap. An acceptable overlap is either not more than 30 residues or, in the case of larger domains, not more than 10% of the residues of the largest and 30% of the residues of the smallest. Figure 10 shows the decision tree with the overlap limits. Those overlapping domains which are accepted are used for genome assignment. Where the cross hits share the same fold but belong to different homologous superfamilies, data are retained for both assignments but the assignment for that region of the gene can only be made at the fold level (although the significance of the PSI-BLAST match suggests that these proteins are homologs which were undetected at the time of classification in the CATH database)
Figure 10.
The Clean Assign Module's decision flowchart for deciding on acceptable overlaps between consensus regions with differing homologous superfamily assignments. The CATH domain assignments from domains in CATH classes 1, 2, 3, 4, and 6 (see Table 1) are analyzed by the decision tree.
Genome Annotation and the Gene3D Web Server
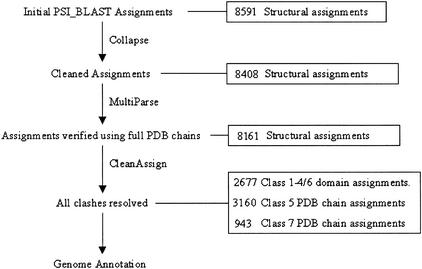
Lastly, the structurally annotated genes are matched to the genes within the whole genomes, and all assignment data and statistics are stored in the CATH Oracle database. For a genome to be eligible for inclusion in Gene3D, the sequence must be regarded as complete and not a draft sequence; this is to increase the reliability of the results but as a necessary consequence rules out many of the eukaryotic genomes currently available. Assignment statistics are generated to assess coverage and PSI-BLAST performance between each new round of annotation. Figure 11 illustrates this whole process with typical assignment figures for the Escherichia coli genome. Table 1 shows the assignment statistics for all of the genomes.
Figure 11.
The data resolution process with typical figures taken from the Genome Annotation of Escherichia coli. The final domain assignments are for all CATH classes. Classes 1–4 and 6 are the single domains classified in CATH (see Table 1). Classes 5 and 7 are full protein chains at various stages of classification.
The publication costs of this article were defrayed in part by payment of page charges. This article must therefore be hereby marked “advertisement” in accordance with 18 USC section 1734 solely to indicate this fact.
Footnotes
E-MAIL orengo@biochem.ucl.ac.uk; FAX 44-207-7679-7193.
Article and publication are at http://www.genome.org/cgi/doi/10.1101/gr.213802.
REFERENCES
- Altschul SF, Madden TL, Schaffer AA, Zhang J, Zhang Z, Miller W, Lipman DJ. Gapped BLAST and PSI-BLAST: A new generation of protein database search programs. Nucleic Acids Res. 1997;25:3389–3402. doi: 10.1093/nar/25.17.3389. [DOI] [PMC free article] [PubMed] [Google Scholar]
- Apweiler R, Attwood TK, Bairoch A, Bateman A, Birney E, Biswas M, Bucher P, Cerutti L, Corpet F, Croning MDR, et al. The InterPro database, an integrated documentation resource for protein families, domains and functional sites. Nucleic Acids Res. 2001a;29:37–40. doi: 10.1093/nar/29.1.37. [DOI] [PMC free article] [PubMed] [Google Scholar]
- Apweiler R, Biswas M, Fleischmann W, Kanapin A, Karavidopoulou Y, Kersey P, Kriventseva EV, Mittard V, Mulder N, Phan, et al. Proteome Analysis Database: Online application of InterPro and CluSTr for the functional classification of proteins in whole genomes. Nucleic Acids Res. 2001b;29:44–48. doi: 10.1093/nar/29.1.44. [DOI] [PMC free article] [PubMed] [Google Scholar]
- Bairoch A, Apweiler R. The SWISS-PROT protein sequence database and its supplement TrEMBL in 2000. Nucleic Acids Res. 2000;28:45–48. doi: 10.1093/nar/28.1.45. [DOI] [PMC free article] [PubMed] [Google Scholar]
- Bateman A, Birney E, Durbin R, Eddy SR, Howe KL, Sonnhammer EL. The Pfam Protein Families Database. Nucleic Acids Res. 2000;28l:263–266. doi: 10.1093/nar/28.1.263. [DOI] [PMC free article] [PubMed] [Google Scholar]
- Benson DA, Karsch-Mizrachi I, Lipman DJ, Ostell J, Rapp BA, Wheeler DL. GenBank. Nucleic Acids Res. 2000;28:15–18. doi: 10.1093/nar/28.1.15. [DOI] [PMC free article] [PubMed] [Google Scholar]
- Berman HM, Westbrook J, Feng Z, Gilliland G, Bhat TN, Weissig H, Shindyalov IN, Bourne PE. The Protein Data Bank. Nucleic Acids Res. 2000;28:235–242. doi: 10.1093/nar/28.1.235. [DOI] [PMC free article] [PubMed] [Google Scholar]
- Bray JE, Todd AE, Pearl FM, Thornton JM, Orengo CA. The CATH Dictionary of Homologous Superfamilies (DHS): A consensus approach for identifying distant structural homologues. Protein Eng. 2000;13:153–165. doi: 10.1093/protein/13.3.153. [DOI] [PubMed] [Google Scholar]
- Brenner SE, Chothia C, Hubbard TJ. Assessing sequence comparison methods with reliable structurally identified distant evolutionary relationships. Proc Natl Acad Sci. 1998;95:6073–6078. doi: 10.1073/pnas.95.11.6073. [DOI] [PMC free article] [PubMed] [Google Scholar]
- Gerstein M. A structural census of genomes: Comparing bacterial, eukaryotic, and archaeal genomes in terms of protein structure. J Mol Biol. 1997;274:562–676. doi: 10.1006/jmbi.1997.1412. [DOI] [PubMed] [Google Scholar]
- Gough J, Karplus K, Hughey R, Chothia C. Assignment of homology to genome sequences using a library of hidden Markov models that represent all proteins of known structure. J Mol Biol Nov. 2001;313:903–919. doi: 10.1006/jmbi.2001.5080. [DOI] [PubMed] [Google Scholar]
- Hofmann K, Bucher P, Falquet L, Bairoch A. The PROSITE database, its status in 1999. Nucleic Acids Res. 1999;27:215–219. doi: 10.1093/nar/27.1.215. [DOI] [PMC free article] [PubMed] [Google Scholar]
- Holm L, Sander C. The FSSP database of structurally aligned protein fold families. Nucleic Acids Res. 1994;22:3600–3609. [PMC free article] [PubMed] [Google Scholar]
- Huynen MA, Bork P. Measuring genome evolution. Proc Natl Acad Sci USA. 1998;95:5849–5856. doi: 10.1073/pnas.95.11.5849. [DOI] [PMC free article] [PubMed] [Google Scholar]
- Iliopoulos I, Tsoka S, Andrade MA, Janssen P, Audit B, Tramontano A, Valencia A, Leroy C, Sander C, Ouzounis CA. Genome sequences and great expectations. Genome Biol. 2000;2:INTERACTIONS 0001.1–0001.3. doi: 10.1186/gb-2000-2-1-interactions0001. [DOI] [PMC free article] [PubMed] [Google Scholar]
- Jones DT. GenTHREADER: An efficient and reliable protein fold recognition method for genomic sequences. J Mol Biol. 1999;287:797–815. doi: 10.1006/jmbi.1999.2583. [DOI] [PubMed] [Google Scholar]
- Karplus K, Barrett C, Hughey R. Hidden Markov models for detecting remote protein homologies. Bioinformatics. 1998;14:846–856. doi: 10.1093/bioinformatics/14.10.846. [DOI] [PubMed] [Google Scholar]
- Krogh A, Larsson B, von Heijne G, Sonnhammer EL. Predicting transmembrane protein topology with a hidden Markov model: Application to complete genomes. J Mol Biol. 2001;305:567–580. doi: 10.1006/jmbi.2000.4315. [DOI] [PubMed] [Google Scholar]
- Laskowski RA. PDBsum: Summaries and analyses of PDB. Nucleic Acids Res. 2001;29:221–222. doi: 10.1093/nar/29.1.221. [DOI] [PMC free article] [PubMed] [Google Scholar]
- Laskowski R A, Luscombe NM, Swindells MB, Thornton JM. Protein clefts in molecular recognition and function. Protein Sci. 1996;5:2438–2452. doi: 10.1002/pro.5560051206. [DOI] [PMC free article] [PubMed] [Google Scholar]
- Lo Conte L, Ailey B, Hubbard TJ, Brenner SE, Murzin AG, Chothia C. SCOP: A structural classification of proteins database. Nucleic Acids Res. 2000;28:257–259. doi: 10.1093/nar/28.1.257. [DOI] [PMC free article] [PubMed] [Google Scholar]
- Luscombe NM, Laskowski RA, Thornton J M. NUCPLOT: A program to generate schematic diagrams of protein-nucleic acid interactions. Nucleic Acids Res. 1997;25:4940–4945. doi: 10.1093/nar/25.24.4940. [DOI] [PMC free article] [PubMed] [Google Scholar]
- Muller A, MacCallum RM, Sternberg MJ. Benchmarking PSI-BLAST in genome annotation. J Mol Biol. 1999;293:1257–1271. doi: 10.1006/jmbi.1999.3233. [DOI] [PubMed] [Google Scholar]
- Orengo CA, Jones DT, Thornton JM. Protein superfamilies and domain superfolds. Nature. 1994;372:631–634. doi: 10.1038/372631a0. [DOI] [PubMed] [Google Scholar]
- Park J, Karplus K, Barrett C, Hughey R, Haussler D, Hubbard T, Chothia C. Sequence comparisons using multiple sequences detect three times as many remote homologues as pairwise methods. J Mol Biol. 1998;1284:1201–1210. doi: 10.1006/jmbi.1998.2221. [DOI] [PubMed] [Google Scholar]
- Park J, Teichmann SA, Hubbard T, Chothia C. Intermediate sequences increase the detection of homology between sequences. J Mol Biol. 1997;273:349–354. doi: 10.1006/jmbi.1997.1288. [DOI] [PubMed] [Google Scholar]
- Pearl FMG, Lee D, Bray JE, Buchan DW, Shepherd AJ, Orengo CA. The CATH extended protein-family database: Providing structural annotations for genome sequences. Protein Sci. 2002;11:233–244. doi: 10.1110/ps.16802. [DOI] [PMC free article] [PubMed] [Google Scholar]
- Pearl FM, Martin N, Bray JE, Buchan DW, Harrison AP, Lee D, Reeves GA, Shepherd AJ, Sillitoe I, Todd AE, et al. A rapid classification protocol for the CATH domain database to support structural genomics. Nucleic Acids Res. 2001;29:223–227. doi: 10.1093/nar/29.1.223. [DOI] [PMC free article] [PubMed] [Google Scholar]
- Pearson WR, Lipman DJ. Improved tools for biological sequence comparison. Proc Natl Acad Sci. 1988;85:2444–2448. doi: 10.1073/pnas.85.8.2444. [DOI] [PMC free article] [PubMed] [Google Scholar]
- Salamov AA, Suwa M, Orengo CA, Swindells MB. Genome analysis: Assigning protein coding regions to three-dimensional structures. Protein Sci. 1999;8:771–777. doi: 10.1110/ps.8.4.771. [DOI] [PMC free article] [PubMed] [Google Scholar]
- Schaffer AA, Wolf YI, Ponting CP, Koonin EV, Aravind L, Altschul SF. IMPALA: Matching a protein sequence against a collection of PSI-BLAST-constructed position-specific score matrices. Bioinformatics. 1999;15:1000–1011. doi: 10.1093/bioinformatics/15.12.1000. [DOI] [PubMed] [Google Scholar]
- Teichmann SA, Chothia C, Gerstein M. Advances in structural genomics. Curr Opin Struct Biol. 1999;9:390–399. doi: 10.1016/S0959-440X(99)80053-0. . Review. [DOI] [PubMed] [Google Scholar]
- Todd AE, Orengo CA, Thornton JM. Evolution of function in protein superfamilies, from a structural perspective. J Mol Biol. 2001;307:1113–1143. doi: 10.1006/jmbi.2001.4513. [DOI] [PubMed] [Google Scholar]
- Valdar WS, Thornton JM. Protein–protein interfaces: Analysis of amino acid conservation in homodimers. Proteins. 2001;42:108–124. [PubMed] [Google Scholar]
- Wallin E, von Heijne G. Genome-wide analysis of integral membrane proteins from eubacterial, archaean, and eukaryotic organisms. Protein Sci. 1998;7:1029–1038. doi: 10.1002/pro.5560070420. [DOI] [PMC free article] [PubMed] [Google Scholar]
- Wang Y, Bryant S, Tatusov R, Tatusova T. Links from genome proteins to known 3-D structures. Genome Res. 2000;10:1643–1647. doi: 10.1101/gr.143200. [DOI] [PMC free article] [PubMed] [Google Scholar]


