Abstract
Whole-genome sequencing projects have generated a wealth of gene sequences from a variety of organisms. A major challenge is to rapidly uncover gene regulatory circuits and their functional manifestations at the cellular level. Here we report the coupled fabrication of nanocraters ranging in size from 100 pL to 1.5 nL on permeable membranes for culturing cells. Using this approach, we developed bacterial and yeast cell microarrays that allowed phenotypic determinations of gene activities and drug targets on a large scale. Cell microarrays will therefore be a particularly useful tool for studying phenotypes of gene activities on a genome-wide scale.
The availability of full genome sequences has generated great interest in studying gene functions on a genome-wide scale. Several technologies have been developed that allow global functional analyses of gene activities. For example, DNA microarrays have allowed gene expression profiling for specific cellular states (DeRisi et al. 1997; Lockhart et al. 1996; Schena et al. 1995). Global two-hybrid analyses have provided a glimpse of intracellular signal wiring systems in yeast (Ito et al. 2001; Uetz et al. 2000). Biochemical genomics will enable the genome-wide analyses of protein activities (Haab et al. 2001; MacBeath and Schreiber 2000; Martzen et al. 1999; Zhu et al. 2001; Zhu et al. 2000; Ziauddin and Sabatini 2001). Genome-wide surveys of the targets of DNA-binding proteins will also have an impact on our understanding of regulatory circuits (Iyer et al. 2001; Ren et al. 2000). Systematic gene deletion projects have also begun to provide insights on gene function on a large scale (Ogasawara 2000; Ross-Macdonald et al. 1999; Winzeler et al. 1999).
Because genetic information encoded in the genome is ultimately manifested at the cellular level, the unit of life, global approaches for analyzing cell phenotypes would greatly facilitate our understanding of cellular functions of genes under a variety of conditions. However, there are several challenges to studying phenotypic manifestations of gene activities on a genome-wide scale. Large-scale phenotypic analyses require that cells be grown in parallel and miniaturized format without cross-contamination. Cells must also be grown on a transparent support to allow microscopic visualization of phenotypes. In addition, the solid support must be durable and yet flexible enough to allow cell growth under a variety of growth conditions. Finally, necessary nutrients, chemical compounds, and macromolecules must be accessible to the cells so that exogenous molecules affecting particular biological processes can be identified.
In this paper, we describe the construction of high-density cell microarrays and proof-of-principle experiments demonstrating that cell microarrays allow phenotypic determinations of gene activities on a large scale.
RESULTS
To construct cell microarrays, we tested a number of solid and semi-solid materials including common dialysis tubes, cellophanes, nylon membranes, glass slides, agarose gels, and cellulose ester membranes. We found that cellulose ester permeable membranes (details in Methods) have the following properties that make them a good solid support for growing cells. These membranes are largely transparent, relatively inert, and therefore unlikely to interfere with subsequent functional assays. In addition, nutrients, small molecule compounds, and large macromolecules can freely permeate across the membranes with defined pore sizes. In fact, these membranes have routinely been used as a dialysis barrier with defined molecular weight cutoff points. Furthermore, because of their density and hydrophobicity, the membranes can float on the surface of liquid media. Most importantly, liquid droplets were not formed on the surface of the membranes after being placed on top of agar or liquid media (data not shown). This particular property prevented the micro-flooding and subsequent cross-contamination of arrayed cells.
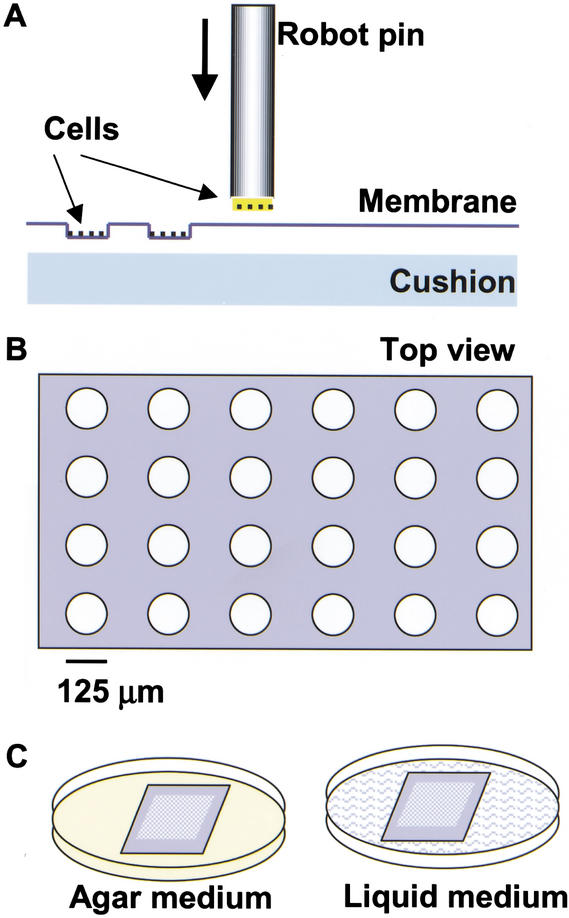
To array cells at high-density on the membranes, we developed a coupled fabrication process using a precision robot. Robot-controlled pins were first loaded with cell suspension (∼30 pL) on their flat and solid tips (125 μm in diameter, Fig. 1A) by the surface tension and were programmed to strike the membrane with a precalibrated impact depth to form nanocraters. The size of the nanocraters typically ranged from 100 pL to 1.5 nL, dependent on the precalibrated impact depth and pin size. While forming the nanocraters, the robot pins simultaneously inoculated cells at the bottom of the nanocraters (Fig. 1). Throughout the arraying process, the membrane was cushioned by a piece of flat chromatography paper. The chromatography paper was soaked with 0.5% agarose and placed on top of a microscope slide, which helped to immobilize and moisturize the membrane during the arraying process. The cushion also prevented cellular damage from the impact and allowed efficient formation of the nanocraters. Furthermore, the cushion could be supplemented with nutrients to keep cells healthy during the arraying procedures. When the procedures were completed, the membrane with cell microarrays was peeled off from the cushion by lifting a corner of the membrane with a forceps. The membrane could be placed on the surface of either an agar plate or liquid medium for subsequent tests. Alternatively, the cell microarray membrane was placed on an agar plate at 4°C until use. Nanocraters retained their original configuration even after the membranes were incubated on the surface of agar media for at least 5 mo, the longest period of time tested. With smaller pins, it should be possible to construct smaller craters that are less than 100 pL in size. The distance between centers of adjacent nanocraters was programmed to be 375 μm in the present study. However, with a shorter distance, nanocraters or picocraters could be arrayed at even higher densities.
Figure 1.
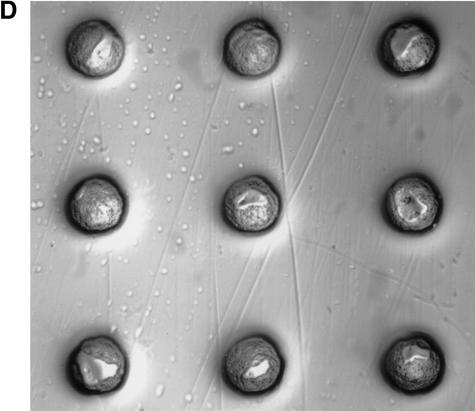
Schematic diagram of coupled fabrication of cell microarrays. (A) A robot-controlled pin with cells on the tip was programmed to strike the cellulose ester membrane to form nanocraters and simultaneously inoculate cells into them. The cellulose ester membrane was placed on top of a cushion during the arraying process. (B) Top view of arrayed nanocraters. The diameter of the nanocraters was 125 μm with a depth of 10–125 μm. The distance between centers of the adjacent nanocraters was 375 μm. (C) Cell microarray membranes were incubated on the surface of agar or liquid medium. (D) Nanocraters with yeast cells at their bottoms.
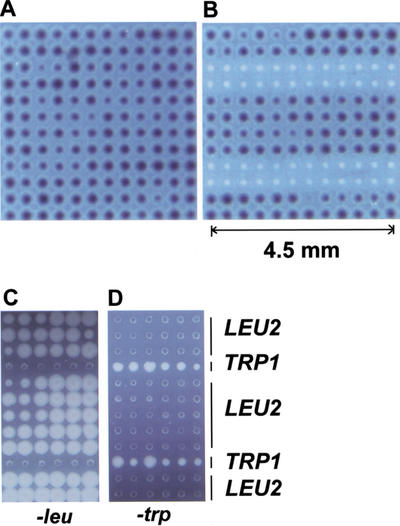
To illustrate the coupled fabrication process, we first made cell microarrays of Escherichia coli that express β-galactosidase. An overnight bacterial culture in 96-well format was arrayed by the robot onto the membrane to simultaneously form nanocraters and inoculate cells. To grow cells in the nanocraters, the membrane was peeled off from the cushion and placed on the surface of rich medium containing X-gal or S-gal (Heuermann and Cosgrove 2001) chromogenic substrates of β-galactosidase. The membrane was then incubated at 37°C overnight. Shown in Figure 2A are 144 colonies arrayed in an area of about 20 mm2. All of the arrayed bacteria expressed β-galactosidase as indicated by the black staining. Next, we arrayed two E. coli strains, one of which expressed β-galactosidase as shown in Figure 2B. The microarrays of LacZ- cells remained white whereas those of LacZ+ cells stained black on S-gal medium.
Figure 2.
Cell microarrays of E. coli and S. cerevisiae. (A) E. coli cell microarrays (144 colonies) expressing β-galactosidase in the presence of S-gal (3,4-cyclohexenoesculectin-β-D-galactopyranoside), a chromogenic substrate for β-galactosidase. (B) E. coli cell microarrays with 48 colonies that did not express β-galactosidase. (C) S. cerevisiae microarrays grown on synthetic medium without leucine. (D) S. cerevisiae microarrays grown on synthetic medium without tryptophan. Bacterial cell microarrays were placed on the surface of LB in the presence of 50 μg/mL S-gal at 37°C overnight. Yeast cell microarrays were placed on the surface of dropout media indicated in the figure at 30°C overnight.
These results indicate that there was no cross-contamination between the nanocraters or exogenous contamination during the fabrication process. Nutritional and chemical components were accessible to cells in the nanocraters on the membranes. Although cells were not homogeneously spread at the bottom of each nanocrater (Fig. 1D), cells proliferated to fill each nanocrater to form one colony (Figs. 2, 3). As a result, the colony apices of the cell microarrays were perfectly aligned with centers of the nanocraters. These characteristics of cell proliferation in the nanocraters maintained colonies in an ordered array (Figs. 2, 3), which should enable technologies for the automated storage and analyses of the cell microarray data. In fact, if cells were arrayed onto a flat surface rather than into nanocraters, multiple colonies would form from a single arrayed spot (data not shown).
Figure 3.
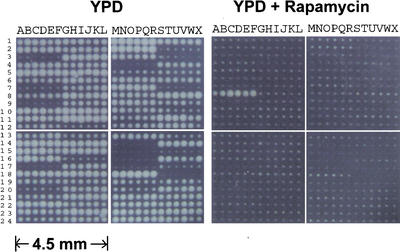
S. cerevisiae cell microarrays for assaying the drug target of rapamycin. Ninety four yeast homozygous deletion strains, including fkb1 strain and two negative controls, were arrayed with five repeats in a total of 576 nanocraters. fkb1 strain was arrayed at 8A to 8F; two negative controls that did not contain any cells were arrayed at 15M to15R and 18S-18X. One set of cell microarrays was grown on YPD and the other on YPD containing 1 μg/mL of rapamycin at 30°C overnight.
Using the coupled fabrication approach, we next developed yeast (Saccharomyces cerevisiae) cell microarrays. Shown in Figure 2, C and D, were yeast cell microarrays of an auxotrophic strain carrying either LEU2 or TRP1 plasmids. The cell array membranes were placed onto the surface of synthetic media lacking either leucine or tryptophan and incubated at 30°C for 12–24 h. Yeast cells with a LEU2 plasmid grew in the medium lacking leucine whereas those with a TRP1 plasmid did not. Conversely, yeast cells with a TRP1 plasmid grew on the medium lacking tryptophan, but those with a LEU2 plasmid did not. These bacterial and yeast results indicated that the cell microarrays allowed cellular phenotypes of genes to be accurately assayed.
To further illustrate the utility of cell microarrays for assaying drug target, we used a series of yeast diploid strains carrying homozygous gene deletions of fkb1 and 93 other genes chosen at random (Winzeler et al. 1999). FKB1 encodes FPR1 that binds FK506 and rapamycin, two natural products used as antifungal and immunosuppressant drugs. The FPR1-drug complex inhibits progression through the G1 phase of the cell cycle in yeast. Deletion of FKB1 has been shown to render yeast resistant to rapamycin (Chan et al. 2000; Heitman et al. 1991; Schreiber and Crabtree 1995). These yeast deletion strains were arrayed with five repeats, resulting in a total of 576 arrayed spots. The cell microarrays were incubated on the surface of YPD-rich media with or without 1 μg/mL rapamycin until the fastest growing colonies were in contact with each other. As shown in Figure 3, there were some growth differences among cell arrays on YPD medium lacking the drug, which was in part attributable to the growth differences between strains. However, only the fkb1 strain could proliferate on YPD in the presence of rapamycin (Fig. 3). Other cells did not grow even after the cell microarrays were incubated on YPD in the presence of rapamycin for several days. This data indicated that cell microarrays could be a powerful approach for assaying cellular functions of genes and drug targets on a large scale.
DISCUSSION
We show that the coupled fabrication of cell microarrays on permeable membranes is simple, yet very accurate and robust. We also performed proof-of-principle experiments demonstrating that high-density cell microarrays allow parallel phenotypic assays of gene activities on a large scale. Future development of this technology would be a real-time image acquisition system by which cell numbers and phenotypes (e.g., budding defects, cell shapes, and drug resistance) could be digitally recorded and compared for each nanocrater from the beginning to the end of an experiment. This would also allow the quantification and comparison of cell proliferation rates between different strains under a variety of conditions. Nevertheless, it is clearly shown that the cell microarrays allowed parallel assays of phenotypes such as color changes, growth defect, and drug target on a large scale (Figs. 2, 3).
Cell microarrays should thus facilitate the functional studies of genome-wide gene deletion projects of yeast, Bacillus subtilis, or other cells that are currently under way (Ogasawara 2000; Ross-Macdonald et al. 1999; Winzeler et al. 1999). For example, more than 5000 viable yeast deletion strains could be arrayed on the permeable membrane within an area of ∼6 cm2. Such cell microarrays would allow high-throughput phenotypic assays (e.g., cell shape, budding pattern, and drug resistance) of gene activities under a variety of conditions. Therefore, cell microarrays should complement other functional genomic tools such as DNA microarrays, yeast two-hybrid, and proteomic approaches (Ideker et al. 2001).
Current protein microarrays require that proteins be immobilized to a solid support for biochemical assays (Haab et al. 2001; MacBeath and Schreiber 2000; Zhu et al. 2001; Zhu et al. 2000). Despite the current success of these protein microarrays, there is a possibility that biochemical properties of proteins could be altered by the immobilization or covalent attachment. Because the coupled fabrication of nanocraters on permeable membranes is a physical process that requires no immobilization or chemical reactions, it could be used as an alternative approach for making protein or other molecular and cellular microarrays.
Because cell microarray analyses require only a small amount of medium, one could systematically examine cellular interactions with small molecules, natural products, peptides, antibodies, polysaccharides, and other large molecules, most of which are too difficult or expensive to be synthesized in large quantity. Such systematic phenotypic studies should accelerate the discovery of drug and drug targets (Hartwell et al. 1997; Mayer et al. 1999). Cell microarrays may also become a powerful tool in the emerging field of chemical genomics (Chan et al. 2000; Giaever et al. 1999). With high-capacity diversity-oriented synthesis of small molecules (Tallarico et al. 2001) it is feasible to assay one compound (from one bead) against the cell microarrays containing the genome-wide collection of gene deletion or overexpression strains.
METHODS
Chemicals, Plasmids, and Cell Cultures
S-gal and rapamycin were purchased from Sigma. Plasmids were used as follows: pcDNA3 (Invitrogen) and pUC18 (Stratagene), pJG4–5 and pCWX200 (Xu et al. 1997). S. cerevisiae strains CWXY2 (Xu et al. 1997) and EGY42 (Gyuris et al. 1993) were used for yeast cell arrays for assaying auxotrophic growth. The comprehensive collection of yeast homozygous deletion strains was obtained from Research Genetics (Winzeler et al. 1999). Overnight bacterial DH5α cultures in 96-well format could be directly used for arraying without concentration. However, yeast cultures (mid–late log phase, 1.2 mL) in 96-well format were centrifuged and yeast cells were resuspended in 50 μL YPD-rich media with (Fig. 3) or without 15% glycerol (Fig. 2C,D). DNA manipulations and bacterial and yeast transformation were according to standard protocols.
Membrane Preparation
Cellulose ester membranes for cell microarrays were purchased from Spectrum Laboratories (catalog #132 974). These membranes were originally designed for the 96-well microdialyzer. The molecular weight cutoff point of the membranes in this study was 3500 daltons. Its thickness is estimated to be 10 μm. These membranes were extensively rinsed with deionized water and stored in water at 4°C overnight before use. For the preparation of microarrays, a piece of chromatography paper (2 cm × 3 cm) as a cushion was soaked with warm 0.5% agarose solution and placed on top of a microscope slide. The membrane (2 cm × 3 cm) was subsequently placed on top of the cushion. Any bubbles or excessive agarose between the cushion and the membrane were removed by gently rubbing the membrane with a clean and smooth rod. The membrane assembly (Fig. 1A) was then placed on a slide holder of a microarrayer (GMS 417, Affymetrix). The membranes should not be dried at any stage. The cushion helped to immobilize and moisturize the membrane during the arraying process. The cushion also prevented cellular damage from the impact and allowed efficient formation of the nanocraters as described below. Furthermore, the cushion could be supplemented with nutrients to keep cells healthy.
Coupled Fabrication of Cell Microarrays
A robotic arrayer (GMS 417, Affymetrix) equipped with four rings and four pins (125 μm in diameter) was used for the coupled fabrication of cell microarrays. The rings were first loaded with cell suspensions from 96-well or 384-well cell stocks by the surface tension. The pins were then programmed to penetrate the cell suspension solutions on the rings, which allowed each flat and solid pin tip to hold about 30 pL of cell suspension by the surface tension. Pins were programmed to strike the membrane with predetermined impact depth to form nanocraters and inoculate cells simultaneously in an environment of 50% relative humidity. The volume of the nanocraters was estimated to be from 100 pL to 1.5 nL, based on the pin size and typical depth of the nanocraters. Inoculation of hundreds of yeast cells in each nanocrater typically required two to six strikes (or loads of 30 pL of the cell suspensions). After the arraying procedure was completed, the membrane with cell microarrays was peeled off from the cushion by lifting a corner of the membrane with a forceps. The membrane was then placed on the surface of either an agar plate or liquid medium for incubation in appropriate media at 30°C (yeast) or 37°C (bacteria) for about 16 hr. Alternatively, cell microarrays were stored on rich medium at 4°C until use. The current setup of the robot could produce 42 sets of cell microarrays with a single run. The distance between centers of arrayed nanocraters was programmed to be 375 μm, although distance as small as 200 μm was feasible with pins of 125 μm in diameter. Cell microarray images were captured with a microscope equipped with a digital camera.
Acknowledgments
I thank J. Bertino and members of the laboratory for critical reading of the manuscript and discussions. The work was supported in part by American Cancer Society.
The publication costs of this article were defrayed in part by payment of page charges. This article must therefore be hereby marked “advertisement” in accordance with 18 USC section 1734 solely to indicate this fact.
Footnotes
Corresponding author.
E-MAIL w-xu@ski.mskcc.org; FAX (212) 794-4342.
Article and publication are at http://www.genome.org/cgi/doi/10.1101/gr.213002. Article published online before print in February 2002.
REFERENCES
- Chan TF, Carvalho J, Riles L, Zheng XF. A chemical genomics approach toward understanding the global functions of the target of rapamycin protein (TOR) Proc Natl Acad Sci. 2000;97:13227–13232. doi: 10.1073/pnas.240444197. [DOI] [PMC free article] [PubMed] [Google Scholar]
- DeRisi JL, Iyer VR, Brown PO. Exploring the metabolic and genetic control of gene expression on a genomic scale. Science. 1997;278:680–686. doi: 10.1126/science.278.5338.680. [DOI] [PubMed] [Google Scholar]
- Giaever G, Shoemaker DD, Jones TW, Liang H, Winzeler EA, Astromoff A, Davis RW. Genomic profiling of drug sensitivities via induced haploinsufficiency. Nat Genet. 1999;21:278–283. doi: 10.1038/6791. [DOI] [PubMed] [Google Scholar]
- Gyuris J, Golemis E, Chertkov H, Brent R. Cdi1, a human G1 and S phase protein phosphatase that associates with Cdk2. Cell. 1993;75:791–803. doi: 10.1016/0092-8674(93)90498-f. [DOI] [PubMed] [Google Scholar]
- Haab BB, Dunham MJ, Brown PO. Protein microarrays for highly parallel detection and quantitation of specific proteins and antibodies in complex solutions. Genome Biol. 2001;2:1–13. doi: 10.1186/gb-2001-2-2-research0004. [DOI] [PMC free article] [PubMed] [Google Scholar]
- Hartwell LH, Szankasi P, Roberts CJ, Murray AW, Friend SH. Integrating genetic approaches into the discovery of anticancer drugs. Science. 1997;278:1064–1068. doi: 10.1126/science.278.5340.1064. [DOI] [PubMed] [Google Scholar]
- Heitman J, Movva NR, Hall MN. Targets for cell cycle arrest by the immunosuppressant rapamycin in yeast. Science. 1991;253:905–909. doi: 10.1126/science.1715094. [DOI] [PubMed] [Google Scholar]
- Heuermann K, Cosgrove J. S-Gal: An autoclavable dye for color selection of cloned DNA inserts. Biotechniques. 2001;30:1142–1147. doi: 10.2144/01305pf01. [DOI] [PubMed] [Google Scholar]
- Ideker T, Thorsson V, Ranish JA, Christmas R, Buhler J, Eng JK, Bumgarner R, Goodlett DR, Aebersold R, Hood L. Integrated genomic and proteomic analyses of a systematically perturbed metabolic network. Science. 2001;292:929–934. doi: 10.1126/science.292.5518.929. [DOI] [PubMed] [Google Scholar]
- Ito T, Chiba T, Ozawa R, Yoshida M, Hattori M, Sakaki Y. A comprehensive two-hybrid analysis to explore the yeast protein interactome. Proc Natl Acad Sci. 2001;98:4569–4574. doi: 10.1073/pnas.061034498. [DOI] [PMC free article] [PubMed] [Google Scholar]
- Iyer VR, Horak CE, Scafe CS, Botstein D, Snyder M, Brown PO. Genomic binding sites of the yeast cell-cycle transcription factors SBF and MBF. Nature. 2001;409:533–538. doi: 10.1038/35054095. [DOI] [PubMed] [Google Scholar]
- Lockhart DJ, Dong H, Byrne MC, Follettie MT, Gallo MV, Chee MS, Mittmann M, Wang C, Kobayashi M, Horton H, et al. Expression monitoring by hybridization to high-density oligonucleotide arrays. Nat Biotechnol. 1996;14:1675–1680. doi: 10.1038/nbt1296-1675. [DOI] [PubMed] [Google Scholar]
- MacBeath G, Schreiber SL. Printing proteins as microarrays for high-throughput function determination. Science. 2000;289:1760–1763. doi: 10.1126/science.289.5485.1760. [DOI] [PubMed] [Google Scholar]
- Martzen MR, McCraith SM, Spinelli SL, Torres FM, Fields S, Grayhack EJ, Phizicky EM. A biochemical genomics approach for identifying genes by the activity of their products. Science. 1999;286:1153–1155. doi: 10.1126/science.286.5442.1153. [DOI] [PubMed] [Google Scholar]
- Mayer TU, Kapoor TM, Haggarty SJ, King RW, Schreiber SL, Mitchison TJ. Small molecule inhibitor of mitotic spindle bipolarity identified in a phenotype-based screen. Science. 1999;286:971–974. doi: 10.1126/science.286.5441.971. [DOI] [PubMed] [Google Scholar]
- Ogasawara N. Systematic function analysis of Bacillus subtilis genes. Res Microbiol. 2000;151:129–134. doi: 10.1016/s0923-2508(00)00118-2. [DOI] [PubMed] [Google Scholar]
- Ren B, Robert F, Wyrick JJ, Aparicio O, Jennings EG, Simon I, Zeitlinger J, Schreiber J, Hannett N, Kanin E, et al. Genome-wide location and function of DNA binding proteins. Science. 2000;290:2306–2309. doi: 10.1126/science.290.5500.2306. [DOI] [PubMed] [Google Scholar]
- Ross-Macdonald P, Coelho PS, Roemer T, Agarwal S, Kumar A, Jansen R, Cheung KH, Sheehan A, Symoniatis D, Umansky L, et al. Large-scale analysis of the yeast genome by transposon tagging and gene disruption. Nature. 1999;402:413–418. doi: 10.1038/46558. [DOI] [PubMed] [Google Scholar]
- Schena M, Shalon D, Davis RW, Brown PO. Quantitative monitoring of gene expression patterns with a complementary DNA microarray. Science. 1995;270:467–470. doi: 10.1126/science.270.5235.467. [DOI] [PubMed] [Google Scholar]
- Schreiber SL, Crabtree GR. Immunophilins, ligands, and the control of signal transduction. Harvey Lect. 1995;91:99–114. [PubMed] [Google Scholar]
- Tallarico JA, Depew KM, Pelish HE, Westwood NJ, Lindsley CW, Shair MD, Schreiber SL, Foley MA. An alkylsilyl-tethered, high-capacity solid support amenable to diversity-oriented synthesis for one-bead, one-stock solution chemical genetics. J Comb Chem. 2001;3:312–318. doi: 10.1021/cc000107i. [DOI] [PubMed] [Google Scholar]
- Uetz P, Giot L, Cagney G, Mansfield TA, Judson RS, Knight JR, Lockshon D, Narayan V, Srinivasan M, Pochart P, et al. A comprehensive analysis of protein–protein interactions in Saccharomyces cerevisiae. Nature. 2000;403:623–627. doi: 10.1038/35001009. [DOI] [PubMed] [Google Scholar]
- Winzeler EA, Shoemaker DD, Astromoff A, Liang H, Anderson K, Andre B, Bangham R, Benito R, Boeke JD, Bussey H, et al. Functional characterization of the S. cerevisiae genome by gene deletion and parallel analysis. Science. 1999;285:901–906. doi: 10.1126/science.285.5429.901. [DOI] [PubMed] [Google Scholar]
- Xu CW, Mendelsohn AR, Brent R. Cells that register logical relationships among proteins. Proc Natl Acad Sci. 1997;94:12473–12478. doi: 10.1073/pnas.94.23.12473. [DOI] [PMC free article] [PubMed] [Google Scholar]
- Zhu H, Bilgin M, Bangham R, Hall D, Casamayor A, Bertone P, Lan N, Jansen R, Bidlingmaier S, Houfek T, et al. Global analysis of protein activities using proteome chips. Science. 2001;293:2101–2105. doi: 10.1126/science.1062191. [DOI] [PubMed] [Google Scholar]
- Zhu H, Klemic JF, Chang S, Bertone P, Casamayor A, Klemic KG, Smith D, Gerstein M, Reed MA, Snyder M. Analysis of yeast protein kinases using protein chips. Nat Genet. 2000;26:283–289. doi: 10.1038/81576. [DOI] [PubMed] [Google Scholar]
- Ziauddin J, Sabatini DM. Microarrays of cells expressing defined cDNAs. Nature. 2001;411:107–110. doi: 10.1038/35075114. [DOI] [PubMed] [Google Scholar]


