Abstract
Electrical impedance tomography (EIT) is a non-invasive technique used to image the electrical conductivity and permittivity within a body from measurements taken on the body’s surface. High-quality static images are required for many medical imaging applications. Forming such images usually requires an accurate way to calculate the expected voltages on the surface resulting from the application of known currents to that surface. This is described as the forward problem. This paper introduces a new method to improve static images by using an improved forward solution which estimates a different conductivity value for each applied current pattern. This method, creating an automatically adjusting forward solution, can improve the sensitivity of static images under many EIT imaging applications. It does so by reducing the boundary effects caused by electrodes and any layered structures near them such as skin. The drawback of this method is that circularly symmetric structures of interest may be suppressed or eliminated from the images. The performance of this method is illustrated in a 2D circular phantom with simulation data from both a FEM model and experimental data.
Keywords: forward solution, auto-adjusting forward solution, trigonometric current pattern, boundary effects, NOSER, FEM
1. Introduction
Electrical impedance tomography (EIT) is a non-invasive technique used to image the electrical conductivity and permittivity within a body from measurements taken on the body’s surface. Accurate static imaging requires an accurate forward model as a reference in order to show the absolute conductivity distribution. The quality of static imaging is limited by the effects of many unknowns in the forward model. Difference imaging is often preferred to static imaging, because it can eliminate the effects of many of these unknowns. However, difference imaging is not suitable for many medical applications such as tumor detection, or imaging hemorrhagic or ischemic stroke, when a normal or control image is not available (McEwan et al 2005).
One challenge in achieving an accurate forward solution is to account properly for the contact impedance of the electrodes. Many investigators have addressed this problem, including the finite element method (FEM) reported by Polydorides and Lionheart (2002) and Kaipio et al (2000), and the complete electrode model reported by Cheng et al (1989) and Somersalo et al (1992). Although these and other improvements in the performance of static imaging have occurred, the boundary layer effects caused by the electrodes and the underlying tissues still exist in the reconstructed images.
A related difficulty in forming static images is to account for the boundary layer effects at the electrodes. To address this problem, a data calibration scheme was proposed by Soni et al (2003). The ratio of the homogeneous forward solution to the corresponding homogeneous experimental data was calculated and called ‘scaling factors’. These scaling factors are averaged over each excitation pattern. This scheme works less well at high spatial frequency because of many zeros or terms close to zero in the excitation patterns and in the corresponding responses. These small values cause large errors in the scaling factors needed for the forward solution. Therefore, the boundary effect problem remains present, although reduced.
Because of the scalp, skull and CSF, layer effects are more severe in brain imaging (Bayford et al 2001,Tidswell et al 2001a). In a study of a realistic, head-shaped tank reported by Tidswell et al (2001b), localization errors in the reconstructed images were between 3.1% and 13.3% without a skull and between 10.3% and 18.7% with a human skull. Recently, Bagshaw et al (2003) reported difference imaging of human brain function and concluded that “The improvements in image quality found when using a more accurate forward model were more significant than the effects of the electrode localization accuracy or the resolution.”
In this paper, we introduce a new method to improve the forward solution by automatically finding a best conductivity value for each current pattern. The method offers a better reference voltage to improve the sensitivity of a static image so that the quality of a static image can approach that of a difference image. This method, which automatically adjusts the forward solver, may also reduce the effect of the electrodes and the effects of underlying layered structures. The penalty of this method is that a circularly symmetric structure of interest may be suppressed or eliminated from the images. The performance of this method is illustrated in a 2D circular geometry using an analytical forward solution for the homogenous case and experimental measurement data from a saline-filled circular tank and ACT 3 (Cook et al 1994). The reconstruction algorithm used was NOSER (Simske 1987, Cheney et al 1990).
2. Methods
2.1. NOSER: Newton’s one-step error reconstructor
The Newton’s one-step error reconstruction (NOSER) algorithm was developed for circular electrode geometries. It begins with a guess of an initial distribution of conductivities or resistivity , where ρn is the reciprocal of σn, and n is the total number of mesh elements. Current patterns are applied to the 32 electrodes, and potentials are measured on each electrode . Also, the potential on the electrodes with the guess can be computed. Our goal here is to minimize the sum of the squares of the differences between two potentials:
| (1) |
The minimization of is equivalent to finding the zero point of the derivative of as
| (2) |
We then solve . Using Newton’s method, the solution can be obtained iteratively.
The equation is
| (3) |
The procedure can be summarized as follows.
Choose the best constant resistivity .
Compute , as , where denotes the vector inner product and is a set of orthogonal current patterns.
Approximate , where Mn is the nth mesh element.
Approximate , where , and is a delta function, which equals 1 if n = m and zero otherwise. Gamma, γ, is the regularization parameter, which should be chosen to be as small as possible consistent with a stable solution. Practically, values between 0.5 and 0.1 are satisfactory; we used 0.5 for the results in this paper.
Compute by Newton’s method and display the result on the chosen mesh.
The NOSER algorithm was first presented (Simske 1987, Cheney et al 1990) using resistivity ρ to explain the concept. We have continued that practice for the above section of this paper, to facilitate comparison with the original. More recently, we have found it to be more useful and more consistent with the work of others in the field, to study conductivity, the reciprocal of resistivity. The following discussion and results are therefore expressed as conductivity.
2.2. Classic forward solution
The forward problem is described as follows: given a homogeneous conductivity σ0 (sigma_zero = 1) inside the body and the current density j on its boundary, determine the voltage on the boundary. Inside the body, in and , where r0 is the radius of a circular tank and θ is the angle subtended by one electrode. On the boundary, we apply a spatially trigonometric current pattern, resulting in the current density , and measure the voltage u(r0,θ). By using the ‘Ave-Gap model’ (Cheng et al 1989), the current density on the electrode can be expressed as
| (4) |
Here L denotes the number of electrodes; el is the portion of the surface in contact with the lth electrode; Il is the current sent to the lth electrode and Areal is the area of the lth electrode. Therefore, the current density on the boundary is , where
Then, the resulting voltage using the Ave-Gap model can be written as
We can obtain Ul by solving Laplace’s equation
| (5) |
For a unique solution, we need two constraints
| (6) |
(Divergence theorem).
We choose the ground as follows, which leads to voltages in the same class of function as the currents, which is useful in the subsequent analysis:
| (7) |
Using separation of variables, we can obtain the solution
| (8) |
In the Ave-Gap model, the voltages on the boundary can be written as
| (9) |
where
The classical forward solution will be where
| (10) |
We call this the ‘sigma best’, , the best guess for the conductivity of the homogeneous body in the algorithm. is the predicted voltage from the forward solver with an initial starting guess that the conductivity is equal to 1, and is the voltage measurement for the lth electrode and the kth current pattern.
2.3. Auto-adjusting forward solution
In NOSER algorithm, we apply a trigonometric current pattern and measure the corresponding voltage. The trigonometric current patterns are of the form
| (11) |
where θl = 2πl/L and is the applied current for the lth electrode and the kth current pattern. L is the number of electrodes on the boundary. We then compute a best constant conductivity to scale the forward solution as a reference value for reconstructions. In an ideal homogeneous case, this is correct. But in a real case, the differences in the current pathways for different applied current patterns may result in different observed conductivities. For example, figure 1 suggests the pathway of two current patterns, cos θ and cos 3θ, in a 2D circular phantom. Because of the conductive electrodes and the layers of skin on the boundary of the body, the pathways of these two different patterns did not pass through regions with the same conductivity. The cos 3θ pattern spends a greater portion of its travel in the boundary material than cos θ pattern does. In other words, the best constant conductivity for high spatial frequency pattern will represent the material close to the boundary and the best constant conductivity for low spatial frequency patterns will more closely represent the material in the center.
Figure 1.
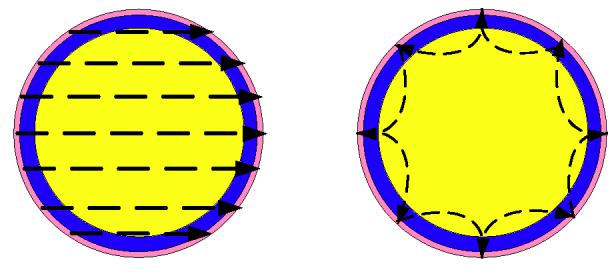
The pathway of the current patterns cos θ and cos 3θ in a 2D circular phantom having an electrode ring and connective tissue layers around the boundary.
We can address these differences by calculating a best constant conductivity vector, , for each current pattern, instead of using a single best value for all patterns
| (12) |
Figure 2 shows a best constant conductivity value, , and a best conductivity vector, , obtained from experimental data with a saline-filled 2D homogeneous test tank.
Figure 2.
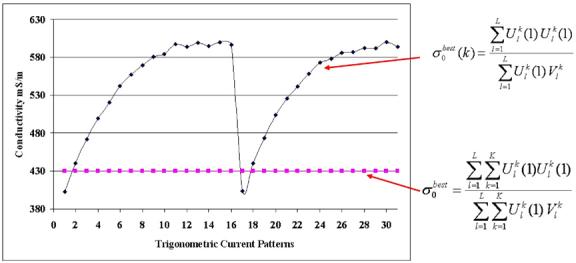
The sigma_best vector and a best constant sigma for all current patterns.
We compared the forward solution with the voltages measured on the homogeneous tank and computed the absolute error of the trigonometric current patterns (figure 3). The absolute error is expressed as
| (13) |
Figure 3.
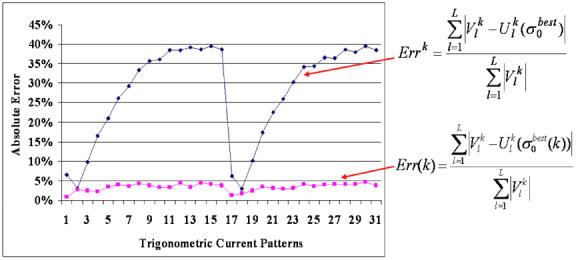
The absolute error using classic (diamonds) and auto-adjusting (squares) forward solutions.
where is the predicted voltage from the forward solver and is the resulting voltage of the homogeneous tank.
The differences between the classic forward solution and the voltages from the homogeneous tank may be as large as 40% (diamonds in figure 3) and result from choosing a single best constant conductivity value, , for all current patterns. When we rescaled the forward solution by using the best conductivity value, , for each of the k current patterns, the absolute error was reduced below 5% (squares in figure 3).
3. Reconstructions
3.1. Experimental data from ACT 3
Experiments were conducted on a saline bath of radius r0 = 15 cm containing L = 32 stainless steel electrodes around its inner circumference. The width of each electrode was 2.54 cm and the gap between electrodes of 3.5 mm was filled with a rubber sealant. The circular phantom (figure 4), contains ‘lungs’ and a ‘heart’ made of agar with varying amounts of added salt. It was filled with salt water, and connected to the EIT system, ACT 3. The conductivity of these objects is shown in the middle illustration.
Figure 4.
Left: the experimental circular chest phantom. Center: the conductivity of the agar heart, lungs and saline. Right: the 496-Joshua tree mesh used by the reconstruction algorithm.
The output of the NOSER reconstruction algorithm is a vector of 496 numbers representing all the degrees of freedom in the data. The number of degrees of freedom or modes of the reconstruction mesh is limited to number of independent voltage measurements from the object. We used a 496-Joshua tree mesh to display the reconstructed images. NOSER reconstructions for the heart and lung phantom made using a forward solution with and using the auto-adjusting forward solution with are compared in figure 5.
Figure 5.
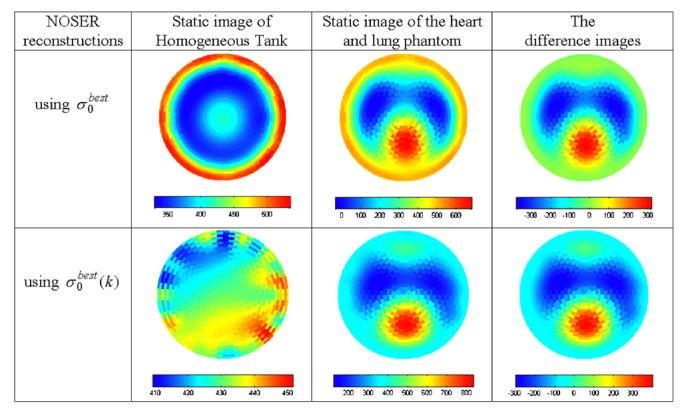
The reconstructed conductivity images by using (top row) and (bottom row) for the forward solution. The numerical scales on the color bars give the conductivity in mS m-1
When using for the forward solution, the static image of homogeneous tank is much smoother (410 <σ < 450) than it is when using (300 <σ < 550). With the static image of the heart and lung phantom is similar to the difference image with . The shape of right lung using is not as accurate as in the top row using but the shape of the heart is much closer to that of the phantom (figure 4). In this relatively uniform tank, it is hard to conclude which forward solution works better than the other because of the different scales. But the auto-adjusting forward solution can substantially reduce the electrode effect on the reconstructed static image so that the quality and the sensitivity of static image are improved.
3.2. Simulation data with layer tissues
In figure 5, the auto-adjusting forward solution reduced the effect of the electrodes on the boundary of the test tank. A more complicated case occurs with a layer of skin on the boundary. To evaluate the performance of two methods with skin present, we used the FEM to obtain a numerical solution. In the FEM, the object area is discretized into many small elements having a node at each corner, and it is assumed that the resistivity distribution is constant within each element. Details on the FEM approach are found in Vauhkonen (1997) and EIDORS (Vauhkonen et al 2001). Figure 6 shows the FEM mesh used, with 32 electrodes on the boundary (left figure) and the three-layer structure (right figure) which presents skin (black), fat (yellow) and muscle (red). To avoid an inverse crime, we used the 496-Joshua mesh shown on the right of figure 4 for the image reconstruction.
Figure 6.
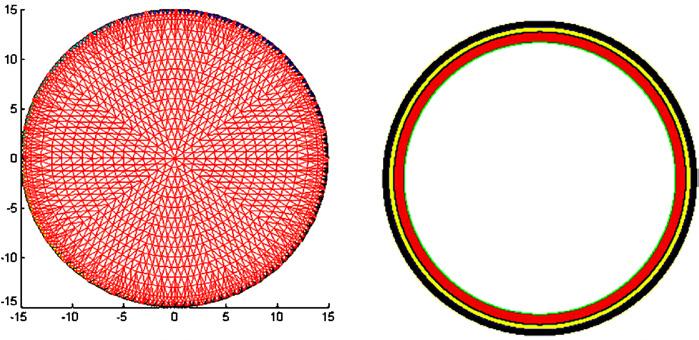
The FEM mesh and the three-layer structure modeled.
Figure 7 shows the simulation of the thorax chamber with the three-layer structure and the chest phantom on the FEM mesh. The conductivities of the tissues are 0.01 mS m-1 for the skin, 125 mS m-1 for the fat, 250 mS m-1 for the muscle, 625 mS m-1 for the thorax chamber, 400 mS m-1 for the lungs and 1666 mS m-1 for the heart. There are also electrodes present in the left image of figure 7 but they are obscured in the image by the tissue layer.
Figure 7.
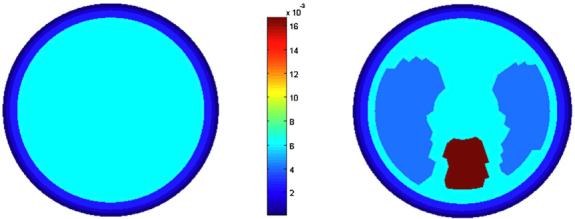
The empty thorax chamber and the chest phantom represented on the FEM mesh. The color bar gives conductivity in S m-1 × 10⁻².
The trigonometric current patterns were applied to the FEM phantoms, the resulting voltages were calculated and the NOSER algorithm was used to reconstruct the images shown in figure 8. The static image of the empty thorax had a wide dynamic range, due to the electrodes, skin and muscle at the periphery (first column). When was used to scale the forward solution, this dynamic range was greatly reduced (first column, second row). The static image of the heart and lungs does not show these organs when is used, but they are clearly seen when is applied. Difference images do show the heart and lungs when either set of is applied.
Figure 8.
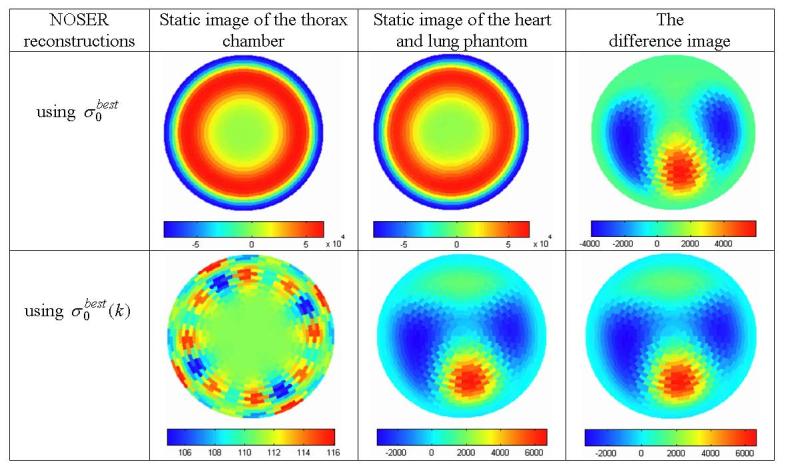
The reconstructed conductivity images of the FEM phantom by using and for the forward solution.
The reconstructions using show the circularly symmetric layered structure around the periphery while those using do not. The presence of these low conductivity layers (skin, fat or bone) in the reconstruction using expands the dynamic range of the image and makes the more subtle features invisible. Note that the color scale includes negative values, a result of the small value of the reference constant conductivity. In contrast, the auto-adjusting forward solution using removes the circularly symmetric layers and displays the result on a narrower scale, which improves the sensitivity of the static image.
4. Discussion and conclusions
The auto-adjusting forward solution reduces the absolute error between the predicted voltages and the voltages measured on the homogeneous tank (figure 2), which reduces the electrode effect in the reconstructed static images (figure 5) improving the quality and the sensitivity of the static images. This method increases sensitivity to targets which break the symmetric structure. Because a developing tumor in unlikely to be at the center of a field, we may be able to find the tumor more easily using the auto-adjusting forward solution.
Using the classic forward solution, a constant value is used to rescale the forward solutions of all spatial frequency patterns, and the static reconstructed image shows everything, including the electrodes, within the boundary. This result is in a wide intensity scale, making low-contrast targets invisible. Using the auto-adjusting forward solutions, the static reconstructed image shows only those objects which break the circular symmetry. Hence, the object is more clearly shown in the static image.
There is an important limitation of this method: it cannot show a target located at a symmetric position to all the electrodes, such as in the center of the circle. This limitation is most severe with circular electrode arrays. It might not be important in a 3D case since it is difficult to get a symmetric point except the center of a sphere. The layer structures are basically symmetric to the electrodes and are eliminated in static images by this method.
Kolehmainen et al (1997) have published a detailed report about the errors caused by electrode position and contact impedance. For degradations in the image caused by errors in the electrode position, the best remedy is to match the electrode positions in the forward model with the actual electrode positions. Using the complete electrode model can reduce the errors caused by the electrode contact impedance but not the effects caused by the layer tissues at the periphery. Using simulation and experimental results, we have demonstrated a simple way to eliminate these effects and to improve the sensitivity and the quality of static imaging.
The auto-adjusting forward solution works for both 2D and 3D reconstructions, though only 2D results are reported here. Future studies will investigate how this technique works with human data in circular and planar electrode geometries.
Acknowledgments
This work was supported in part by CenSSIS, the Center for Subsurface Sensing and Imaging Systems, under the Engineering Research Centers Program of the National Science Foundation (award number EEC-9986821) and NIBIB, the National Institute of Biomedical Imaging and Bioengineering under grant number R01-EB000456-01.
References
- Bagshaw AP, Liston AD, Bayford RH, Tizzard A, Gibson AP, Tidswell AT, Sparkes MK, Dehghani H, Binnie CD, Holder DS. Electrical impedance tomography of human brain function using reconstruction algorithms based on the finite element method. Neuroimage. 2003;20:752–64. doi: 10.1016/S1053-8119(03)00301-X. [DOI] [PubMed] [Google Scholar]
- Bayford RH, Gibson AP, Tizzard A, Tidswell T, Holder DS. Solving the forward problem in electrical impedance tomography for the human head using IDEAS (integrated design engineering analysis software), a finite element modeling tool. Physiol. Meas. 2001;22:55–64. doi: 10.1088/0967-3334/22/1/308. [DOI] [PubMed] [Google Scholar]
- Cheney M, Isaacson D, Newell JC, Simske S, Goble JC. NOSER: an algorithm for solving the inverse conductivity problem. Int. J. Imaging Syst. Technol. 1990;2:66–75. doi: 10.1002/ima.1850020203. [DOI] [PMC free article] [PubMed] [Google Scholar]
- Cheng K-S, Isaacson D, Newell JC, Gisser DG. Electrode models for electric current computed tomography. IEEE Trans. Biomed. Eng. 1989;36:918–24. doi: 10.1109/10.35300. [DOI] [PMC free article] [PubMed] [Google Scholar]
- Cook RD, Saulnier GJ, Gisser DG, Goble JC, Newell JC, Isaacson D. ACT 3: a high speed high precision electrical impedance tomography. IEEE Trans. Biomed. Eng. 1994;41:713–22. doi: 10.1109/10.310086. [DOI] [PMC free article] [PubMed] [Google Scholar]
- Kaipio J, Kolehmainen V, Somersalo E, Vauhkonen M. Statistical inversion and Monte Carlo sampling methods in electrical impedance tomography. Inverse Problems. 2000;16:1487–522. [Google Scholar]
- Kolehmainen V, Vauhkonen M, Karjalainen PA, Kaipio JP. Assessment of errors in static electric impedance tomography with adjacent and trigonometric current patterns. Physiol. Meas. 1997;18:289–303. doi: 10.1088/0967-3334/18/4/003. [DOI] [PubMed] [Google Scholar]
- McEwan A, Yerworth R, Horesh L, Bayford R, Holder DS. Specification and calibration of a multi-frequency MEIT system for stroke. Conf. Biomedical Applications of Electrical Impedance Tomography. 2005 (University College London, 22-24th June) [Google Scholar]
- Mueller JL, Isaacson D, Newell JC. A reconstruction algorithm for electrical impedance tomography data collected on rectangular electrode arrays. IEEE Trans. Biomed. Eng. 1998;46:1379–86. doi: 10.1109/10.797998. [DOI] [PubMed] [Google Scholar]
- Polydorides N, Lionheart WRB. A Matlab toolkit for three-dimensional electrical impedance tomography: a contribution to the electrical impedance and diffuse optical reconstruction software project. Meas. Sci. Technol. 2002;13:1871–83. [Google Scholar]
- Simske SJ. An adaptive current determination and a one-step reconstruction technique for a current tomography system. Rensselaer Polytechnic Institute; Troy, NY: 1987. MS thesis. [Google Scholar]
- Somersalo E, Cheney M, Isaacson D. Existence and uniqueness for electrode models for electric current computed tomography. SIAM J. Appl. Math. 1992;52:1023–40. [Google Scholar]
- Soni NK, Dehghani H, Hartov A, Paulsen KD. A novel data calibration scheme for electrical impedance tomography. Physiol. Meas. 2003;24:421–35. doi: 10.1088/0967-3334/24/2/354. [DOI] [PubMed] [Google Scholar]
- Tidswell AT, Gibson AP, Bayford RH, Holder DS. Electrical impedance tomography of human brain activity with a two-dimensional ring of scalp electrodes. Physiol. Meas. 2001a;22:167–75. doi: 10.1088/0967-3334/22/1/320. [DOI] [PubMed] [Google Scholar]
- Tidswell AT, Gibson AP, Bayford RH, Holder DS. Validation of a 3D reconstruction algorithm for EIT of human brain function in a realistic head shaped tank. Physiol. Meas. 2001b;22:177–85. doi: 10.1088/0967-3334/22/1/321. [DOI] [PubMed] [Google Scholar]
- Vauhkonen M. Electrical impedance tomography and prior information. University of Kuopio; Finland: 1997. ( http://venda.uku.fi/mvauhkon/) PhD Thesis. [Google Scholar]
- Vauhkonen M, Lionheart WR, Heikkinen LM, Vauhkonen PJ, Kaipio JP. A MATLAB package for the EIDORS project to reconstruct two-dimensional EIT images. Physiol. Meas. 2001;22:107–11. doi: 10.1088/0967-3334/22/1/314. [DOI] [PubMed] [Google Scholar]


