

Abstract
Objective:
To investigate the potential relationship between life events and injury among high school football players.
Design and Setting:
This was a prospective cohort study. We collected athlete-exposure and injury data through 2 consecutive seasons at 13 high schools. Injury data consisted of injury status, frequency, severity, practice versus game, time of season, and total time lost from football participation. A life event survey was administered at the end of each season to obtain total, negative, and positive life event scores.
Subjects:
A total of 331 varsity high school football players.
Measurements:
Data collected included athlete exposures, injury reports, and life event surveys. Statistical analysis was completed using the Wilcoxon rank sum W test, the Pearson χ2 test using an iterative proportional fitting procedure, and contingency χ2 test.
Results:
Total and negative life change measures significantly affected injury status and frequency of injury (P < .05). However, they did not reflect differences in severity of injury or time lost due to injury, and the positive life change measure was not associated with significant differences for any injury factor (P > .05). Preseason injury rates were significantly higher than season and playoff injury rates (P < .05).
Conclusions:
High school football players who experience high degrees of total and negative change were at greater risk of becoming injured and of sustaining multiple injuries. Playing situation and time of season also affected risk of injury.
Keywords: stress, sports psychology, epidemiology
Stress has been defined as any disruption, change, or adjustment in a person's mental, emotional, or physical well-being caused by an external stimulus, either physical or psychological.1,2 It has long been recognized that the stress produced by life events has a bearing on emotional health in people of all age groups.1 However, prolonged stress or stressful events have recently been observed to have an effect on physical health as well.1,3,4
In 1988, Andersen and Williams5 proposed a theoretical model that explained the relationship between stressful events and occurrence of injury. Previous researchers had not considered the complex relationship between potentially stressful athletic situations and resulting injury. This model was designed to illustrate this relationship. Williams and Andersen updated the model in 1998 to more clearly illustrate the relationships among the contributing factors (Figure).6
Figure 1.

A model of stress and athletic injury. Reprinted by permission.6
At the core of the model is the stress response to potentially stressful situations.5,6 This response is similar to that described in previous models1,2 but is divided into 2 aspects. The first aspect is the cognitive appraisal of the situation: the demands, resources, and consequences of the situation. The second aspect of the stress response is the physiologic and attentional responses: increased general muscle tension, narrowing of the visual field, and increased distractibility.
Prolonged stress can lead to chronic muscle tension as a form of direct defense.1,5 This is a result of the constant tensing of the muscles in the attempt to guard the body from the stressor. The increased muscle tension can lead to tension headaches, migraine headaches, and backaches.1,2 Generalized peripheral muscle tension may leave an athlete more susceptible to muscle strains. Williams et al7 reported that individuals with high life stress experienced greater peripheral narrowing (awareness of activities surrounding an athlete) and trait anxiety when placed in a stressful, dual-task laboratory situation. This increased peripheral narrowing is potentially hazardous when an athlete is placed in a high-stress, high-risk activity such as football. Lysens et al8 argued that stress related to life change may lead to a potentially dangerous blocking of adaptive responses in risky situations.
The Andersen and Williams5,6 model differs in its description of the stress-injury relationship because of its consideration of individual factors, such as personality traits, history of stressors, and coping resources, which may alter or affect the stress response. This model indicates that individual factors will determine the severity of the stress response to a particular situation,5,6 which may then increase an athlete's risk of being injured.9
The relationship between life events and incidence of injury has been studied extensively in collegiate football players.10–13 However, to our knowledge, only Coddington and Troxell14 have examined the relationship between life events and high school football. Their study was limited by 3 factors. The first factor was the size of the sample (n = 114). The second problem occurred in the reporting of injuries. The coaches were responsible for injury reporting, as opposed to qualified personnel such as certified athletic trainers (ATCs) or physicians. The third factor was that the researchers used a general life event questionnaire rather than a questionnaire designed for an athletic population. The authors stated in the study that its results should only be considered as a pilot study.14 However, it appears that no researcher has attempted to follow up this pilot study.
The primary purpose of our study was to assess whether the stress-injury relationship identified in collegiate football players also existed in the high school setting. A secondary goal of the study was to further reveal factors predisposing high school football players to injury.
METHODS
Experimental Design
We collected data prospectively during the 1995 and 1996 football seasons. At the end of the season, each athlete completed a modified Life Events Survey for Collegiate Athletes (LESCA).15 The independent variable for this study was the score on the modified LESCA. The modified LESCA was analyzed according to the number of events the athlete reported having occurred during the previous year and the effect the events had on the athlete. Totals were calculated for the cumulative effect of negative events, positive events, and all events. The dependent variables were the injury data points.
Subjects
Subjects were members of the varsity football teams from 13 high schools in 4 counties in Florida. These schools were chosen due to the availability of ATCs to aid in injury data collection. The schools ranged in size classification from 2A to 6A. Class 1A schools were not included because they do not sponsor football programs. The University of Florida Institutional Review Board approved this study. The study was explained to all eligible participants, and informed consent was obtained from those athletes willing to participate. Parental signatures authorizing participation were required for minor athletes. A total of 331 athletes in grades 8 through 12 chose to participate.
Instruments
The life events questionnaire used in this study was a modified version of the LESCA,15 which was initially designed by Petrie in 1992. Sixty-nine questions were chosen from an initial master list of 109 events based on frequency of agreement among expert raters. The interrater agreement was 0.81 for those events considered most relevant to collegiate athletes.15 Test-retest correlations were significant (P < .001) at 1 week and 8 weeks for all 3 life stress scores, indicating reliability of the measure.15
The LESCA was modified, with permission from the author, to make it appropriate for use with a high school athletic population. The scale was reviewed by ATCs working with high school athletes and by high school athletes who would not be a part of the study. Further refinements were made based on their input. After the modifications, 3 faculty members at the University of Florida reviewed the scale and determined it to have face validity.
The modified LESCA consisted of 65 general and athletic specific life events. The instructions call for the athlete to check each event experienced during the last year and indicate the overall effect of the event on his life. Effect is rated on a scale from −4, indicating an extremely negative effect, to +4, indicating an extremely positive effect. The modified LESCA was analyzed according to the number of events that occurred to an athlete and the effect the events had on the athlete. The survey was scored according to the instructions for the original survey.15 Negative and positive life event scores were calculated by summing the effect scores of those events rated undesirable (negative) and desirable (positive). Adding the absolute values of the negative and positive scores determined total life event scores.
Procedures
At the beginning of preseason practices, a roster was made and each athlete was assigned a subject number, which was known only to the ATC at each site. Each school was assigned a code number. The combination of the school code and the subject number formed the subject identification number. The subject identification number was the only form of identification on the participation logs, life event survey, and injury questionnaire.
Throughout the season, the ATC at each site tracked athlete exposures (AEs) and injury data. Athlete exposure was defined as any situation, either game or practice, in which the athlete was at risk for injury.16 Athlete exposure logs were completed each day, indicating the level of participation for each athlete. These levels included full participation, present but not participating, and not present.
We defined injury as any condition treated by the ATC that required modification of participation for the remaining time in the same practice or game or that resulted in the athlete's inability to participate in football for at least 1 day after injury.9,13 All head injuries and dental injuries were reported, regardless of their effect on participation. Severity of injury was defined by 2 methods. The first definition was based on time lost,17 and the second used anatomical structure damage.18 A follow-up injury questionnaire was completed for all incidents fitting this definition of injury. These questionnaires were completed only for injuries that were directly attributable to football participation.
At the end of each season, participants were asked to complete the modified LESCA. Standardized instructions were read to the participating athletes by the ATC at the site. When the athlete completed the scale, he placed it directly into an envelope, which maintained confidentiality. Only the researcher viewed the results of the surveys.
Statistical Analysis
The independent variable for this study was the score on the modified LESCA. Three levels of this variable were analyzed: overall negative, positive, and total life change scores. The third level (total score) is a combination of levels 1 and 2. The dependent variable was injury status. The number of levels varied with the injury factor being analyzed. Levels included injured or uninjured, frequency of injury, severity of injury, and total time lost from participation due to injury.
Injury rates were calculated by dividing the number of injuries by the number of exposures and multiplying by 1000. These rates were calculated for the total sample and for the entire season. We used the Pearson χ2 test for comparison of injuries that occurred in practices and games and time of injury within the season. To adjust for differences in AEs, expected frequencies were generated through an iterative, proportional-fitting procedure.19 Expected frequencies were adjusted because of the difference in the number of practice and game exposures and the different numbers of AEs experienced by each athlete.
We used descriptive and inferential statistics to assess injury frequencies and severities. Descriptive analyses included injury history, injury severity, mechanism of injury, time lost due to injury, and playing situation (game versus practice). Comparative analyses were conducted between athletes with high and low degrees of negative, positive, and total life change. Athletes were placed in high and low life change groups according to the reported score in relation to the median score.
The Wilcoxon rank sum W test was used to identify possible differences in the life event scores for injured and uninjured athletes. This test ranks the individual survey scores and then looks at differences in relation to the mean ranks rather than the scores themselves. We chose this test to eliminate the effect of outlying scores. Athletes were then divided into high and low life change groups based on their life change score in relation to the median score. The median was also chosen to eliminate the effect of outlying scores. These subgroups were analyzed by a contingency χ2 test20 to determine differences for injury factors. These factors included injury status, frequency of injury, severity of injury, and total time lost during the season due to injury. All hypotheses were tested in the null form. Data were analyzed with the level of significance set at P < .05 using the Statistical Package for the Social Sciences for Windows (version 6.1, Chicago, IL).
RESULTS
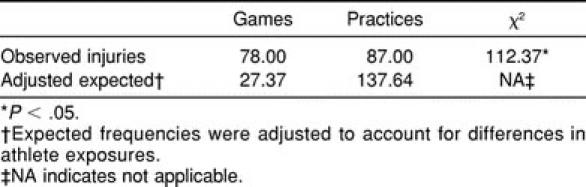
A total of 165 injuries were sustained by 121 (36.6%) of the 331 subjects who experienced 21 054 AEs throughout 2 seasons. The total injury rate for this study during the 1995 and 1996 seasons was 7.84 injuries per 1000 AEs. Of the 165 injuries reported during the study, 87 occurred in practice and 78 occurred during games. Practices had an injury rate of 4.95 injuries per 1000 AEs, whereas the game rate was more than 4 times higher, at 22.34 injuries per 1000 AEs. The χ2 analysis revealed a significant difference between the observed and expected injury frequencies (P < .05, Table 1). This difference appears attributable to the increased game injury rate when adjusted for AEs. Although accounting for only 16% of all AEs, games were responsible for 47.3% of all injuries.
Table 1.
Injuries in Practices and Games
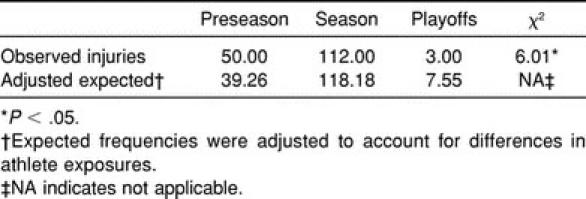
We analyzed time of injury during the season to determine if injury rates increased toward the end of the season. We speculated that the increased stress of late-season games might lead to higher injury rates. However, we found no significant differences between incidence of injury during the first and second halves of the season (χ2 = 3.76, P > .05). Analysis comparing preseason, season, and playoff injury rates revealed significant differences (P < .05, Table 2), apparently attributable to the preseason injury data. The preseason injury rate was 9.98 injuries per 1000 AEs, compared with the season and playoff rates, which were 7.43 and 3.1, respectively.
Table 2.
Injury Frequency in Preseason, Season, and Playoffs
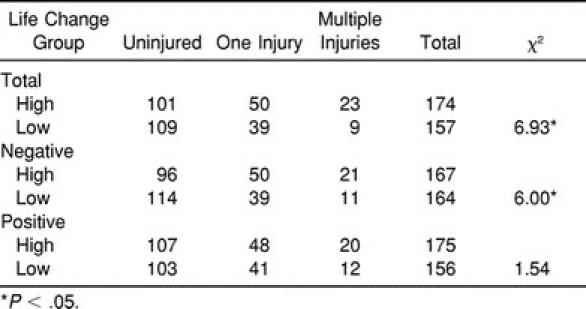
Of the 121 injured athletes, 89 (73.6%) sustained only 1 injury, 23 (19.0%) sustained 2 injuries, and 9 (7.4%) were injured 3 or more times during their season. The total and negative life event scores affected the athlete's injury status (injured or uninjured) and injury frequency. The Wilcoxon rank sum W and contingency χ2 tests each indicated that those athletes with higher degrees of total and negative life change were more likely to become injured (P < .05, Table 3). Athletes in the high life change groups appeared more likely to sustain multiple injuries (P < .05, Table 4). Similar results were not observed for the positive life event data.
Table 3.
Life Change Groups for Injured and Uninjured Athletes
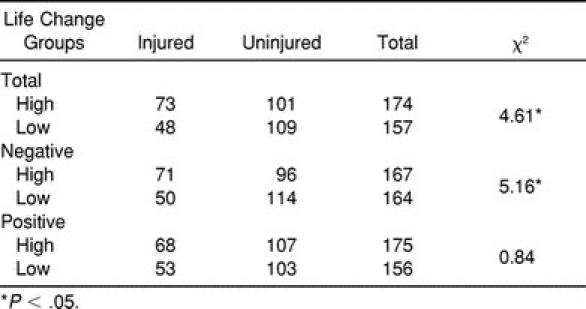
Table 4.
Frequency of Injury in Relation to Life Change Groups
For the purposes of this study, we defined injury severity in 2 ways. The first definition was based on anatomical structural damage.18 The second definition used time lost from participation due to injury.17 Analysis did not reveal significant differences in severity of injury between the low and high life event score groups for total, negative, or positive life change (P > .05).
We hypothesized that the life event score would significantly affect an athlete's chance of becoming injured and his chance of sustaining multiple injuries. If this were true, we expected that injured athletes in the high life change groups would miss more time during a season because of injury than athletes in the low life change groups. Athletes were placed in 3 groups based on total time lost: athletes missing 1 to 5 days, 6 to 10 days, or more than 10 days of participation. These groups provided sufficient data points in each cell. Comparison of the high and low life change groups for total, negative, and positive life change revealed no significant differences in total time lost (P > .05).
DISCUSSION
Each year, more than 3 million high school students actively participate in boys' sports programs.21 This number does not include students participating in city, county, or other recreational leagues. In 1994, 13 877 schools had competitive football teams, accounting for 955 247 participants.21 Football participants accounted for almost one third of all boys' sports participants. In 1994, Florida alone reported 374 schools with football teams and 29 911 participants. Similarly, football accounted for almost one third of the 102 775 boys' sports participants for the year.22 Despite extensive research on college athletes, relatively little literature is available with respect to this large population of high school football players.
The significance of this study lies in the identification of a stress-injury relationship in the high school football player. This finding is an important step that must be taken in the process of assessing variables that may be moderated to prevent injury, but it does not constitute the entire story.
The stress-injury model has 3 components: the stressor, the stress response, and the injury.5,6 The key to prevention is modifying 1 of the components of the model. In this type of prevention, it is almost impossible to prevent the stressor from occurring, and it is not feasible to remove the athlete from practice or games because of fear of injury. Therefore, the research and focus must be on the stress response. Once the stress-injury relationship was identified in college-aged subjects, researchers continued studies to identify means of altering the stress response, such as improving coping skills, increasing social support, and moderating personality traits. Injury prevention methods can be developed for these issues in the stress-injury response.
Current Research
The current game-practice data support previous football epidemiologic research. DeLee and Farney,23 Prager et al,24 Halpern et al,25 and Zemper26 all reported that athletes were at greater risk of injury during games than practices; however, previous authors of studies of life events and incidence of injury have not reported data regarding time of injury. This difference may be related to the fact that games are a more stressful exposure situation than are practices. The stress of game situations, in addition to preexisting stress levels, may make athletes more susceptible to injury. Although full-contact practices are common in football, the intensity of the contact often does not equal that in games. If the athlete is not focused on the task at hand, he may be more likely to become injured in a game, which is even less controlled than a full-contact practice. Finally, the stress response of peripheral narrowing could be particularly dangerous in game situations. The narrowing of the field of vision could leave the athlete at greater risk of being injured because he is not as aware of the situation surrounding him.
We did not find significant differences in injury frequency and rate when comparing the first and second halves of the season. However, when comparing preseason, season, and playoff data, a significant difference was noted, most likely related to the preseason injury rate and the week 2 data. In this study, week 2 had both the highest frequency of injury (n = 25) and the highest injury rate (16.19 per 1000 AEs). The reason for this was probably more related to conditioning than to stress. The high schools participating in this study limit the first 3 days of week 1 to no pads and no contact. Therefore, only the last 2 days of week 1 place the athlete in a full-contact, high-risk situation. During week 2, athletes are practicing in full pads and frequently practice 2 or 3 times a day. Many athletes do not participate in summer conditioning and are, therefore, out of shape and possibly at greater risk of injury.5 However, this can also be viewed from the aspect of stress and injury. Except for the first 3 days, preseason practices are typically very fatiguing. Coaches are concerned with the teaching and practicing of plays and exposing the athletes to situations that will be experienced throughout the year. Coaches typically expect the athletes to learn a great deal in a short amount of time. The athlete's appraisal of the demands of these stressors and methods of modifying the stressors could affect the incidence of injury.
The life stress injury data from this study agree with previous research findings in collegiate football players.10–13 These authors reported that athletes with high degrees of life change were more likely to become injured than those with low levels. Of the 121 injured athletes in this study, 73 athletes (60.3%) reported total life events scores above the median score.
Our study does not support the only previous study to our knowledge that was conducted with high school football players. Coddington and Troxell14 noted significant relationships between injuries and those athletes scoring high on the object loss score of the Life Event Scale for Adolescents. However, they did not report an association between injury and the overall life event score. Possible reasons for this are related to the limitations mentioned earlier: small subject population, injury reporting by coaches, and use of a generalized life event measure. Our study was designed to improve on each of these limitations.
Petrie,15 in his study of college gymnasts, reported that athletes with higher life event scores experienced more minor injuries than athletes with lower scores. The current study data regarding severity of injury support the findings of Cryan and Alles,13 who reported that athletes with higher stress scores were not at greater risk of sustaining a serious injury. In our study, frequencies and rates of severity for the high life change group were not significantly different than those for the low life change group. They were also consistent with the total population. Our results appear to indicate that life event scores, although related to the chance of becoming injured and the chance of sustaining multiple injuries, are not related to the severity of the injury sustained.
This study's results regarding frequency of injury were also supported by the research of Cryan and Alles.13 These authors reported that athletes in a high stress score group were more likely to become injured 1 or 2 times during the football season but not 3 or more times. They concluded that those athletes with a high degree of life change were more susceptible to multiple injuries during the season. One historical factor that acted directly on the stress response is previous injuries.5,6 An individual's past stressors directly influence the stress response to potentially stressful athletic situations. In the model of stress and athletic injury,5 one component of “history of stressors” is previous injury. A previous injury predisposes the athlete to reinjury; however, research suggests that the history of injury acts on the stress response, which can also predispose the athlete to a new injury.
Petrie15 reported that athletes with higher negative life event scores missed significantly more days because of injury than those with lower scores. Our data did not support this conclusion. This difference is likely attributable to the variant and individual nature of injury. The amount of time lost due to an injury relies on many factors, such as the nature of injury, severity, position of the athlete, and individual rates of healing.27 All of these factors interact, making it difficult to determine which is most directly influencing the rate of return to sport.
Limitations of Study
The primary limitation to application of this research is the lack of reliability and validity data for the modified LESCA. The original LESCA consisted of 69 general and athletic life events. Because it was designed for a college athletic population, we modified it for use by high school athletes. The instructions for completion and scoring were not changed. In total, 4 events were deleted, and 6 were modified to make the language applicable. As an example of the modifications made, the original “Receiving an athletic scholarship” was modified to “Being recruited for an athletic scholarship.” Four questions were deleted because an appropriate modification could not be determined. An example of the events deleted was “Conflict with roommate.”15 During the review for face validity, we believed that the minor nature of the modifications had not affected the reliability of the original scale. However, because reliability testing was not performed on the modified LESCA, we do not know if this is actually the case.
CONCLUSIONS
Our study helps to establish a stress-injury relationship for high school football players. The main conclusions that can be drawn from this study include the following: (1) high school football players with high levels of total and negative life stress were more likely to become injured; (2) high school football players with high levels of total and negative life stress were more likely to sustain multiple injuries; (3) high school football players were more likely to become injured in a game than in practice; and (4) high school football players were at greater risk of injury during the preseason.
The results of this study are very important to the coach and athletic trainer, who often serve in multiple roles, including teacher, counselor, and friend. The multifaceted roles of these individuals often mean that they are in the best position to identify athletes at risk and to help the athletes. They see the athlete daily and are often aware of problems the athlete is experiencing. With the identification of the stress-injury relationship and further identification of effective moderating factors, coaches and athletic trainers will be important links in the chain of prevention of injury.
ACKNOWLEDGMENTS
We thank all the ATCs, coaches, and athletes who assisted with this study. In addition, we thank John Hartzell for his statistical assistance. We also thank Tom Kaminski, PhD, ATC, for his assistance during the editing process. Finally, a sincere thank you to the National Athletic Trainers' Association Research and Education Foundation for granting the funding to continue the data collection for the second season.
REFERENCES
- 1.Cottrell RR. Stress Management. Guilford, CT: The Dushking Publishing Group; 1992. [Google Scholar]
- 2.Bieliauskas LA. Stress and Its Relationship to Health and Illness. Boulder, CO: Westview Press; 1982. [Google Scholar]
- 3.Creed F. Life events and physical illness. J Psychosom Res. 1985;29:113–123. doi: 10.1016/0022-3999(85)90032-7. [DOI] [PubMed] [Google Scholar]
- 4.Kerr G, Minden H. Psychological factors related to the occurrence of athletic injuries. J Sport Exerc Psychol. 1988;10:167–173. [Google Scholar]
- 5.Andersen MB, Williams JM. A model of stress and athletic injury: prediction and prevention. J Sport Exerc Psychol. 1988;10:294–306. [Google Scholar]
- 6.Williams JM, Andersen MB. Psychosocial antecedents of sport injury: review and critique of the stress and injury model. J Appl Sport Psychol. 1998;10:5–25. [Google Scholar]
- 7.Williams JM, Tonymon P, Andersen MB. Effects of life-event stress on anxiety and peripheral narrowing. Behav Med. 1990;16:174–181. doi: 10.1080/08964289.1990.9934606. [DOI] [PubMed] [Google Scholar]
- 8.Lysens R, Vande Auweele Y, Ostyn M. The relationship between psychosocial factors and sports injuries. J Sports Med Phys Fitness. 1986;26:77–84. [PubMed] [Google Scholar]
- 9.Williams JM, Hogan TD, Andersen MB. Positive states of mind and athletic injury risk. Psychosom Med. 1993;55:468–472. doi: 10.1097/00006842-199309000-00010. [DOI] [PubMed] [Google Scholar]
- 10.Holmes TH. Football Injuries: Papers Presented at a Workshop. Washington, DC: National Academy of Sciences; 1970. Psychological screening; pp. 211–214. [Google Scholar]
- 11.Bramwell ST, Masuda M, Wagner NH, Holmes TH. Psychological factors in athletic injuries: development and application of the social and athletic readjustment rating scale (SARRS) J Hum Stress. 1975;1:6–20. doi: 10.1080/0097840X.1975.9940404. [DOI] [PubMed] [Google Scholar]
- 12.Passer MW, Seese MD. Life stress and athletic injury: examination of positive versus negative events and three moderator variables. J Hum Stress. 1983;9:11–16. doi: 10.1080/0097840X.1983.9935025. [DOI] [PubMed] [Google Scholar]
- 13.Cryan PD, Alles WF. The relationship between stress and college football injuries. J Sports Med Phys Fitness. 1983;23:52–58. [PubMed] [Google Scholar]
- 14.Coddington RD, Troxell JR. The effect of emotional factors on football injury rates: pilot study. J Hum Stress. 1980;6:3–5. doi: 10.1080/0097840X.1980.9936100. [DOI] [PubMed] [Google Scholar]
- 15.Petrie TA. Psychosocial antecedents of athletic injury: the effects of life stress and social support on female collegiate gymnasts. Behav Med. 1992;18:127–138. doi: 10.1080/08964289.1992.9936963. [DOI] [PubMed] [Google Scholar]
- 16.Smith RE, Ptacek JT, Smoll FL. Sensation seeking, stress, and adolescent injuries: a test of stress-buffering, risk-taking, and coping skills hypotheses. J Pers Soc Psychol. 1992;62:1016–1024. doi: 10.1037//0022-3514.62.6.1016. [DOI] [PubMed] [Google Scholar]
- 17.Powell JW. National High School Athletic Injury Registry. Am J Sports Med. 1988;16(suppl 1):S134–135. doi: 10.1177/03635465880160s126. [DOI] [PubMed] [Google Scholar]
- 18.Reid DC. Sports Injury Assessment and Rehabilitation. New York, NY: Churchill Livingstone; 1992. p. 226. [Google Scholar]
- 19.Laird N, Olivier D. Covariance analysis of censored survival data using log-linear analysis techniques. J Am Stat Assoc. 1981;76:321–340. [Google Scholar]
- 20.Buncher CR. Statistics in sports injury research. Am J Sports Med. 1988;16(suppl 1):S57–S62. doi: 10.1177/03635465880160s114. [DOI] [PubMed] [Google Scholar]
- 21.National Federation of State High School Associations. Kansas City, MO: National Federation of State High School Associations; 1995. 1994–95 Athletics Participation Survey. [Google Scholar]
- 22.Florida High School Activities Association. Gainesville, FL: Florida High School Activities Association; 1995. 1994–95 FHSAA Summary Sports Participation Survey. [Google Scholar]
- 23.DeLee JC, Farney WC. Incidence of injury in Texas high school football. Am J Sports Med. 1992;20:575–580. doi: 10.1177/036354659202000515. [DOI] [PubMed] [Google Scholar]
- 24.Prager BI, Fitton WL, Cahill BR, Olson GH. High school football injuries: a prospective study and pitfalls of data collection. Am J Sports Med. 1989;17:681–685. doi: 10.1177/036354658901700516. [DOI] [PubMed] [Google Scholar]
- 25.Halpern B, Thompson N, Curl WW, Andrews JR, Hunter SC, Boring JR. High school football injuries: identifying the risk factors. Am J Sports Med. 1987;16(suppl 1):S113–S117. doi: 10.1177/03635465880160s122. [DOI] [PubMed] [Google Scholar]
- 26.Zemper ED. Injury rates in a national sample of college football teams: a 2-year prospective study. Physician Sportsmed. 1989;17(11):100–113. doi: 10.1080/00913847.1989.11709915. [DOI] [PubMed] [Google Scholar]
- 27.Noyes FR, Lindenfeld TN, Marshall MT. What determines an athletic injury (definition)? Who determines an injury (occurrence)? Am J Sports Med. 1988;16(suppl 1):S65–S68. doi: 10.1177/03635465880160s116. [DOI] [PubMed] [Google Scholar]