

Abstract
Objectives
Urinary stones are heterogeneous in their fragility to lithotripter shock waves. As a first step in gaining a better understanding of the role of matrix in stone fragility, we measured extractible protein in COM stones that were extensively characterized by micro-computed tomography (micro CT).
Methods
Stones were scanned using micro CT (Scanco mCT20, 34 μm), and were ground and protein extracted using four methods: 0.25M EDTA, 2% SDS reducing buffer, 9M urea buffer, and 10% acetic acid. Protein was measured using NanoOrange. SDS extracts were also examined using polyacrylamide electrophoresis (PAGE).
Results
Extracted protein was highest with SDS or urea methods (0.28±0.13 and 0.24±0.11%, respectively), and lower using the EDTA method (0.17±0.05%, p<0.02). Acetic acid extracted little protein (0.006±0.002%, p<0.001). Individual stones were significantly different in extractability of protein by the different methods, and SDS-PAGE revealed different protein patterns for individual stones. Extracted protein did not correlate with x-ray lucent void percentage, which ranged from 0.06 to 2.8% of stone volume, nor with apatite content.
Conclusions
Extractible stone matrix protein differs for individual COM stones, and yield is dependent on the extraction method used. The presence of x-ray lucent voids or minor amounts of apatite in stones did not correlate with protein content. The amounts of protein recovered were 5 to 10 times lower than that reported by Boyce, showing that these methods extracted only a fraction of the protein bound up in the stones. The results suggest that none of the methods tested will be useful for helping to answer the question of whether matrix content differs among stones of differing fragility to lithotripter shock waves.
Keywords: urolithiasis, kidney calculi, organic matrix, urinary stones, urinary proteins, calcium oxalate monohydrate
Introduction
Kidney stones are highly variable in their composition, structure, and susceptibility to shock waves in lithotripsy (SWL),1 and it is reasonable to hypothesize that variability in stone fragility is related to differences in stone structure.2,3 Experimental data to support this concept include those of Léger et al., who found that stones that were highly organized in their crystalline structure broke more easily than those that were less organized.4 More recently, Cleveland and Sapozhnikov describe theoretical calculations that support the overall concept that it is in part the internal structure of stones that determines their fragility to lithotripter shock waves.5 Several workers have extended this concept to propose that stone structure that is related to stone fragility can be detected using computed tomography (CT).6–8 If stone structure that is relevant to the success of SWL can be visualized by CT, then failure of lithotripsy to break a stone—and the associated risk to patients9—could be avoided.
An exception to the concept that stone fragility should be reflected in CT-visible structure was recently suggested from lithotripsy data obtained in veterinary stones. When cat and dog stones were size- and composition-matched, cat stones were always more resistant to SWL than were dog stones, and this was true even when the matched pairs appeared to have identical internal structure, as judged by micro computed tomography (CT).10 One hypothesis put forth in this work to explain this difference in fragility between stones that looked structurally identical was that the cat and dog stones might have different amounts of organic matrix that could be invisible to CT analysis, and that this matrix could act as an adhesive element to decrease stone fragility.
As a first step in testing this hypothesis, we have performed experiments with human kidney stones (composed of calcium oxalate monohydrate, COM) to determine an optimal method for extracting and quantitating the amount of protein in stones. The results suggest that individual human COM stones differ markedly in their content of extractible protein as well as in their relative susceptibility to different extraction reagents. Thus, there is not an obvious ‘best’ method for measuring the protein content of stones, and work will have to be done in this area before any further testing of this hypothesis can be accomplished.
Methods and Materials
Human urinary stones were obtained in patient-deidentified form from a stone analysis laboratory (Beck Analytical Services, Indianapolis, IN). All stones had been labeled as being composed exclusively of COM, as determined using microscopic and IR spectroscopic methods on either a portion of the stone used in this study, or on a cohort stone from the same patient case. Micro CT was used to examine the structure of stones to verify purity of composition and to determine the percentage of each stone occupied by low-attenuation regions (voids).11 Briefly, stones were imaged using a Scanco mCT20 (Scanco Medical AG, Bassersdorf, Switzerland) at a resolution that yielded 34 μm cubic voxels in the three dimensional reconstructions. Voids were quantitated using the Scanco software.12
For protein extraction, dry stones were crushed with a mortar and pestle to a fine powder. Extraction methods utilized a commonly used EDTA (ethylene diamine tetraacetic acid) buffer,13,14 an SDS (sodium dodecyl sulfate) reducing buffer,15 a cell lysis buffer containing 9M urea and a reducing agent,16 and a 10% acetic acid solution.17
For the EDTA method, 100 mg stone powder was mixed (48 hr, 4ºC, using end-over-end rotation) with 1.5 mL EDTA buffer (0.25 M EDTA, pH 8.0, 0.02% sodium azide, and 1 mM benzamidine hydrochloride) and centrifuged (10,000g, 5 min, 4ºC). The supernatant was retained and the remaining stone powder was resuspended in another 1.5 mL of the buffer and mixed for another 72 hours before being centrifuged again. The two supernatants were pooled and dialyzed (12,000–14,000 MWCO) against 1.5 L dialysis buffer (8 M urea, 10 mM Tris, pH 7.0) for eight days at 4ºC. Dialysis buffer was replaced daily.
For the SDS method, 100 mg stone powder was mixed with 400 μL SDS reducing buffer (0.06 M TRIS HCl, pH 6.8, 10% glycerol, 5% beta-mercaptoethanol, and 2% SDS) and heated (100ºC, 30 min). Samples were centrifuged (700g, 15 min, 4ºC) and the supernatant was collected. This process was repeated for the pellet two more times. After the third centrifugation, all three supernatants were pooled and dialyzed as described above.
For the urea method, 100 mg stone powder was added to 500 μL urea buffer (9M urea, 4% IGEPAL CA-630 detergent, 0.5% ampholytes (pH 3–10), and 1% dithiothreitol) and vortexed every 10 min over a period of 7 hr. The sample was stored in a refrigerator overnight. The following morning, the samples were vortexed every 10 min over a period of 2 hr and then centrifuged (12,000g, 15 min, room temperature). The supernatant was retained and dialyzed as described above.
For the acetic acid method, 100 mg stone powder was vortexed with 500 μL 10% acetic acid and incubated for 30 min. Samples were centrifuged (2,000g, 20 min, 4ºC) and the supernatant was retained and dialyzed as above.
The concentration of protein extracted from stones was determined using the NanoOrange method (Molecular Probes, Eugene, OR). This fluorometric assay is largely insensitive to chemical or pigment interference, and was chosen because the presence of variable color in stone extracts has been cited as a difficulty for determining protein content.14,18 Fluorescence was measured using a Turner Model 112 Fluorometer (Sequoia-Turner Corp., Mountain View, CA). Standard curves were constructed using bovine serum albumin.
For polyacrylamide gel electrophoresis (SDS-PAGE) 10 mg stone powder was suspended in 400 μL electrophoresis loading buffer (0.5 M Tris-HCl, pH = 6.8, 10% glycerol, 10% SDS, 5% beta-mercaptoethanol, 0.05% bromophenol blue). Samples were vortexed and heated (100ºC, 10 min) two times. Samples were then centrifuged (12,000g, 10 min, 22ºC) and the supernatant retained. The pellet was centrifuged one final time (12,000g, 1 min, 22ºC), and the supernatants pooled. Preliminary samples run on SDS-PAGE showed considerable smearing, suggesting the presence of high salt and/or high glycosaminoglycan content. Thus, 50 μL aliquots were processed using a ReadyPrep 2-D Cleanup Kit (Bio-Rad, Hercules, CA) and the resulting pellet was re-suspended in 100 μL loading buffer. Samples were vortexed, heated for 4 min, vortexed, centrifuged, and loaded onto a polyacrylamide gel. SDS-PAGE was performed using 12% Tris-HCl ReadyGel precast gels (Bio-Rad, Hercules, CA), and gels were stained with silver using the ProteoSilver Kit (Sigma-Aldrich, Saint Louis, MO).
Statistics
Data were analyzed by analysis of variance (anova) and the Tukey-Kramer HSD test, as appropriate. Differences were considered significant at p<0.05. Data are presented as mean ± standard deviation.
Results
The four methods used for extracting stone protein yielded different results (Figure 1). Acetic acid removed very little protein from any stone (0.007%), dramatically less than the other methods. Comparing the other three methods, EDTA removed less protein (0.17%) than did either the urea (0.24%) or the SDS method (0.28%), which were not different from one another. However, individual stones differed significantly in their susceptibility to extraction by a given method (overall, p<0.0001), such that no one method extracted the most protein from every stone. Specifically, for the eight stones for which extracts were done for all three of the more successful methods, EDTA extracted the most protein for one of the stones, and SDS for two. For three stones, these methods were statistically indistinguishable. For the remaining two stones, one yielded similar amounts of protein to EDTA and SDS, with both of those greater than urea, while the other yielded similar amounts to SDS and urea, with both greater than EDTA.
Figure 1.
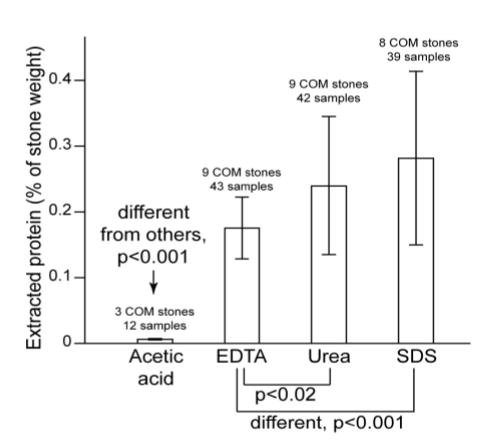
Extractible protein from calcium oxalate monohydrate (COM) stones, using four different methods. Acetic acid was different from others by anova. Other three methods were compared using Tukey-Kramer HSD test.
Stones were also examined for their structure by micro CT. Examples of the images obtained are shown in Figure 2. All stones were shown by micro CT attenuation values to be composed predominantly of COM,11 but two of the stones contained visible regions of apatite (Figure 2b) and in general the stones differed in the quantity and morphology of visible void regions (Figure 2c and 2d).
Figure 2.
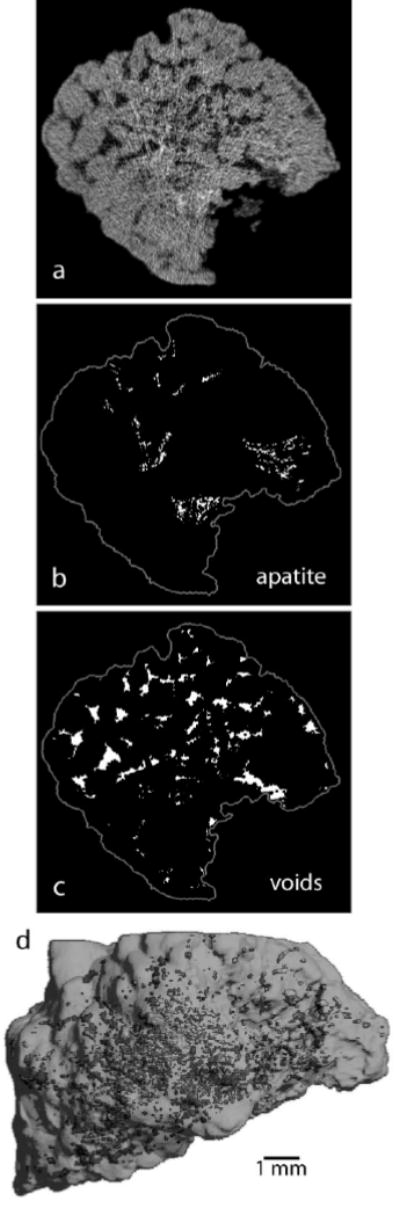
Visualization of COM stone structure using micro computed tomography (CT). a: Micro CT slice. b: Regions of apatite (calcium phosphate) within slice, as determined by x-ray attenuation. c: Void regions within slice. d: Three-dimensional reconstruction of stone with void regions shown as highlighted spots within stone.
It is possible for stones to differ in their protein content in a manner that varies with stone structure/composition, and void regions have been shown to be especially rich in matrix content.19 Specifically, we hypothesized that the presence of voids and/or apatite regions could correlate with altered matrix protein content. Figure 3 shows seven COM stones that were studied both for quantity of extracted protein and electrophoretic patterns, and whose void contents varied from 0.06% to 2.76% of total stone volume. Stones 9604 and 26449 additionally showed regions of apatite (2.8 and 4.0% of total stone volume, respectively). The results showed no correlation with the content of voids or apatite in the stones. Moreover, the electrophoretic pattern of each stone was distinct from all of the others, with several stones yielding protein bands that were absent in the other stones.
Figure 3.
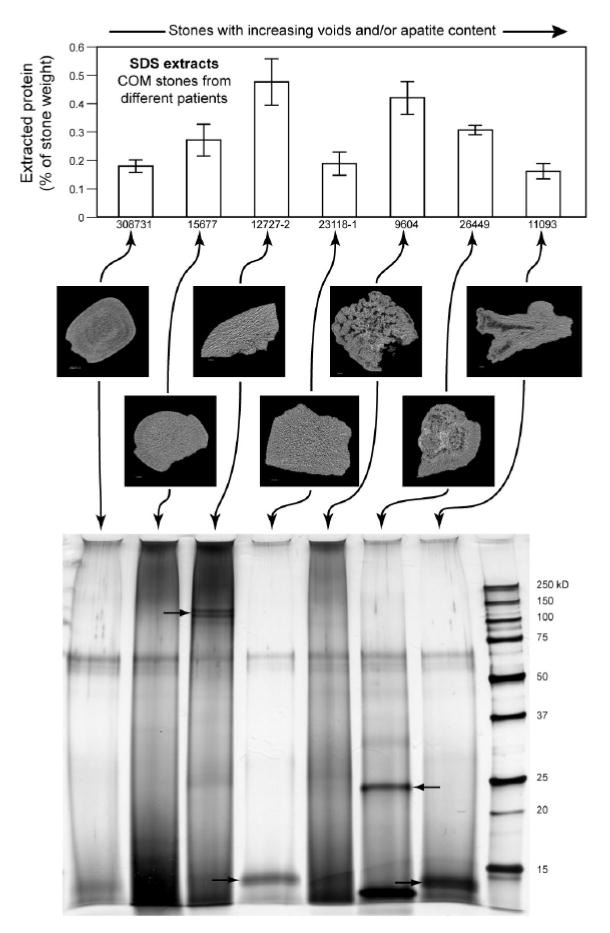
Results of protein extraction (using SDS method) on 7 COM stones followed by protein determination and polyacrylamide gel electrophoresis. Stones are not all the same with regard to protein content (anova, p<0.0001), and the same results are shown qualitatively in the gel, where the stones with greater measured protein content also showed darker bands. Arrows in gel image indicate unique protein bands not shared by other stones.
Discussion
Boyce, who published some of the earliest quantitative data on the organic matrix present in urinary stones, was convinced that the matrix of the stone was primary in stone formation.20 That is, he believed that a matrix body was first deposited in the urinary system (perhaps through secretions from the urothelium) and that this matrix body subsequently mineralized, gaining crystals of whatever poorly soluble inorganics were in high concentration in the urine. It is now accepted that crystallization is the primary requirement for the development of a stone,21 and the addition of organic matrix to the crystals is either incidental22 or specific,23 in which case urine proteins and carbohydrates may be accelerative or inhibitory to crystal formation and stone growth.24 Nevertheless, Boyce’s result for measuring the amount of organic matrix in stones (mean value of 2.5% by weight25) is continually cited, as the matrix content was determined in their studies in pooled batches of large numbers of stones (88 calcium oxalate stones in one group) by ashing, or by complete acid hydrolysis followed by analysis of amino acids and sugars. More recent approaches have sought to determine protein content in smaller samples, or have been focused on identifying proteins present in the stones, and so have used different methods to extract protein from stones, but the insoluble nature of stones makes this a challenge.
For the purposes of the present study, our intent was to find a method for quantitating matrix in individual stones to see if matrix content would correlate with increased resistance to breakage by lithotripter shock waves. For this, we chose not to use the methods of Boyce, as individual stones are often so small that a gravimetric approach would be difficult. We tested four more recent methods of extracting matrix from stones, and used as test objects some relatively homogeneous calcium oxalate stones that were large enough to allow multiple runs with the different methods.
We found that the four methods did not extract the same amounts of protein from the stones, and that even the three more successful methods yielded a total protein extraction considerably less than the protein fraction found by Boyce (which was about 1.7%25), showing that these methods extracted only a fraction of the protein bound up in the stones. Nevertheless, such a method could still be useful for our purposes if it extracted a consistent portion of the stone matrix, such that it could be used to compare the relative amounts of matrix in different stones. Such does not seem to be the case here, because the stones responded to the extraction methods in a strikingly individual manner.
The individual behavior of these stones is apparently due to variation in the different protein forms extractible from the matrix, which was evident in their differential response to the methods used and in the electrophoretic patterns observed. This variation is like that reported by Stapleton et al., who showed wide variability in matrix extractability and electrophoretic patterns of human stones of varying composition in which the matrix was extracted using EDTA.14 The present result, showing wide variability in stones of very similar composition, confirms the conclusion that individual stones can differ dramatically in their extractible protein content. Whether this variability is due to differences in actual protein content or merely in which proteins are rendered insoluble in the matrix cannot be determined at the present time.
For the purposes of the present study, the results suggest that none of the methods tested will be useful for helping to answer the question of whether matrix content differs among stones of differing fragility to lithotripter shock waves, and some other method must be found to assess the possible relationship between stone matrix and stone fragility. One possibility would be to explore the extraction of matrix from fresh stones, as the drying of stones for study—commonly done for hundreds of years—may well denature matrix proteins in an unpredictable way.
Acknowledgments
We thank Gina Blackwell for technical assistance on this project. This work was funded by NIH R01DK59933.
References
- 1.Williams JC, Jr, Saw KC, Paterson RF, et al. Variability of renal stone fragility in shock wave lithotripsy. Urology. 2003;61:1092. doi: 10.1016/s0090-4295(03)00349-2. [DOI] [PubMed] [Google Scholar]
- 2.Dretler SP. Stone fragility—a new therapeutic distinction. J Urol. 1988;139:1124. doi: 10.1016/s0022-5347(17)42801-1. [DOI] [PubMed] [Google Scholar]
- 3.Dretler SP, Polykoff G. Calcium oxalate stone morphology: Fine tuning our therapeutic distinctions. J Urol. 1996;155:828. doi: 10.1016/s0022-5347(01)66319-5. [DOI] [PubMed] [Google Scholar]
- 4.Léger P, Daudon M, Magnier M. Expérience ≪in vitro≫ de lithotripsie pyézo-électrique à repérage ultra-sonique sur le lithotripteur EDAP LT 01. Journal d’Urologie. 1990;96:353. [PubMed] [Google Scholar]
- 5.Cleveland RO, Sapozhnikov OA. Modeling elastic wave propagation in kidney stones with application to shock wave lithotripsy. J Acoust Soc Am. 2005;118:2667. doi: 10.1121/1.2032187. [DOI] [PubMed] [Google Scholar]
- 6.Wang L-J, Wong Y-C, Chuang C-K, et al. Predictions of outcomes of renal stones after extracorporeal shock wave lithotripsy from stone characteristics determined by unenhanced helical computed tomography: a multivariate analysis. European Radiology. 2005;15:2238. doi: 10.1007/s00330-005-2742-9. [DOI] [PubMed] [Google Scholar]
- 7.Dretler SP, Spencer BA. CT and stone fragility. JEndourol. 2001;15:31. doi: 10.1089/08927790150500926. [DOI] [PubMed] [Google Scholar]
- 8.Williams JC, Jr, Kim SC, Zarse CA, et al. Progress in the use of helical CT for imaging urinary calculi. J Endourol. 2004;18:937. doi: 10.1089/end.2004.18.937. [DOI] [PubMed] [Google Scholar]
- 9.Evan AP, Willis LR, Lingeman JE, et al. Renal trauma and the risk of long-term complications in shock wave lithotripsy. Nephron. 1998;78:1. doi: 10.1159/000044874. [DOI] [PubMed] [Google Scholar]
- 10.Adams LG, Williams JC, Jr, McAteer JA, et al. In vitro evaluation of canine and feline calcium oxalate urolith fragility via shock wave lithotripsy. Am J Vet Res. 2005;66:1651. doi: 10.2460/ajvr.2005.66.1651. [DOI] [PubMed] [Google Scholar]
- 11.Zarse CA, McAteer JA, Sommer AJ, et al. Nondestructive analysis of urinary calculi using micro computed tomography. BMC Urology. 2004;4:15. doi: 10.1186/1471-2490-4-15. [DOI] [PMC free article] [PubMed] [Google Scholar]
- 12.Kim SC, Hatt EK, Lingeman JE, et al. Cystine: helical computerized tomography characterization of rough and smooth calculi in vitro. J Urol. 2005;174:1468. doi: 10.1097/01.ju.0000173636.19741.24. [DOI] [PubMed] [Google Scholar]
- 13.Dawson CJ, Grover PK, Kanellos J, et al. Inter-alpha-inhibitor in calcium stones. Clinical Science. 1998;95:187. [PubMed] [Google Scholar]
- 14.Stapleton AM, Dawson CJ, Grover PK, et al. Further evidence linking urolithiasis and blood coagulation: urinary prothrombin fragment 1 is present in stone matrix. Kidney International. 1996;49:880. doi: 10.1038/ki.1996.121. [DOI] [PubMed] [Google Scholar]
- 15.Siddiqui AA, Sultana T, Buchholz NP, et al. Proteins in renal stones and urine of stone formers. Urological Research. 1998;26:383. doi: 10.1007/s002400050073. [DOI] [PubMed] [Google Scholar]
- 16.Witzmann FA, Clack JW, Geiss K, et al. Proteomic evaluation of cell preparation methods in primary hepatocyte cell culture. Electrophoresis. 2002;23:2223. doi: 10.1002/1522-2683(200207)23:14<2223::AID-ELPS2223>3.0.CO;2-D. [DOI] [PubMed] [Google Scholar]
- 17.Jones WT, Resnick MI. The characterization of soluble matrix proteins in selected human renal calculi using two-dimensional polyacrylamide gel electrophoresis. J Urol. 1990;144:1010. doi: 10.1016/s0022-5347(17)39648-9. [DOI] [PubMed] [Google Scholar]
- 18.Dussol B, Geider S, Lilova A, et al. Analysis of the soluble organic matrix of five morphologically different kidney stones. Evidence for a specific role of albumin in the constitution of the stone protein matrix. Urological Research. 1995;23:45. doi: 10.1007/BF00298850. [DOI] [PubMed] [Google Scholar]
- 19.Boyce WH, Pool CS, Meschan I, et al. Organic matrix of urinary calculi. Acta Radiologica. 1958;50:543. [PubMed] [Google Scholar]
- 20.Boyce WH. Organic matrix of human urinary concretions. AmJMed. 1968;45:673. doi: 10.1016/0002-9343(68)90203-9. [DOI] [PubMed] [Google Scholar]
- 21.Coe FL, Favus MJ, Asplin JR. Nephrolithiasis, in Brenner BM: Brenner & Rector’s The Kidney. Philadelphia, Saunders, 2004, vol. 2, pp 1819.
- 22.Finlayson B, Vermuelen CW, Stewart EJ. Stone matrix and mucoprotein from urine. J Urol. 1961;86:355. doi: 10.1016/S0022-5347(17)65178-4. [DOI] [PubMed] [Google Scholar]
- 23.Ryall RL. Glycosaminoglycans, proteins, and stone formation: Adult themes and child’s play. Pediatric Nephrology. 1996;10:656. doi: 10.1007/s004670050185. [DOI] [PubMed] [Google Scholar]
- 24.Khan SR, Kok DJ. Modulators of urinary stone formation. Frontiers In Bioscience. 2004;9:1450. doi: 10.2741/1347. [DOI] [PubMed] [Google Scholar]
- 25.Boyce WH, Garvey FK. The amount and nature of organic matrix in urinary calculi. J Urol. 1956;76:213. doi: 10.1016/S0022-5347(17)66686-2. [DOI] [PubMed] [Google Scholar]