

Abstract
Bioluminescent resonance energy transfer (BRET2) is a recently developed technology for the measurement of protein-protein interactions in a live, cell-based system. BRET2 is characterized by the efficient transfer of excited energy between a bioluminescent donor molecule (Renilla luciferase) and a fluorescent acceptor molecule (a mutant of Green Fluorescent Protein (GFP2)). The BRET2 assay offers advantages over fluorescence resonance energy transfer (FRET) because it does not require an external light source thereby eliminating problems of photobleaching and autoflourescence. The absence of contamination by light results in low background that permits detection of very small changes in the BRET2 signal. BRET2 is dependent on the orientation and distance between two fusion proteins and therefore requires extensive preliminary standardization experiments to conclude a positive BRET2 signal independent of variations in protein titrations and arrangement in tertiary structures. Estrogen receptor (ER) signaling is modulated by steroid receptor coactivator 1 (SRC-1). To establish BRET2 in a ligand inducible system we used SRC-1 as the donor moiety and ER as the acceptor moiety. Expression and functionality of the fusion proteins were assessed by transient transfection in HEK-293 cells followed by Western blot analysis and measurement of ER-dependent reporter gene activity. These preliminary determinations are required prior to measuring nuclear receptor protein-protein interactions by BRET2. This article describes in detail the BRET2 methodology for measuring interaction between full-length ER and coregulator proteins in real-time, in an in vivo environment.
Introduction
The effects of 17β-estradiol (E2) are mediated through binding to the estrogen receptor α (ERα) and estrogen receptor β (ERβ) nuclear receptor transcription factors. Upon ligand binding, the receptor dimerizes and recruits coregulator proteins. The receptor-coregulator complex binds to specific DNA sequences within the promoter regions of ER-regulated genes to regulate gene transcription [Edwards, 2000]. Other ligands elicit different effects on receptor dimerization, coregulator recruitment and DNA binding.
The importance of ERα in human physiology and breast cancer has been clearly demonstrated. However, the role of ERβ in breast cancer has only recently become more evident. For example, the ERα/ERβ ratio may be altered during carcinogenesis such that ERα expression proportionally increases as cells progress to malignancy [Clarke, 2003; Gustafsson and Warner, 2000]. Co-expression of ERα and ERβ and treatment with tamoxifen increases the antagonistic effect in an ERβ dose-dependent manner, suggesting that ERβ is a negative regulator of ERα action [Gustafsson and Warner, 2000; Pettersson et al., 2000]. ERα and ERβ may bind as hetero- or homo-dimers at ERE-containing promoters [Chen et al., 1999; Ogawa et al., 1998; Tamrazi et al., 2002; Tremblay et al., 1999]. The preferential dimerization between ERs may be key to understanding the mechanisms regulating either tamoxifen agonist or antagonist activity.
Most studies that examine nuclear receptor interactions have employed artificial reporter gene assays and co-immunoprecipitation with inherent limitations. Studies on truncated estrogen receptor and/or coregulator protein-protein interactions has been shown by several in vitro mechanisms [Chen et al., 1999; Cowley et al., 1997; Resnick et al., 2000; Valentine et al., 2000] as well as in vivo assays using fluorescently labeled fusion proteins such as fluorescence resonance energy transfer (FRET) and fluorescence recovery after photobleaching (FRAP) [Bai and Giguere, 2003; Smith et al., 1997; Tamrazi et al., 2002]. A major challenge to understanding receptor dimerization and coregulator recruitment in vivo is the development of robust methods that; 1) accurately measure protein-protein interactions in real time in live cells; 2) exhibit specificity and low background; 3) can identify effects of posttranslational modifications on interactions. The application of BRET2 addresses these critical requirements.
BRET2 is characterized by the efficient transfer of excited energy between a bioluminescent donor molecule (Renilla luciferase) and a fluorescent acceptor molecule (a mutant of Green Fluorescent Protein). The BRET2 assay has advantages over FRET analysis because it does not require an external light source, thereby eliminating the problems of photobleaching and autoflourescence. The absence of contamination by light results in a low background that allows detection of very small changes in the BRET2 signal. BRET2 is dependent on the orientation and distance between two fusion proteins and therefore requires preliminary standardization experiments to conclude a positive BRET2 signal, independent of variations in protein titrations and arrangement in tertiary structures.
Resonance energy transfer has become an invaluable mechanism for the quantitative analysis of the transient protein-protein interactions of hormone receptors. An excellent review by Eidne et al. [Eidne et al., 2002] describes application of the various methods of resonance energy transfer to study dynamic hormone receptor interactions within living cells. The predominant use of BRET2 technology to date has been to measure membrane receptor interactions, including quantitative analysis of hetero- and homo-dimerization and subsequent signaling pathways of G-protein coupled receptors [Berthouze et al., 2005; Goin and Nathanson, 2006; Harikumar et al., 2006; Huttenrauch et al., 2005; Roy et al., 2006; Urizar et al., 2005], as well as confirming interactions between growth factor receptors such as IGF-1, TGF-βRII, and FGF with novel proteins [Blanquart et al., 2005; Bottcher et al., 2004; Scaffidi et al., 2004]. To date, there are few published articles utilizing BRET technology in nuclear receptor interactions. Utilizing BRET2, Garside at al. found that the glucocorticoid receptor (GR) antagonist RU486 efficiently recruited the nuclear corepressor NCoR to the GR, whereas dexamethasone recruited SRC-1 [Garside et al., 2004]. More recently, Michelini et al. were the first to demonstrate that BRET2 can evaluate estrogen receptor homodimerization [Michelini et al., 2004].
In this study we have extensively explored BRET2 technology to define its use and limitations as a novel approach to study steroid receptor protein-protein interactions.
Reagents and instruments
Plasmid construction
The human pGFP2-C, pGFP2-N, pRluc(h)-C, and pRluc(h)-N terminal expression vectors were purchased from Perkin-Elmer Life Sciences. The GFP2-N-ERα, Rluc-N-SRC-1, and Rluc-C-SRC-1 fusion proteins were constructed by amplifying the estrogen receptor and SRC-1 fragments from the pCR3.1 vector by PCR and digesting the KpnI and ApaI sites of both the PCR products and the expression vectors. The GFP2-C-ERα fusion protein was constructed by amplifying the estrogen receptor by PCR and digesting the BamHI and BspEI sites of the insert as well as the expression vector. All constructs were verified by direct DNA sequencing.
Western blotting
HEK-293 cells (ATCC) were cultured and maintained in DMEM supplemented with 10% FBS, l-glutamine, and antibiotics at 37°C, 95% O2, and 5% CO2. Cells (3x10⁶) were seeded in 10-cm dishes and transfected with 10µg each of the above expression vectors using Lipofectamine 2000 transfection reagent (Invitrogen). 24 hours post-transfection, cells were rinsed with cold PBS, scraped from the plates and the cell pellet was lysed in 400μl of lysis buffer containing 50mM Tris-HCl (pH 7.5), 420mM NaCl, 1% NP-40, and supplemented with a protease inhibitor cocktail (Sigma). The cell lysate was centrifuged at 15,000 x g at 4°C for 20 minutes. The protein concentration in the supernatant was determined and 50μg of protein lysate was boiled in Laemmli loading buffer and subjected to a 10% SDS-PAGE for Western blotting with antibodies to ERα (VPE-614, Vector Laboratories, Burlingame, CA), GFP (SC9996, Santa Cruz Biotechnology, Santa Cruz, CA) or Rluc (MAB4400, Chemicon, Temecula, CA).
Co-immunoprecipitations
HEK-293 cells were cultured and transfected as described above. Cells (3x10⁶) were transfected with 10μg of Rluc-C-SRC-1 and 10μg GFP2-C-ERα or vector. 48 hours post-transfection, cells were rinsed in cold PBS, scraped from the dishes and the cell pellet was lysed in 400μl of hypotonic lysis buffer (20mM HEPES pH 7.5, 10% glycerol, 1mM PMSF) using five strokes of a dounce homogenizer. The lysate was centrifuged at 1,000 x g at 4°C for 20 minutes to pellet the nuclei. The cytosolic supernatant was removed and set aside at 4°C. The volume of the packed nuclei (Packed Cell Volume, or PCV) was determined and low-salt NP-40 lysis buffer (20mM HEPES pH7.5, 150mM NaCl, 1% NP-40, 50mM Tris-HCl pH 7.5, 1mM PMSF) was added at twice the PCV. The nuclear pellet was vortexed at 5 minute intervals for 30 minutes at 4°C, then centrifuged at 15,000 x g for 10 minutes at 4°C. The nuclear extract was combined with the cytosolic extract and the protein concentration was determined. Separating the cytosolic and nuclear extracts in this manner was found to preserve the protein-protein interactions and increase the yield. 500μg of combined cell lysate was pre-cleared by incubation with Protein A agarose beads for 30 minutes at 4°C. The pre-cleared supernatant was then incubated with SRC-1 antibody (0.5µg/100µg lysate; M-341, Santa Cruz) rotating overnight at 4°C. 20µl of Protein A agarose beads were added and the solution and incubated for 1 hour at 4°C while rotating. The resulting protein A/immunocomplex was then centrifuged at 15,000 x g for 1 minute at 4°C, washed in low-salt NP-40 lysis buffer, and repeated 3x. The beads were boiled in Laemmli loading buffer for 10 minutes and followed by electrophoresis by 10% SDS-PAGE.
Luciferase assays
HeLa cells were cultured in phenol-red free DMEM with 5% fetal bovine serum and plated in 6-well dishes at a confluency of 2x10⁵ cells/well. The medium was replaced with medium containing 2% dextran-coated charcoal-stripped serum and the cells were incubated for 48 hours. Cells were then transfected with 500ng of EREe1b-luciferase reporter using Fugene6 transfection reagent. 24 hours post-transfection, cells were incubated with vehicle or 10-8 M estradiol for 24 hours. The cells were lysed with luciferase lysis buffer and centrifuged at 20,000 x g at room temperature for 5 min. to remove cellular debris. The supernatant was used for a standard luciferase assay using a luminometer and luciferase assay values were normalized to protein measured by Bradford assay.
Bioluminescence Resonance Energy Transfer (BRET2)
HEK-293 cells were plated in 6-well plates (200,000 cells/well) and incubated in medium containing 5% charcoal-stripped serum overnight. Cells were transfected with varying amounts of the BRET2 expression vectors using Lipofectamine 2000 (Invitrogen) transfection reagent. 48 hours post-transfection, the cells were harvested and washed 2x in BRET Buffer (PBS plus 2μg/ml aprotinin). 50,000 cells in 40μl buffer were incubated with vehicle or 10-8M estradiol for 30 minutes at room temperature in 96-well white Optiplates (PerkinElmer). Following addition of 5μM DeepBlueC substrate, luminescence and fluorescence emissions were measured immediately on the Packard Fusion instrument at 410nm and 515nm, respectively. An extensively detailed protocol for BRET2 follows.
Methods
Since BRET2 requires transfection of fusion proteins, receptor negative cell lines that exhibit high transfection efficiency should be used. Standardization experiments must be performed before assaying fusion proteins of interest. We suggest using known interacting proteins and their respective agonists as a positive control when first applying BRET2 methodology. We found HEK-293 cells, in which most reported data with BRET2 has been documented, exhibited the highest transfection efficiency and protein expression for the very large coactivator fusion proteins used in this study. Consequently, HEK-293 cells yielded the most robust BRET2 signal when assessing ERα interactions. To assess functionality of the ERα and SRC-1 fusion proteins, HeLa cells were used. Although transfection efficiency, fusion protein expression and consequently BRET2 signal was reduced in HeLa compared to HEK-293 cells, HeLa cells are well characterized for response to estradiol in reporter gene assays and recruitment of coregulators and are therefore deemed most appropriate to confirm the functionality of the fusion proteins in comparison to wild-type proteins. The protocol detailed below is adapted from the PerkinElmer technical data sheet for catalog number 6310556, Appendix A (www.perkinelmer.com).
Preliminary experiments
1. Create a minimum of four fusion protein vectors for each protein to test whether differences in protein folding and post-translational modifications may contribute to the interaction. The orientation of the BRET2 tag can also effect protein expression and function. GFP2 and Rluc fusion construct combinations are shown in Supplementary File 1.
2. Verify the functionality and expression of all combinations of fusion proteins. Expression can be assayed by immunoblot, and the functionality of each nuclear receptor fusion protein can be confirmed with a standard reporter gene assay in which the reporter contains the hormone responsive element for the nuclear receptor. Quantitative expression of each fusion protein can also be tested individually by the Fusion instrument. Testing the expression of each bioluminescent/fluorescent fusion protein signal separately will provide the user with the maximum level of fluorescence/luminescence output without resonance energy transfer.
- For the GFP2 signal: In a 96-well black Optiplate, aliquot 50,000 transfected cells/well (25μl) and add 175μl BRET2 buffer. Read on the Fusion instrument (Fluorescence mode). (PMT:1000 volts, Gain:1, read time 0.5 sec, excitation 425/20, emission 515/30).
- For the Rluc signal: In a 96-well white Optiplate, aliquot 50,000 cells/well (25μl) and add 150μl BRET2 buffer. Add 50μl of 20μM coelentrazine h (5μM final). Incubate covered with foil 18 minutes. Read on the Fusion instrument (Luminescence mode). (PMT:900, Gain:1, read time 1 sec, emission 410).
BRET2 assay
The optimal amount of each fusion protein construct used in co-transfection experiments depends on factors such as the affinity of the two interacting domains and the levels at which each construct is expressed. For this reason, a simple 1:1 ratio of DNA may not yield the best results. Therefore, a transfection matrix experiment must be performed with various ratios of each construct and used for BRET2 measurements. Supplementary File 1 shows an example of a BRET2 transfection matrix.
1. Transfect HEK-293 cells in 100mm dishes with combinations of DNA listed above using Lipofectamine 2000 according to the manufacturer’s instructions. Use GFP2 vector (without insert) when transfecting the Rluc-Protein B to keep the DNA concentration constant (Conditions 2, 7, and 12).
2. BRET2 assays can be performed 24-72 hours post-transfection depending on protein turnover and cell doubling-time. At the time of the assay, wash cells in BRET2 buffer (Dulbecco’s Phosphate Buffered Saline (D-PBS) containing CaCl2 (0.1g/l), MgCl2 (0.1g/l), and D-Glucose (1g/l) supplemented with Aprotinin (2μg/ml)) twice, and harvest in BRET2 buffer.
3. Count the cells and resuspend 1x10⁶/ml in BRET2 buffer. Aliquot 50μl (50,000) cells in triplicate into a 96-well white Optiplate. This constitutes the non-treated cells. Aliquot another 50μl cells in triplicate for each ligand.
4. Add ligand (diluted in BRET2 buffer) or buffer alone to each well. Incubate at room temperature for 30 minutes. For example, add 6μl of a 1μM dilution of Estradiol for a final concentration of 10nM (56μl total).
5. Start BRET2 reaction by adding 14μl of 25μM (5μM final) DeepBlueC substrate one column at a time (70μl total volume). Read each column immediately on the Fusion instrument before addition of substrate to the next column.
6. Immediately following addition of DeepBlueC, read the plate on a Fusion microplate analyzer with the following settings: one second per well, PMT: 1100 volts and gain: 100, using the following 410/515 nm filter pairs: a) Rluc emission: 410 nm bandpass 80 nm; b) GFP2 emission: 515 nm bandpass 30 nm.
BRET2 can be further optimized by altering the number of cells assayed. After determining the greatest difference in signal to background from the transfection matrix (see data analysis), titrate the number of cells (50,000 to 200,000) from that particular ratio. The number of cells per well depends on protein expression levels and transfection efficiencies (i.e., the lower the protein expression, the higher the number of cells required). For each co-transfection, it is also necessary to assay Rluc-Protein B co-transfected with the empty GFP2 vector, and untransfected cells alone for calculation purposes (see below). For example, if Condition 3 (a co-transfection of both GFP2-Protein A and Rluc-Protein B) yield the highest BRET2 signal, one must simultaneously assay the same amount of Rluc-Protein B expressed with the empty GFP2 vector (Condition 2), as well as assay untransfected cells (Condition 1).
7. Resuspend cells in varying concentrations (1x10⁶/ml to 4x10⁶/ml) and aliquot 50μl of cells in triplicate per concentration. An example of a 96-well Optiplate is shown under “Cell number titration” in Supplementary File 1.
8. Follow with steps 6-8 for BRET2 analysis.
Data analysis
The average counts obtained between the triplicate wells with non-transfected cells (treated or untreated with ligand) are subtracted from the reading of transfected cells in each well (with or without ligand, respectively) to obtain the corrected counts at both wavelengths. Using the corrected counts, the BRET2 signal is then determined as the ratio between GFP2 emission (515 nm) and Rluc emission (410 nm). This is illustrated in Calculation #1, Supplementary File 1. (When subtraction of the background counts yields negative values, a BRET2 ratio of zero is assigned.)
There are two calculations to analyze the BRET2 ratio (Supplementary File 1). Both are independent and derived from the basic dogmatic principle of resonance energy transfer; GFP2 emission/Rluc emission. Both are correct and either can be used depending on presentation of data. Calculation #1 (Supplementary File 1) is best for presenting ligand-dependent versus ligand-independent interactions because it simply subtracts raw background emission from itself. In the assay above, subtract the fluorescence signal of Condition 1 (non-transfected) by the fluorescence signal of Condition 3 (GFP2-Protein A and Rluc-Protein B co-transfection) divided by the luminescence signal of Condition 1 subtracted by the luminescence signal of Condition 3.
Calculation #2 (Supplementary File 1) is the corrected BRET2 ratio (Calculation #1) and subtracts the correction factor. The correction factor is the corrected fluorescent/luminescent signal for the Rluc-Protein B expressed with the empty GFP2 vector. Instead of visualizing basal interactions as with Calculation #1, it incorporates possible false positive resonance energy transfer signals due to forced interactions between over-expressed Rluc or GFP2 fusion proteins. This calculation is best for comparing time-course or multiple ligands in one graph. In the assay described above, use Calculation #1 to calculate the corrected BRET2 ratio of both the Rluc-Protein B expressed with the empty GFP2 vector (Condition 2, or Cf), and the GFP2-Protein A:Rluc-Protein B co-transfection (Condition 3). Then subtract corrected Condition 2 from the corrected Condition 3.
Results
We have used the well characterized examples of estradiol-dependent dimerization of ERα and estradiol-dependent recruitment of the coactivator SRC-1 to demonstrate application of BRET2. The following data obtained using BRET2 technology is consistent with previously reported data using other methodologies and establishes BRET2 as a viable methodology to measure well characterized estrogen receptor functions.
Expression of GFP2-C and -N terminal estrogen receptor and Rluc-C-SRC-1 fusion proteins
Figure 1A-C shows the expression of the GFP2-C and -N terminal estrogen receptor and Rluc-C-SRC-1 fusion proteins by Western analysis in the ER negative human cervical carcinoma cell line, HeLa. Figure 1D-E demonstrates the transfection efficiency of the GFP2-Rluc positive control vector at 24 hours post-transfection in HEK-293 cells. Wild-type ER is 66kD molecular weight. Based on primary sequence, the predicted molecular weights of the GFP2-ERα, Rluc-ERα and Rluc-SRC-1 constructs are 93kD, 100kD, and 195kD, respectively and Western blot signals corresponding to these sizes are detected (Figure 1). Other bands evident on the Western blots are the results of either non-specific antibody signal (Figure 1C, all lanes) and/or partial protein degradation during lysis (Figure 1A).
Figure 1. Expression of the GFP2-C and -N terminal estrogen receptor and Rluc-C-SRC-1 fusion proteins assessed by Western blot analysis.
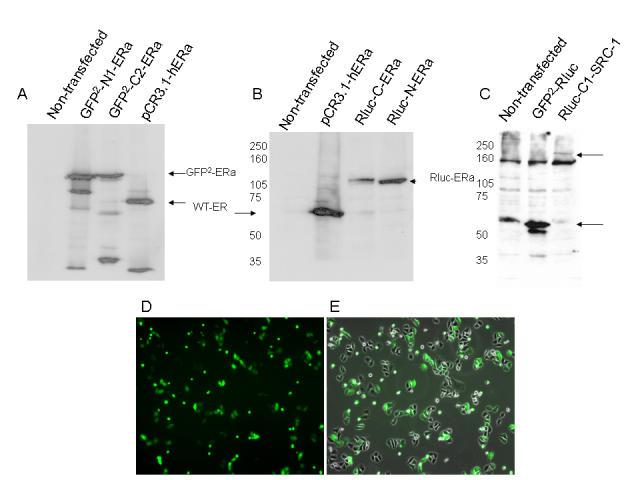
HeLa cells were plated in 10-cm dishes and transfected with 5µg each of the above expression vectors. 100µg of total cell extract was prepared for 8% SDS-PAGE and Western blotting with antibody to hERα (A and B), or Rluc (C). Transfection efficiency of the GFP2-Rluc positive control vector at 24 hours post-transfection in phase contrast (E) or the overlay of the phase contrast on the GFP filter (F) on a fluorescent microscope.
Functional analysis of N- and C-terminal fusion proteins of ERα and SRC-1
Figure 2 demonstrates the functionality of the ERα and SRC-1 fusion proteins by transient co-transfection with the ERE2e1b-luciferase reporter plasmid in ER-negative HeLa cells followed by standard luciferase assays. All combinations of N- and C- terminal SRC-1 fusion proteins potentiated GFP2-ERα activation of the reporter (Figure 2 A, B, D) with the exception of the combination of GFP2-N-ERα and Rluc-C-SRC-1 (Figure 2C). One possible reason for the absence of coactivation by this combination may be interference of the fluorescent tags with receptor-coactivator interaction. Direct comparison between the fusion proteins with wild type ERα and SRC-1 confirmed that the fusion proteins had comparable activity to wild type proteins in estradiol activation and coactivation of the ERE2e1b-luciferase reporter (Figure 2E-F). It is important to note that expression of Rluc fusion proteins may contribute to the luciferase reporter gene assay. Luciferase assays may also be used to measure expression of the fusion protein in cells. Although expression of Rluc-C-SRC-1 did not appear to contribute significantly to the luciferase assays in Figure 2, the investigator must recognize this caveat when luciferase reporter gene assays are used to measure the functionality of Rluc fusion proteins.
Figure 2. Fusion of GFP2 or Rluc to ERα and SRC-1 does not alter protein function.
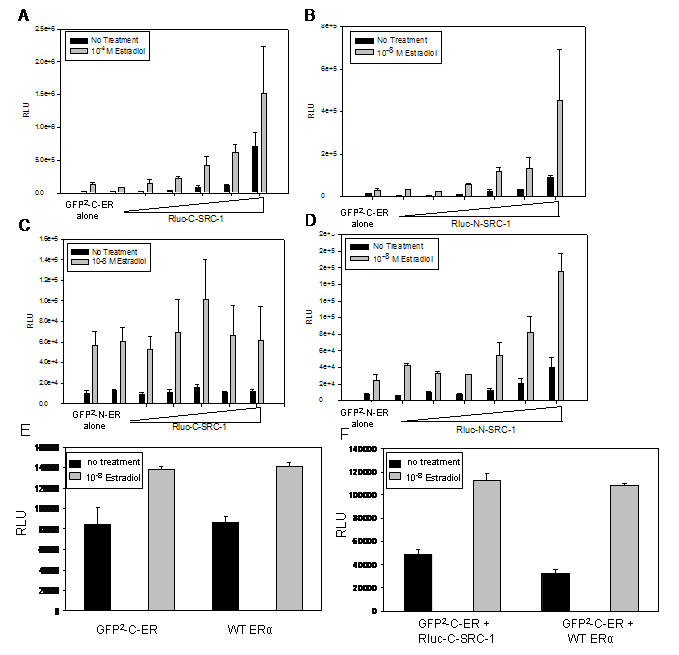
HeLa cells were transfected with 100ng of GFP2-C-ERα (A and B) or GFP2-N-ERα (C and D) expression vector with increasing amounts (100, 200, 400, 600, 800, 1000 ng) of either Rluc-C-SRC-1 (A and C) or Rluc-N-SRC-1 (B and D) expression vector, and 500ng of ERE-luciferase reporter, and the remaining amount of DNA with a vector containing a CMV promoter. The DNA levels were equivalent, with 1600ng of total transfected DNA. To confirm that the fusion proteins had comparable activity to wild type proteins, cells were transfected with reporter gene and 100ng of GFP2-C-ERα or WT-ERα to compare ERα activity (E) or with 100ng of GFP2-C-ERα + 500 ng of Rluc-C-SRC-1 or WT-SRC-1 to compare SRC-1 activity (F). All cells (A-F) were incubated with either vehicle or 10-8M estradiol for 24 hours. The cells were lysed and luciferase expression was measured by a luminometer.
ERα homodimers demonstrated by the BRET2 assay
To first determine the dose of estradiol required to stimulate homodimerization as assessed by BRET2 in HEK-293 cells, an agonist dose response curve was generated. Estradiol stimulated ER homodimerization in a dose dependent manner (data not shown). We assessed estradiol-dependent homodimerization by BRET2 using different combinations of GFP2 and Rluc, C- and N- terminal ERα fusions. By titration of GFP2-ERα and Rluc-ERα expression vectors it was determined that transfection of 10μg of both the GFP2-ERα and the Rluc-ERα fusion vectors resulted in the maximum estradiol-dependent dimerization as assessed by BRET2. All combinations of C- and N-terminal ERα fusion proteins exhibited homodimerization in response to estradiol (Figure 3A). The maximum observed BRET2 ratio occurred when using the GFP2-N-ERα, and Rluc-C-ERα fusion proteins (Figure 3A). In Figure 3B, the dashed line represents background BRET2 signal assessed from cells co-transfected with Rluc-C-ERα and the GFP2 vector. This negative control accounts for any false-positive BRET2 signals due to protein over-expression. In addition to estradiol induced homodimerization, we also observed ligand-independent homodimerization of ERα (Figure 3B, bar 3). Estradiol induced GFP2-C-ERα and Rluc-C-ERα homodimerization within 30 minutes (data not shown) and continued to stimulate this interaction for up to 12 hours (Figure 4A). To confirm the dimerization identified by BRET2, HEK-293 cells cotransfected with GFP2-C-ERα and Rluc C-ERα were coimmunoprecipitated with an antibody to GFP and probed by Western blot with antibody to Rluc (Figure 4B).
Figure 3. 17β-estradiol induced homo-dimerization of the ERα as assessed by BRET2 .
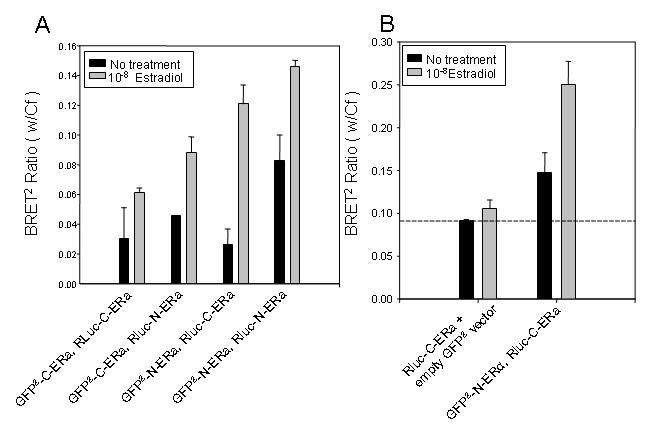
HEK-293 cells were transiently co-expressed with the GFP2-C-ERα (40µg) and Rluc-C-ERα (10µg) fusion proteins to generate a dose-response curve with estradiol treatment (data not shown). The estradiol-induced interaction by BRET2 occurs between all combinations of ERα fusion proteins, regardless of differences in tertiary structure. HEK-293 cells were transfected with 10µg each of a GFP2-ERα and Rluc-ERα fusion protein and incubated with vehicle or 10-8 M estradiol for 30 minutes (A). Luminescence and fluorescence emissions were then read immediately following addition of DeepBlueC substrate for the BRET2 assay. To determine the ligand-dependent and -independent homodimerization of ERα, HEK-293 were transfected with 10µg of Rluc-C-ERα and 10µg of either GFP2-C-ERα or the GFP2-C vector alone and treated for 30 minutes with 10-8M estradiol (B). The ligand-dependent and -independent BRET2 interaction of GFP2-C-ERα and Rluc-C-ERα with and without estradiol treatment is indicated by bars above the dashed line. The dashed line represents basal activity. This figure is representative of five experiments.
Figure 4. Time course for ligand-dependent ERα homodimerization as assessed by BRET2 .
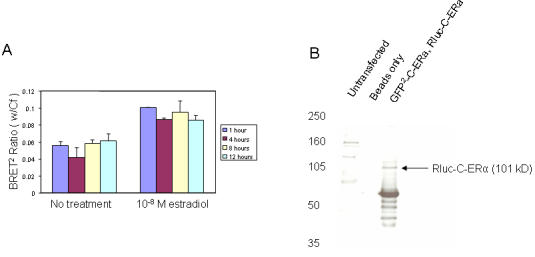
HEK-293 cells were co-transfected with Rluc-C-ERα and either GFP2-C-ERα or the GFP2 vector alone. The cells were incubated with vehicle (DMSO) or 10-8M estradiol (E2). The BRET2 assay was performed at a time course of 1, 4, 8, and 12 hours (A). The BRET2 signal was performed in triplicate and repeated three times. Co-immunoprecipitation confirms estradiol-induced homodimerization between GFP2-C-ERα and Rluc-C-ERα (B). HEK-293 cells were untransfected (Lane 1) or transfected with 10µg each of Rluc-C-ERα and 10µg of GFP2-C vector (Lane 3), and incubated with 10-8M estradiol. Immunoprecipitated Protein A agarose beads without antibody was used as a control (Lane 2). Whole cell lysate was immunoprecipitated with ERα antibody followed by Western blot for ERα. The molecular weight of Rluc-C-ERα is 101kD.
Interaction of ERα and the nuclear coactivator SRC-1 demonstrated by the BRET2
Figure 5 demonstrates the estradiol-dependent interaction of ERα and SRC-1 by titration of the GFP2-C-ERα and Rluc-C-SRC-1 fusion proteins as assessed by BRET2. The maximum BRET2 signal was approximately two-fold compared to basal interaction and occurred at 10μg of both GFP2-C-ERα and Rluc-C-SRC-1. The basal BRET2 signal is represented by the Rluc-C-SRC-1 fusion protein expressed without the estrogen receptor (Figure 5A). Estradiol induced interaction between GFP2-C-ERα and Rluc-C-SRC-1 within 1 hour and continued to stimulate this interaction for up to 12 hours (Figure 5B). The estradiol-dependent interaction between GFP2-C-ERα and Rluc-C-SRC-1 was confirmed by co-immunopreciptation (data not shown). Interestingly, in the absence of ligand there was a decrease in the BRET2 ratio over time when measuring ERα/SRC-1 interaction, but not ERα dimerization. It is possible that the interaction between ERα and SRC-1 in the absence of ligand may be cyclical or sporadic. This possibility is currently under investigation.
Figure 5. Ligand-dependent interaction between GFP2-C-ERα and Rluc-C-SRC-1 as assessed by BRET2 .
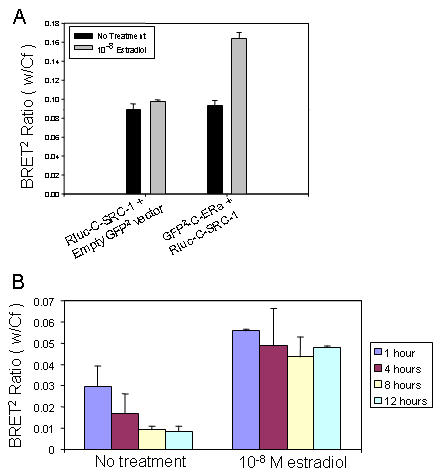
(A) HEK-293 were transfected with 10μg of Rluc-C-SRC-1 and 10µg of either GFP2-C-ERα or the GFP2-C vector alone and incubated for 30 minutes with 10-8M estradiol. The ligand-dependent interaction of GFP2-C-ERα and Rluc-C-SRC-1 in the presence of estradiol treatment is indicated by the bar above the dashed line. The dashed line represents basal activity. (B) Time course for ligand dependent interaction between ERα and SRC-1. HEK-293 cells were incubated with vehicle (DMSO) or 10-8M estradiol (E2). Figure is representative of five experiments.
Discussion
We demonstrate the use of BRET2 to assess in vivo protein interactions between nuclear receptors and coregulators in real-time. To establish BRET in a ligand inducible system, we chose to use the nuclear coactivator SRC-1 as the donor moiety, and the estrogen receptor as the acceptor moiety. Functionality of these fusion proteins was assessed by transient transfection in HeLa cells, followed by Western blot analysis for protein expression and reporter gene activity. Titration of ER and SRC-1 protein levels was needed to obtain an accurate molar ratio of the Rluc and GFP2 fusion proteins needed for BRET.
Published work with BRET2 does not contain standardization experiments that are imperative to conclude a positive BRET2 signal for data interpretation. Although BRET2 is a sensitive assay for assessing ligand and time dependent changes in nuclear receptor interactions in live cells, one limitation of BRET2 is that it is not quantitative. This is because ligand-induced conformational changes of the receptor may place the GFP2 moiety too distant from the Rluc moiety for efficient resonance energy transfer. Consequently, a large increase in the BRET2 ratio may not necessarily indicate a quantitatively greater interaction between proteins than smaller increases in the BRET2 ratio.
The functionality of the fusion proteins must be confirmed prior to assessing protein interactions by BRET2. Once the function of the fusion proteins are confirmed, titrations of the transfected expression constructs must also be performed to exclude background and insignificant BRET signals. Background BRET2 signal is defined as the fluorescent/luminescent quantitative number measured by the Fusion instrument for untransfected cells. An insignificant BRET2 signal is a signal that can occur by overexpression of the fusion proteins. Nuclear receptor function may also be assessed by other common approaches such as ligand binding, DNA binding, subcellular localization, and measuring endogenous receptor-regulated gene expression. Coactivator functionality is commonly assessed by their ability to enhance the transcriptional activity of steroid receptors. The ERα negative human embryonic kidney cell line HEK-293 is especially amenable to BRET2 analysis (see description of BRET2 at www.perkinelmer.com). Using only the ER ligand-binding domain instead of full-length receptor, previous reports using FRET demonstrated that dimerization is estradiol dose-dependent [Bai and Giguere, 2003; Tamrazi et al., 2002]. We show not only full-length estrogen receptor homodimerization, but also ERα interaction with the coactivator SRC-1, is dose-dependent, induced within thirty minutes, and stable over a twelve-hour time period.
Application of BRET2 for studying nuclear receptor interactions
BRET2 is an excellent method for measuring nuclear receptor interactions with other proteins as a consequence of specific ligand binding, receptor mutations and posttranslational modifications in a time-dependent manner. For example, this study, which demonstrates and validates BRET2 for nuclear receptor interactions, uses full-length estrogen receptor and estradiol dependent receptor dimerization and recruitment of coactivator SRC-1. A simple extension of this study to include existing or novel ligands for ER would yield time dependent data comparing receptor homodimerization and SRC-1 recruitment. In this manner, BRET2 would become especially useful in comparing activity of novel SERMs. Through preparation of fusion constructs for ERβ and other coregulators, information about additional nuclear receptor interactions could be obtained. Nuclear receptor posttranslational modifications such as phosphorylation, acetylation, and sumoylation among others play an important role in protein-protein interactions [Fu et al., 2004; Rochette-Egly, 2005; Sentis et al., 2005]. Receptor posttranslational modifications in response to subcellular localization, ligands, drugs, or peptide hormone signaling pathways impacts nuclear receptor-dependent gene transcription and can regulate the relative agonist/antagonist properties of mixed ligands. Using the example of receptor phosphorylation, BRET2 technology can measure the precise contribution of single and multiple receptor phosphorylation sites to dimerization, coregulator recruitment and interactions with other proteins through preparation of point mutations in the receptor GFP- or Rluc-fusion proteins.
Supplementary Material
Abbreviations
- BRET2
Bioluminescence resonance energy transfer
- E2
17β-Estradiol
- ER
Estrogen Receptor
- FRET
Fluorescence resonance energy transfer
- GFP2
Green Fluorescent Protein
- Rluc
Renilla luciferase
- SRC-1
Steroid Receptor Coactivator 1
References
- Bai Y., Giguere V. Isoform-selective interactions between estrogen receptors and steroid receptor coactivators promoted by estradiol and ErbB-2 signaling in living cells. Mol Endocrinol. 2003;17:589–99. doi: 10.1210/me.2002-0351. [DOI] [PubMed] [Google Scholar]
- Berthouze M., Ayoub M., Russo O., Rivail L., Sicsic S., Fischmeister R., Berque-Bestel I., Jockers R., Lezoualc'h F. Constitutive dimerization of human serotonin 5-HT4 receptors in living cells. FEBS Lett. 2005;579:2973–80. doi: 10.1016/j.febslet.2005.04.040. [DOI] [PubMed] [Google Scholar]
- Blanquart C., Boute N., Lacasa D., Issad T. Monitoring the activation state of the insulin-like growth factor-1 receptor and its interaction with protein tyrosine phosphatase 1B using bioluminescence resonance energy transfer. Mol Pharmacol. 2005;68:885–94. doi: 10.1124/mol.105.013151. [DOI] [PubMed] [Google Scholar]
- Bottcher R. T., Pollet N., Delius H., Niehrs C. The transmembrane protein XFLRT3 forms a complex with FGF receptors and promotes FGF signalling. Nat Cell Biol. 2004;6:38–44. doi: 10.1038/ncb1082. [DOI] [PubMed] [Google Scholar]
- Chen D., Pace P. E., Coombes R. C., Ali S. Phosphorylation of human estrogen receptor α by protein kinase A regulates dimerization. Mol Cell Biol. 1999;19:1002–15. doi: 10.1128/mcb.19.2.1002. [DOI] [PMC free article] [PubMed] [Google Scholar]
- Clarke R. B. Steroid receptors and proliferation in the human breast. Steroids. 2003;68:789–94. doi: 10.1016/s0039-128x(03)00122-3. [DOI] [PubMed] [Google Scholar]
- Cowley S. M., Hoare S., Mosselman S., Parker M. G. Estrogen receptors α and β form heterodimers on DNA. J Biol Chem. 1997;272:19858–62. doi: 10.1074/jbc.272.32.19858. [DOI] [PubMed] [Google Scholar]
- Edwards D. P. The role of coactivators and corepressors in the biology and mechanism of action of steroid hormone receptors. J Mammary Gland Biol Neoplasia. 2000;5:307–24. doi: 10.1023/a:1009503029176. [DOI] [PubMed] [Google Scholar]
- Eidne K. A., Kroeger K. M., Hanyaloglu A. C. Applications of novel resonance energy transfer techniques to study dynamic hormone receptor interactions in living cells. Trends Endocrinol Metab. 2002;13:415–21. doi: 10.1016/s1043-2760(02)00669-0. [DOI] [PubMed] [Google Scholar]
- Fu M., Wang C., Zhang X., Pestell R. G. Acetylation of nuclear receptors in cellular growth and apoptosis. Biochem Pharmacol. 2004;68:1199–208. doi: 10.1016/j.bcp.2004.05.037. [DOI] [PubMed] [Google Scholar]
- Garside H., Stevens A., Farrow S., Normand C., Houle B., Berry A., Maschera B., Ray D. Glucocorticoid ligands specify different interactions with NF-kappaB by allosteric effects on the glucocorticoid receptor DNA binding domain. J Biol Chem. 2004;279:50050–9. doi: 10.1074/jbc.M407309200. [DOI] [PubMed] [Google Scholar]
- Goin J. C., Nathanson N. M. Quantitative analysis of muscarinic acetylcholine receptor homo- and heterodimerization in live cells: regulation of receptor down-regulation by heterodimerization. J Biol Chem. 2006;281:5416–25. doi: 10.1074/jbc.M507476200. [DOI] [PubMed] [Google Scholar]
- Gustafsson J. A., Warner M. Estrogen receptor β in the breast: role in estrogen responsiveness and development of breast cancer. J Steroid Biochem Mol Biol. 2000;74:245–8. doi: 10.1016/s0960-0760(00)00130-8. [DOI] [PubMed] [Google Scholar]
- Harikumar K. G., Morfis M. M., Lisenbee C. S., Sexton P. M., Miller L. J. Constitutive formation of oligomeric complexes between family B G protein-coupled vasoactive intestinal polypeptide and secretin receptors. Mol Pharmacol. 2006;69:363–73. doi: 10.1124/mol.105.015776. [DOI] [PubMed] [Google Scholar]
- Huttenrauch F., Pollok-Kopp B., Oppermann M. G protein-coupled receptor kinases promote phosphorylation and β-arrestin-mediated internalization of CCR5 homo- and hetero-oligomers. J Biol Chem. 2005;280:37503–15. doi: 10.1074/jbc.M500535200. [DOI] [PubMed] [Google Scholar]
- Michelini E., Mirasoli M., Karp M., Virta M., Roda A. Development of a bioluminescence resonance energy-transfer assay for estrogen-like compound in vivo monitoring. Anal Chem. 2004;76:7069–76. doi: 10.1021/ac048914h. [DOI] [PubMed] [Google Scholar]
- Ogawa S., Inoue S., Watanabe T., Hiroi H., Orimo A., Hosoi T., Ouchi Y., Muramatsu M. The complete primary structure of human estrogen receptor β (hER β) and its heterodimerization with ER α in vivo and in vitro. Biochem Biophys Res Commun. 1998;243:122–6. doi: 10.1006/bbrc.1997.7893. [DOI] [PubMed] [Google Scholar]
- Pettersson K., Delaunay F., Gustafsson J. A. Estrogen receptor β acts as a dominant regulator of estrogen signaling. Oncogene. 2000;19:4970–8. doi: 10.1038/sj.onc.1203828. [DOI] [PubMed] [Google Scholar]
- Resnick E. M., Schreihofer D. A., Periasamy A., Shupnik M. A. Truncated estrogen receptor product-1 suppresses estrogen receptor transactivation by dimerization with estrogen receptors α and β. J Biol Chem. 2000;275:7158–66. doi: 10.1074/jbc.275.10.7158. [DOI] [PubMed] [Google Scholar]
- Rochette-Egly C. Dynamic combinatorial networks in nuclear receptor-mediated transcription. J Biol Chem. 2005;280:32565–8. doi: 10.1074/jbc.R500008200. [DOI] [PubMed] [Google Scholar]
- Roy A. A., Baragli A., Bernstein L. S., Hepler J. R., Hebert T. E., Chidiac P. RGS2 interacts with Gs and adenylyl cyclase in living cells. Cell Signal. 2006;18:336–48. doi: 10.1016/j.cellsig.2005.05.004. [DOI] [PubMed] [Google Scholar]
- Scaffidi A. K., Petrovic N., Moodley Y. P., Fogel-Petrovic M., Kroeger K. M., Seeber R. M., Eidne K. A., Thompson P. J., Knight D. A. α(v)β(3) Integrin interacts with the transforming growth factor β (TGFbeta) type II receptor to potentiate the proliferative effects of TGFbeta1 in living human lung fibroblasts. J Biol Chem. 2004;279:37726–33. doi: 10.1074/jbc.M403010200. [DOI] [PubMed] [Google Scholar]
- Sentis S., Le Romancer M., Bianchin C., Rostan M. C., Corbo L. Sumoylation of the estrogen receptor α hinge region regulates its transcriptional activity. Mol Endocrinol. 2005;19:2671–84. doi: 10.1210/me.2005-0042. [DOI] [PubMed] [Google Scholar]
- Smith C. L., Nawaz Z., O'Malley B. W. Coactivator and corepressor regulation of the agonist/antagonist activity of the mixed antiestrogen, 4-hydroxytamoxifen. Mol Endocrinol. 1997;11:657–66. doi: 10.1210/mend.11.6.0009. [DOI] [PubMed] [Google Scholar]
- Tamrazi A., Carlson K. E., Daniels J. R., Hurth K. M., Katzenellenbogen J. A. Estrogen receptor dimerization: ligand binding regulates dimer affinity and dimer dissociation rate. Mol Endocrinol. 2002;16:2706–19. doi: 10.1210/me.2002-0250. [DOI] [PubMed] [Google Scholar]
- Tremblay G. B., Tremblay A., Labrie F., Giguere V. Dominant activity of activation function 1 (AF-1) and differential stoichiometric requirements for AF-1 and -2 in the estrogen receptor α-β heterodimeric complex. Mol Cell Biol. 1999;19:1919–27. doi: 10.1128/mcb.19.3.1919. [DOI] [PMC free article] [PubMed] [Google Scholar]
- Urizar E., Montanelli L., Loy T., Bonomi M., Swillens S., Gales C., Bouvier M., Smits G., Vassart G., Costagliola S. Glycoprotein hormone receptors: link between receptor homodimerization and negative cooperativity. Embo J. 2005;24:1954–64. doi: 10.1038/sj.emboj.7600686. [DOI] [PMC free article] [PubMed] [Google Scholar]
- Valentine J. E., Kalkhoven E., White R., Hoare S., Parker M. G. Mutations in the estrogen receptor ligand binding domain discriminate between hormone-dependent transactivation and transrepression. J Biol Chem. 2000;275:25322–9. doi: 10.1074/jbc.M002497200. [DOI] [PubMed] [Google Scholar]
Associated Data
This section collects any data citations, data availability statements, or supplementary materials included in this article.