

Abstract
Nucleotide diversity was examined at mitochondrial COI and r16S2 loci in eight Glossina swynnertoni collections from northern Tanzania and from a culture maintained by the International Atomic Energy Agency. Eighteen composite haplotypes were observed among 149 flies, two of which were common to all samples and 10 were private. Mean haplotype diversity was 0.59 and nucleotide diversity was 0.0013. There were excess singular haplotypes and mutation-drift disequilibrium suggesting that populations had experienced an earlier bottleneck and subsequent expansion. Factorial correspondence analysis showed that haplotype frequencies varied much more temporally (GST = 0.18) than spatially (GST = 0.04). The estimate of effective population size Ne in Tarangire was a harmonic mean ~ 50 reproductive flies averaged over ~ 47 generations. The mean rate of gene flow was estimated to be ~ 5 ± 1 reproducing females per generation but inflated because of mutation-drift disequilibrium arising from likely earlier bottlenecks.
Keywords: Gene flow, effective population size, mitochondrial variation
Introduction
The tsetse fly Glossina swynnertoni Austen (Diptera: Glossinidae), is a member of the morsitans group (subgenus Glossina s.s.) and a vector of animal and human trypanosomiasis (Rogers & Boreham, 1973). Its presence in Tanzanian game parks is a threat to tourism by transmitting the disease to travelers (Ripamonti, et al., 2002). The species is confined to areas of northwestern Tanzania and southwestern Kenya, latitude ~ 1 to 5 degrees South and longitude ~ 33 to 38 degrees East (Buxton, 1955; Rogers & Robinson, 2004). Its fragmented distribution is limited to high altitudes (900–1800 m above the sea level, Swynnerton, 1936), in open woodland, characterized by trees of Acacia, Combretum and Commiphora spp., often with the presence of small thickets of vegetation (Potts, 1937). Control measures, including aerial insecticidal applications (Hocking et al., 1966), clearance of vegetation (Swynnerton, 1936), and expanding human agriculture have reduced the area infested by G. swynnertoni (Jordan, 1986). Ford (1971) stated the reduction in area to be ~ 6,560 km2 by 1947 and further reductions in habitat have taken place since then. National parks and reserves now provide the principal habitat. A trapping survey in Nguruman, Kenya, however, suggested that G. swynnertoni’s range might be expanding (Stiles et al., 1994) but the claim has not been confirmed by subsequent work.
Stringent control measures and reduction in habitat could have caused a genetic bottleneck in some G. swynnertoni populations and reduced its effective population size and genetic diversity. The effective size of a population (Ne) is defined as the size of an ideal population viz., one of constant size, discrete generations, negligible selection and gene flow, and exhibiting the same genetic characteristics as the sample at hand (Wright, 1931). Ne is the harmonic mean of population sizes over the sampling interval, thus defining the rate of change in genetic make-up caused by random drift (Charlesworth, 2002).
Surveys showed low allozyme genetic variation in Glossina sywnnertoni. Samples from Makuyuni, Tanzania taken in 1989 and 1991 revealed only three of 17 loci were polymorphic with mean heterozygosities of 6.1 ± 3.7% and 5.7 ± 3.7%, respectively (Gooding et al., 1993). Krafsur & Griffiths (1997) examined allozyme variation and found six (17.6 %) polymorphic loci of 34 examined, 1.2 ± 0.6 alleles per locus, and 7.2 ± 3.0% heterozygosity. G. swynnertoni did not differ significantly from four other morsitans group species, and no tangible evidence of a genetic bottleneck was detected.
Human trypanosomiasis is a particular threat to visitors to the game parks and a general threat to the Tanzanian tourist industry. Animal trypanosomiasis is a chronic problem to animal agriculture. The Tanzania Tsetse and Trypanosomiasis Research Institute hopes, therefore, to eradicate G. swynnertoni from Tanzania. Morsitans group tsetse flies are said to display strong tendencies to disperse and colonize suitable habitats (e.g. Hargrove, 2000; 2003). To be effective, control procedures must be carried out over areas large enough to delay the reappearance of tsetse for many years. Thus, estimates of gene flow would be helpful in providing indirect estimates of tsetse fly dispersal and migration (Krafsur, 2003; Gooding and Krafsur, 2005). Here we examine nucleotide diversity at two mitochondrial loci in G. swynnertoni. We address the following questions: Is mating panmictic? What is the rate of gene flow among sampled populations? Is the pattern of temporal mitochondrial diversity congruent with the species’ history and particularly, is there any signal of a recent population expansion (as from an earlier bottleneck, for example) in the frequency distribution of haplotypes? How does temporal differentiation compare with spatial differentiation? Finally, we comment on the predictive value of the genetic data in respect of anticipated area-wide control measures.
Material and Methods
Tsetse sampling
Eight geo-referenced collections of G. swynnertoni were made from the Shinyanga, Masai Mara, and Manyara regions in Tanzania (Fig. 1). Specific locations included Makau (in the Maswa reserve), two in Serengeti, and five near Tarangire (Mto wa Mbu, Naitolya, Babati, Sangaiwe, and Chubi). Distances among them varied from ~ 23 km between Serengeti north and Serengeti south to ~ 408 km between Serengeti North and Sangaiwe.
Figure 1.
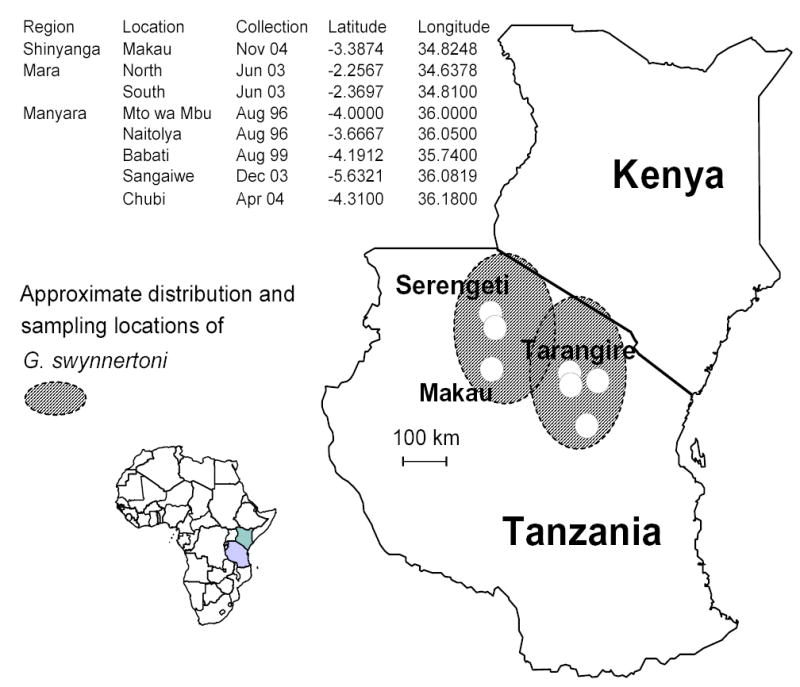
Sampling locations.
An additional collection was obtained from a culture established by Ron Gooding in Alberta in March 1991 from 154 flies eclosed from puparia collected about 32 km south of Makuyuni in northern Tanzania (Gooding et al., 1993), close to Tarangire. The culture was maintained by 45 – 60 inseminated females; in 2003 Gooding sent 288 puparia to the International Atomic Energy Agency laboratories in Austria at Seibersdorf (Gooding, personal communication to E.S.K.) where it is maintained at approximately 900 breeding females (Andrew Parker and Alan Robinson, personal communication to E.S.K.).
Collections from Tarangire were replicated temporally. Field collections were made by personnel of the Tanzania Tsetse and Trypanosomiasis Research Institute. Flies were caught in biconical traps (Challier & Laveissiere, 1973) baited with cow urine and acetone and then preserved in 75 – 85% aqueous ethanol until processing.
DNA extraction, amplification, and sequencing
After rehydrating the flies in Tris-EDTA buffer, total DNA was extracted by using the DNeasy Tissue Kit (Qiagen Inc., MD, USA). Two loci were amplified from each DNA extract: 300 bp of the ribosomal 16S (r16S2) and 440 bp of the cytochrome oxidase I (COI) mitochondrial genes. DNA amplification was carried out in 50 uL polymerase chain reaction (PCR) consisting of 48 uL of the 1.1× ReddyMix PCR Master Mix (ABgene Cat. No. AB-0575-LD) providing 1.25 units of Taq DNA polymerase, 75 mM Tris-HCl (pH 8.8), 20 mM (NH4)2SO4, 1.5 m MgCl2, 0.2 mM each dNTP, plus 2 uL of DNA extract (ca. 80 ng), and 0.5 μM each of oligonucleotide primers: N1-J-12585 [5′GGT CCC TTA CGA ATT TGA ATA TAT CCT3′] and LR-N-12866 [5′ACA TGA TCT GAG TTC AAA CCG G3′] for r16S2, and C1-J-1751 [5′GGA TCA CCT GAT ATA GCA TTC CC3′] and C1-N-2191 [5′CCC GGT AAA ATT AAA ATA TAA ACT TC3′] for CoI1 (Simon et al. 1994). Thermocycling was performed in a PTC-100 MJ Research (Woburn MA) programmable thermocycler and consisted of 30 cycles of 93°C for 45 seconds, 52° C for one minute, and 72° C for one minute.
PCR products were resolved in 1.5% (0.5× TBE) agarose gels to test for contamination and to check the quality and concentration of the target product for further processing. DNA sequencing was done at the Iowa State University DNA Sequencing and Synthesis Facility using an ABI Model 3730 automated sequence analyzer.
Sequence alignment and haplotype distinction
DNA sequences were edited and processed by using BioEdit (Hall, 1999) and MEGA ver. 3.0 (Kumar et al., 2004), and aligned by using ClustalX (Thompson et al., 1997). Haplotypes were formed by concatenating the corresponding variants at each locus. The nucleotide composition and transition-transversion ratios were examined in the alignment of each locus to check for accidental pseudogene amplification. All substitutions were confirmed by visually inspecting their corresponding sequence electropherograms. Sequences with poor alignment were censored.
Spatio-temporal analysis
The relative influence of temporal and spatial variation in haplotype frequencies was evaluated by performing correspondence analysis (Benzécri, 1992; Greenacre, 1993). The temporal frequency distribution is a contingency table with collection dates as columns and haplotype designations as rows. Marginal totals describe the frequency distribution. The variance was estimated as
where nij is the observed count for the ith row in the jth column; ni+ and n+j are the ith row and jth column totals, and n is the grand total. Here the variance measures the discrepancy between row and column marginal distributions. The significance of temporal and spatial variation was evaluated by testing hypotheses of homogeneous frequency distributions across collection dates and regions, with likelihood ratio Chi-square tests and Monte Carlo estimation of P values, with 10,000 replicates and a random original seed of 1.0199 × 10⁹. Principal components explaining total variance were computed, transformed to Chi-square distance, and plotted to portray the spread due to temporal and spatial changes of haplotype frequencies.
Mitochondrial diversity
Haplotype diversity was estimated according to Nei (1987) and nucleotide diversity according to Nei & Kumar (2000). Nei’s index HS, the average diversity over s populations, was estimated as HS = ∑he/s, where he = n(1 − ∑ xi2)/(n − 1) is the unbiased population diversity; xi is the frequency of the ith haplotype. The minimum genetic distance between two populations was estimated as Dij = ((Ji + Jj)/2) − Jij, where Ji = ∑pi2, is the identity of population i, and Jij = ∑pipj is the shared identity between populations i and j. The index Dij represents the amount of unshared identity between populations, and when averaged over s populations DST = ∑Dij/s(s − 1), is a measure of their genetic distance. Total gene diversity HT, was estimated as the sum of the diversities within samples HS, and between samples DST, according to the relation HT = HS + DST, with variance Var(HT) = Var(HS) + Var(DST) + 2 Cov(HS, DST). Genetic differentiation between samples was estimated as GST = DST/HT. Nucleotide diversity was partitioned into a within and between collection dates by the method of Nei & Kumar (2000). Average nucleotide diversity within collections was calculated as πS = ∑wKπK, where wK weights sample size, πK = q/(q − 1)∑xixjdij is the nucleotide diversity in the kth collection, q is the number of haplotypes, xi is the population frequency of the ith haplotype, and dij is the number of substitutions per site between the ith and jth haplotypes. Between population diversity was calculated as dA = πXY − (πX + πY)/2, where πXY = q/(q − 1)∑xiyidij, and is the expected number of nucleotide substitutions between two randomly chosen sequences one from each X and Y; it can also be interpreted as the net unshared nucleotide diversity between two populations. Indices πS and dA are related as πT = πS + dA where πT is the total nucleotide diversity. The ratio dA/πT is the coefficient of nucleotide differentiation NST, which is analogous to GST. The variances of πS and dA where calculated according to formulae 12.57 and 12.71 in Nei & Kumar (2000). The variance of NST was estimated by the bootstrap method.
The null hypothesis of homogeneous mitochondrial diversities was tested by Kruskal-Wallis tests with exact Monte Carlo P values replicated 10,000 times.
Effective population size Ne
Effective population size is a hypothetical number that is smaller than a census of breeding individuals and very much smaller in highly fecund species whose per capita reproductive success is small. Estimates of Ne and their confidence intervals were obtained from temporal changes in haplotype frequencies (Luikart et al., 1999). This method produces unbiased estimates that become more precise with larger numbers of generations. Generation time was taken to be 50 days, approximately the minimum generation time in IAEA lab culture (Andrew Parker, personal communication to ESK). The genetic statistics were calculated by using SAS version 9.2 (SAS Institute, 2003).
Tests for neutrality and demographic stability
DnaSP version 4.1 software (Rozas et al., 2003) was used to test hypotheses of selective neutrality of mitochondrial variants and demographic stability. In an expanding population there is an excess of singular mutations, indicated by mutation-drift disequilibrium. This forms the underlying hypothesis. Fu’s Fs statistic (Fu, 1997) and Ramos-Onsins and Rozas R2 statistic were shown to be the most powerful tests of constant population size when dealing with large samples (Ramos-Onsins and Rozas, 2002). In addition, Fu and Li’s (1993) F and D statistics were estimated. For these tests, the IAEA lab reared flies were excluded so that sample size was 135 sequences. Test outcomes are important because estimates of genetic differentiation are minimized by recent population expansions. Expansion may be generated by a selective sweep or other demographic agent that had caused an earlier, substantial reduction in population size.
Results
Nucleotide variation
Ten of 247 nucleotide residues examined at r16S2 and ten of 421 cytochrome oxidase (COI) were polymorphic, accounting for 11 and 8 variants, respectively. After concatenation there were 18 composite haplotypes among 149 flies (GenBank Accession nos: X --- Y). Ten composite haplotypes were singletons (56%) and only five composites (28%) were shared among populations (Table 1). A high frequency of singletons can, in principle, suggest recent expansion in population size (Ramos-Onsins and Rozas, 2002).
Table 1.
Nucleotide and haplotype diversities at two mitochondrial loci among 149 Glossina swynnertoni.
| r16S2 | COI | Composite | |
|---|---|---|---|
| No. of sites | |||
| Total | 247 | 421 | 668 |
| Variable | 10 | 10 | 20 |
| Shared ≥ 2 | |||
| populations | 6 | 1 | 5 |
| Singletons | 4 | 9 | 13 |
| No. of Haplotypes | |||
| Total | 11 | 8 | 18 |
| Shared ≥ 2 | |||
| populations | 7 | 2 | 8 |
| Singletons | 4 | 6 | 10 |
| Diversity ± SE | |||
| Nucleotide | 0.0031 ± 0.001 | 0.0004 ± 0.0005 | 0.0013 ± 0.0006 |
| Haplotype | 0.55 ± 0.10 | 0.10 ± 0.06 | 0.59 ± 0.10 |
Mean haplotype diversity was 0.59, indicating the odds that two randomly chosen G. swynnertoni had different haplotypes was 59%. Nucleotide diversity was 0.0013, the mean proportion of pairwise differences in samples. r16S2 showed greater diversities than COI because it had a greater proportion of variable sites (4%) than COI (2.4%). Also, 64% of r16S2 alleles were shared, compared with only 25% at COI (Table 1).
Contingency tests of within-location homogeneity indicated that Serengeti (X2(5) = 8.14, P ~ 0.15) and Tarangire (X2(7) = 8.72, P ~ 0.27) allele frequencies were independent samples. They were, therefore, combined in Table 2. A test of significance of spatial variation, however, is confounded by temporal variation and compromised by low diversities.
Table 2.
Spatial and temporal components of haplotype frequencies in G. swynnertoni.
| Sample locations | Dates of samplinga | ||||||||||
|---|---|---|---|---|---|---|---|---|---|---|---|
| Haplotypeb | IAEA | Makau | Serengeti | Tarangire | Totals | Aug 1996 | Aug 1999 | Jun 2003 | Dec 2003 | Apr 2004 | Nov 2004 |
| CAGCATCCATCCGATGTGTC | 0 | 0 | 1 | 0 | 1 | 0 | 0 | 1 | 0 | 0 | 0 |
| CCACACCTATCCGATGTGTC | 1 | 0 | 0 | 0 | 1 | 0 | 0 | 0 | 0 | 0 | 0 |
| CCGCACCCACCCGATGTGTC | 0 | 0 | 0 | 2 | 2 | 0 | 0 | 0 | 2 | 0 | 0 |
| CCGCACCCATCCGACGTGTC | 0 | 0 | 0 | 1 | 1 | 1 | 0 | 0 | 0 | 0 | 0 |
| CCGCACCCATCCGATATGTC | 0 | 0 | 0 | 1 | 1 | 1 | 0 | 0 | 0 | 0 | 0 |
| CCGCACCCATCCGATGTGTC | 1 | 4 | 15 | 32 | 52 | 14 | 2 | 15 | 4 | 12 | 4 |
| CCGCACCCATTCGATGTGTC | 0 | 0 | 0 | 1 | 1 | 1 | 0 | 0 | 0 | 0 | 0 |
| CCGCACCCCCCCGATGTGTC | 0 | 0 | 0 | 1 | 1 | 0 | 0 | 0 | 1 | 0 | 0 |
| CCGCACCTATCCAATGTGTC | 0 | 0 | 0 | 1 | 1 | 1 | 0 | 0 | 0 | 0 | 0 |
| CCGCACCTATCCGATGTGTC | 13 | 9 | 17 | 28 | 67 | 10 | 2 | 17 | 12 | 4 | 9 |
| CCGCACCTATCCGGTGGAAC | 0 | 0 | 1 | 0 | 1 | 0 | 0 | 1 | 0 | 0 | 0 |
| CCGCACCTATCTGATGTGTC | 0 | 0 | 1 | 1 | 2 | 0 | 0 | 1 | 1 | 0 | 0 |
| CCGCATCTATCCGATGTGTC | 0 | 0 | 0 | 2 | 2 | 2 | 0 | 0 | 0 | 0 | 0 |
| CCGCTCCCATCCGATGTGTC | 0 | 1 | 0 | 7 | 8 | 0 | 7 | 0 | 0 | 0 | 1 |
| CCGCTCCTATCCGATGTGTC | 0 | 2 | 0 | 2 | 4 | 0 | 2 | 0 | 0 | 0 | 2 |
| CCGCTCCTATCCGATGTGTT | 0 | 0 | 0 | 1 | 1 | 0 | 1 | 0 | 0 | 0 | 0 |
| CCGGACCCATCCGATGTGTC | 0 | 0 | 0 | 2 | 2 | 2 | 0 | 0 | 0 | 0 | 0 |
| GAGTCTTCATCCGATGTGTC | 0 | 0 | 1 | 0 | 1 | 0 | 0 | 1 | 0 | 0 | 0 |
| Totals | 15 | 16 | 36 | 82 | 149 | 32 | 14 | 36 | 20 | 16 | 16 |
data exclude the IAEA sample
indicated by variable sites
Temporal vs. spatial variation
Haplotype frequencies are set forth in Table 2. Two of 18 haplotypes accounted for 80% of the flies sampled. Temporal variation was 2.6-fold greater than spatial variation (Fig. 2). Monte Carlo likelihood ratio tests indicated the proportion of spatial variance was 0.07 and not significantly different from zero (X2(32) = 33.6, P = 0.35). The proportion of temporal variance was 0.18 (X2(80) = 110.6, P ~ 0.0001).
Figure 2.
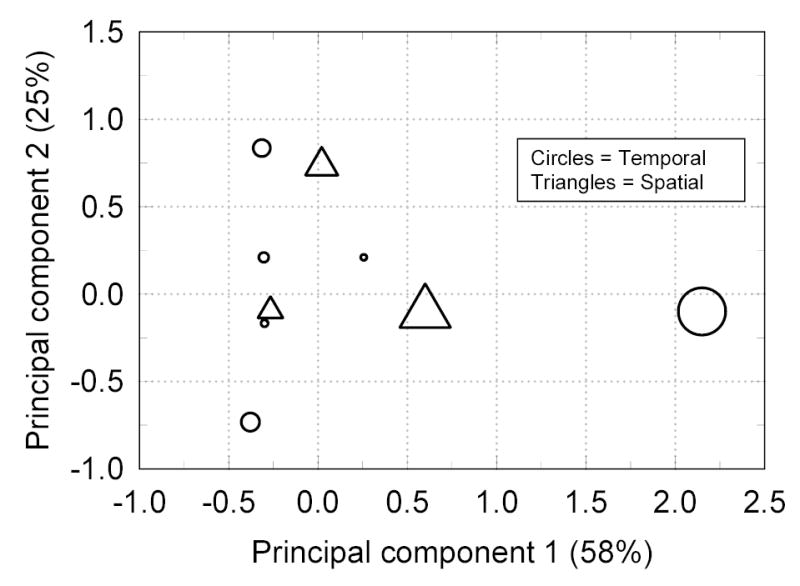
Chi-square distance map of spatial and temporal samples as functions of the first two principal components accounting for 87% of the total variance. The symbols are scaled to the samples’ proportional contribution to the total variance.
The mean regional haplotype (HS) and nucleotide (πS) diversities were homo-generous (Table 3). Three haplotypes were detected in the lab culture but two were in low frequencies; one lab haplotype was undetected in our field samples. Diversity HS was 0.257 which testifies to the careful husbandry required to maintain tsetse flies in culture. Temporal and spatial partition of haplotype and nucleotide diversities indicated a fourfold greater differentiation between collection dates than between locations (Table 4), most likely a consequence of genetic drift that occurs most strongly in small populations. Differentiation indices NST and GST correspond to the probability that two randomly chosen flies, each from a different location or collection date, are different; they also represent the proportions of unshared diversity between locations and collection dates. Thus, there was much more unshared diversity among collection dates than among locations.
Table 3.
Kruskal-Wallis homogeneity tests of concatenated haplotype (HS) and nucleotide (πS) diversities among G. swynnertoni from three Tanzania locations.
| Locations | Collections | No. haplotypes | N | HS ± SD | πii ± SD | ||
|---|---|---|---|---|---|---|---|
| IAEAIII | 3 | 16 | 0.25 | 0.04 | 0.0004 | 0.0002 | |
| Makau | Nov 04 | 4 | 16 | 0.642 | 0.103 | 0.0012 | 0.0004 |
| Serengeti | Jun 03, North | 3 | 20 | 0.542 | 0.076 | 0.0016 | 0.0004 |
| Jun 03, South | 5 | 16 | 0.683 | 0.091 | 0.0021 | 0.0006 | |
| Mean | 0.613 | 0.002 | |||||
| Tarangire | Aug 96, Mto wa Mbu | 7 | 16 | 0.775 | 0.088 | 0.0017 | 0.0005 |
| Aug 96, Naitolya | 4 | 16 | 0.692 | 0.074 | 0.0013 | 0.0005 | |
| Aug 99, Babati | 5 | 14 | 0.736 | 0.107 | 0.0016 | 0.0005 | |
| Dec 03, Sangaiwe | 5 | 20 | 0.616 | 0.106 | 0.0014 | 0.0004 | |
| Apr 04, Chubi | 2 | 16 | 0.400 | 0.114 | 0.0006 | 0.0003 | |
| Mean | 0.644 | 0.001 | |||||
| Grand mean | 0.635I | 0.0014II | |||||
Kruskal-Wallis X2(2) = 0.58, P = 0.75
Kruskal-Wallis X2(2) = 2.45, P = 0.29
Excluded from analysis.
Table 4.
Partition of mitochondrial diversity in G. swynnertoni.
| Index | Estimate ± SE | |
|---|---|---|
| Temporal nucleotide diversity, | ||
| within collections, πC | 0.0014 | 0.0006 |
| between collections, dC | 0.0004 | 0.0002 |
| total, π T | 0.0018 | 0.0003 |
| Differentiation between collections, NCT | 0.22 | 0.06 |
| Spatial nucleotide diversity, | ||
| within locations, π S | 0.0016 | 0.0011 |
| Between locations, dS | 0.0001 | 0.0008 |
| total, πT | 0.0017 | 0.0007 |
| Differentiation among locations, NST | 0.06 | 0.04 |
| Temporal haplotype diversity, | ||
| within collections, HC | 0.622 | 0.016 |
| Between collections, DC | 0.133 | 0.003 |
| Total, HT | 0.755 | 0.095 |
| Differentiation among collections, GCT | 0.177 | 0.003 |
| Spatial haplotype diversity, | ||
| Within locations, HS | 0.663 | 0.023 |
| Between locations, DST | 0.029 | 0.002 |
| Total diversity, HT | 0.691 | 0.069 |
| Differentiation among locations, GST | 0.042 | 0.003 |
Effective population size
The greater the genetic variance between successive samples the less the effective population size Ne. Temporal variation in haplotype frequencies in the villages of Tarangire allowed sequential estimates of Ne. These suggested small effective population sizes (Table 5). The best estimate is Ne ~ 66 reproducing female flies per generation, taken over the interval of ~ 54 generations that accrued between August 1996 and April 2004. The other estimates varied from two to 41 reproductive females and the lesser estimates are biased because tsetse fly generations greatly overlap.
Table 5.
Sequential estimates of effective population size (Ne and 97.5% confidence limits, upper diagonal) based on changes in haplotype frequencies after the indicated number of generations (lower diagonal) elapsing between G.swynnertoni samplings in Tarangire.
| Collection dates | 14 Aug 1996 | 1 Aug 1999 | 23 Dec 2003 | 27 Apr 2004 |
|---|---|---|---|---|
| 14 Aug 1996 | – | 18 (14, 31) | 41.0 (30, 77) | 66.0 (54,107) |
| 1 Aug 1999 | 22.0 | – | 19 (17, 37) | 25 (23, 43) |
| 23 Dec 2003 | 56.0 | 35.0 | – | 2 (1, 3) |
| 27 Apr 2004 | 54.0 | 32.0 | 3.0 | – |
Genetic differentiation and gene flow
Estimates of pairwise genetic differentiation and gene flow between collection sites suggest a mean GST ~ 0.04 (Table 4) and a modest gene flow between regions that averaged ~ 12 reproductive females per generation. Gene flow, however, is biased upwardly by sampling over long time intervals because even a little dispersal during the intervals between sampling would increase the degree homogeneity among populations. Also, low diversities reduced the power to detect genetic differentiation.
Tests for neutrality and demographic stability
Fu’s Fs statistic was −11.1, thereby suggesting an excess of rare alleles and providing evidence against selective neutrality of mitochondrial variants. Fu and Li’s D = −5.01, and F = −4.6, both P < 0.02. Ramos-Onsins and Rozas R2 statistic was 0.0389, also consistent with an hypothesis of selective neutrality. These statistical results suggest an earlier selective sweep or other demographic phenomenon that caused an earlier bottleneck in population size from which G. swynnertoni are now recovering.
Discussion
Mitochondrial diversity
Glossina swynnertoni possesses less mitochondrial diversity (HS = 0.66) than G. pallidipes and G. morsitans s.l. (HS = 0.85 in each, Marquez and Krafsur, unpublished data). Diversity was particularly low at COI, with only 2.3 % variable among 421 nucleotide residues examined. Two of 18 composite haplotypes were present in high frequencies and found in all samples. Ten haplotypes (56%) were singular, and the frequencies of 15 haplotypes were less than 5% thus contributing little to population diversities HS and πS. The large proportion of singletons can be taken as evidence of a recent expansion in population size (Slatkin and Hudson, 1991; Fu, 1997).
Diversity in the IAEA culture was substantial considering that it was maintained as research stock in overlapping generations of 45 to 60 females for ten years; 288 puparia from Gooding’s stock was sent to IAEA in 1993. Studies on other morsitans group species lab cultures have shown that mitochondrial and nuclear diversities were not greatly attenuated from levels recorded in natural populations (Gooding and Krafsur, 2005).
Effective population size
Sequential estimates of harmonic mean Ne of up to 66 reproductive female G. swynnertoni at Tarangire is substantially less than what a census would show. Its low value helps to explain the low mitochondrial diversity observed in G. swynnertoni. Ne in G. pallidipes at Lambwe, Kenya was estimated to be 102 – 522 and 250 – 1000 at Nguruman, Kenya (Ouma, Marquez & Krafsur, unpublished data). The estimate for G. swynnertoni is nearly an order of magnitude less than these G. pallidipes populations. G. swynnertoni’s small effective population size probably accrues from pest management practices and loss of habitat to large scale farming. The current population sizes, however, are consistent with a recent, rapid expansion of G. swynnertoni populations. The chief effect of loss of diversity in G. swynnertoni is an underestimate of among-population genetic differentiation. Thus, our estimates of gene flow are exaggerated, perhaps grossly so. The relationship of Ne to FST is hyperbolic such that small changes in FST of 0.01 to ~ 0.2 can lead to very large changes in Ne. Thus, even a small underestimate in FST has large consequences in terms of gene flow, which become greatly exaggerated.
Population differentiation and gene flow
Population diversities HS and πS were statistically homogeneous across regions when a very conservative test of hypothesis was used. Spatial homogeneity was an unexpected result considering that G. swynnertoni has a limited and fragmented distribution. This scenario, moreover, was complicated by sampling that confounded temporal and spatial variation. Factorial correspondence analyses, however, quantified their relative magnitudes and showed that temporal variation was significantly the greater. Nevertheless, gene flow in G. swynnertoni would seem to be substantial and greater than detected in other morsitans group species all of which show that the force of genetic drift is the greater (Krafsur, 2003). The inference of substantial gene flow in G. swynnertoni, however, is probably flawed.
Hypotheses of mutation-drift equilibrium were rejected thereby suggesting a recent expansion in population size. The effects of such an expansion are to diminish estimates of genetic differentiation which leads to an overestimate of gene flow. Mutation-drift disequilibrium suggests an earlier bottleneck in population size caused by a selective sweep or other demographic agent for which there is good historical support. The rinderpest epizootics of the late nineteenth and early twentieth centuries had great effects on tsetse flies via loss of mammalian hosts (Ford, 1971). Control measures specifically against G. swynnertoni in the mid- and late twentieth century could also have also had strong demographic effects.
Prospectus for area-wide control
The chief justification for carrying out genetic research on G. swynnertoni was to estimate breeding structure in terms of population subdivision and gene flow. Valid inferences from such estimates can be used to help design control schemes. Our data do not seem particularly helpful because we could not easily reject an hypothesis that mitochondrial genomes were spatially homogeneous thus leading to an inference of high rates of gene flow. But for reasons already rehearsed (low diversity, a high frequency of singletons, and mutation-drift disequilibrium) we have underestimated genetic differentiation and population subdivision thereby overestimating gene flow.
G. swynnertoni, like other tsetse, have a patchy distribution because suitable habitat is also patchy from natural and man-made causes. Representative sampling of G. swynnertoni is problematic and trapping trials suggest that most methods underestimate population densities (Ndegwa & Mihok, 1999). Clearly this tsetse can occur in dense populations. The genetic data, however, would seem to indicate that G. swynnertoni populations have not been particularly abundant historically or greater mitochondrial diversity would be evident, temporal variation would be less, and the frequency of singleton haplotypes would be less. Although the data do not strongly support the contention, we believe gene flow among G. swynnertoni populations is not great. We consider that the genetic data do not contraindicate efforts to deal with tsetse populations on a location by location basis as, indeed, has recently been advocated by Torr et al. (2005).
Acknowledgments
We thank Prof. Ron Gooding and Dr. Steve Mihok for trenchant and helpful reviews of the manuscript and Dr A. R. Msingi at TTRI for field support.
References
- Benzecri, J.-P. (1992) Correspondence analysis handbook. Marcel Dekker, New York.
- Buxton, P.A. (1955) The natural history of tsetse flies: An account of the biology of the genus Glossina (Diptera). H. K. Lewis & Co., London.
- Charlesworth B. Effective population size. Current Biology. 2002;12:R716–717. doi: 10.1016/s0960-9822(02)01244-7. [DOI] [PubMed] [Google Scholar]
- Challier A, Laveissière C. Un nouveau piège pour la capture des glossines (Glossina; Diptera, Muscidae): description et essays sur le terrain. Cah. O.R.S.T.O.M. Sér. Entomologie Médique Parasitologie. 1973;11:251–262. [Google Scholar]
- Ford, J. (1971) The Role of Trypanosomiases in African Ecology Clarendon Press, Oxford.
- Fu YX. Statistical tests of neutrality of mutations against population growth, hitchhiking and background selection. Genetics. 1997;147:915–925. doi: 10.1093/genetics/147.2.915. [DOI] [PMC free article] [PubMed] [Google Scholar]
- Fu Y-X, Li WH. Statistical tests of neutrality of mutations. Genetics. 1993;133:693–709. doi: 10.1093/genetics/133.3.693. [DOI] [PMC free article] [PubMed] [Google Scholar]
- Gooding RH, Mbise S, Macha P, Rolseth BM. Genetic variation in a Tanzanian population of Glossina swynnertoni (Diptera: Glossinidae) Journal of Medical Entomology. 1993;30:489–492. doi: 10.1093/jmedent/30.2.489. [DOI] [PubMed] [Google Scholar]
- Gooding RH, Krafsur ES. Tsetse genetics: contributions to biology, systematics, and control of tsetse flies. Annual Review of Entomology. 2005;50:101–123. doi: 10.1146/annurev.ento.50.071803.130443. [DOI] [PMC free article] [PubMed] [Google Scholar]
- Greenacre, M.J. (1993) Correspondence analysis in practice. Academic Press, London.
- Hall TA. BioEdit: A user-friendly biological sequence alignment editor and analysis program for Windows 95/98/NT. Nucleic Acids Symposium Series. 1999;41:95–98. [Google Scholar]
- Hargrove JW. A theoretical study of the invasion of cleared areas by tsetse flies (Diptera: Glossinidae) Bulletin of Entomological Research. 2000;90:201–209. doi: 10.1017/s0007485300000328. [DOI] [PubMed] [Google Scholar]
- Hargrove, J.W. (2003) Tsetse eradication: sufficiency, necessity and desirability. Research report, DFID Animal Health Programme, Centre for Tropical Veterinary Medicine, University of Edinburgh, UK.
- Hocking KS, Lee CW, Beesley JSS, Matechi HT. Aircraft applications of insecticides in East Africa. XVI – Airspray experiment with endosulfan against Glossina morsitans Westw., G. swynnertoni Aust. And G. pallidipes Aust. Bulletin of Entomological Research. 1966;56:737–744. doi: 10.1017/s0007485300056728. [DOI] [PubMed] [Google Scholar]
- Jordan, A.M. (1986) Trypanosomiasis control and African Rural Development Longman Group Ltd, Harlowe.
- Krafsur ES. Tsetse fly population genetics: an indirect approach to dispersal. Trends in Parasitology. 2003;19:162–166. doi: 10.1016/s1471-4922(03)00034-5. [DOI] [PubMed] [Google Scholar]
- Krafsur ES, Griffiths N. Genetic variation at structural loci in the Glossina morsitans species group. Biochemical Genetics. 1997;35:1–11. doi: 10.1023/a:1022252311715. [DOI] [PubMed] [Google Scholar]
- Kumar S, Tamura K, Nei M. MEGA3: Integrated software for molecular evolutionary Genetics Analysis and sequence alignment. Briefings in Bioinformatics. 2004;5:150–163. doi: 10.1093/bib/5.2.150. [DOI] [PubMed] [Google Scholar]
- Luikart G, Allendorf FW, Cornuet JM, Sherwin WB. Distortion of allele frequency distributions provides a test for recent population bottlenecks. Journal of Heredity. 1999;89:238–247. doi: 10.1093/jhered/89.3.238. [DOI] [PubMed] [Google Scholar]
- Maruyama T, Fuerst PA. Population bottlenecks and non equilibrium models in population genetics II. Number of alleles in a small population that was formed by a recent bottleneck. Genetics. 1985;111:675–689. doi: 10.1093/genetics/111.3.675. [DOI] [PMC free article] [PubMed] [Google Scholar]
- Ndegwa PN, Mihok S. Development of odour-baited traps for Glossina swynnertoni (Diptera: Glossinidae) Bulletin of Entomological Research. 1999;89:255–261. [Google Scholar]
- Nei, M. (1987) Molecular evolutionary genetics. Columbia University Press, New York.
- Nei, M. & Kumar, S. (2000) Molecular Evolution and Phylogenetic. Oxford University Press Inc., New York.
- Potts WH. The distribution of tsetsefies in Tanganyika territory. Bulletin of Entomological Research. 1937;28:129–148. [Google Scholar]
- Ramos-Onsins SE, Rozas J. Statistical properties of new neutrality tests against population growth. Molecular Biology and Evolution. 2002;19:2092–2100. doi: 10.1093/oxfordjournals.molbev.a004034. [DOI] [PubMed] [Google Scholar]
- Ripamonti D, Massari M, Arici C, Gabbi E, Farina C, Brini M, et al. African sleeping sickness in tourists returning from Tanzania: the first 2 Italian cases from a small outbreak among European travelers. Clinical and Infectious Diseases. 2002;34(1):E18–E22. doi: 10.1086/338157. [DOI] [PubMed] [Google Scholar]
- Rogers DJ, Boreham PF. Sleeping sickness survey in the Serengeti area (Tanzania) 1971. II. The vector role of Glossina swynnertoni Austen. Acta Tropica. 1973;30:24–35. [PubMed] [Google Scholar]
- Rogers, D.J. & Robinson, T.P. (2004) Tsetse distribution. pp. 139–179 In Maudlin, I., Holmes, P.H. & Miles, M.A.,(eds.) The Trypanosomes. Wallingford, CABI publishing.
- Rozas, J., Sánchez-DelBarrio, J.C., Messeguer, X., Rozas, R. DnaSP, DNA polymorphism analyses by the coalescent and other methods. Bioinformatics19, 2496–2497 [DOI] [PubMed]
- SAS (2003) SAS language reference, Version 9.2 Cary, North Carolina.
- Simon, C., Frati, F., Beckenbach, A., Crespi, B., Liu, H. & Flook, P. (1994) Evolution, weighting, and phylogenetic utility of mitochondrial gene sequence and a compilation of conserved polymerase chain reaction primers Annals Entomological Society of America87, 651–701.
- Slatkin M, Hudson RR. Pairwise comparisons of mitochondrial DNA sequences in stable and exponentially growing populations. Genetics. 1991;129:555–562. doi: 10.1093/genetics/129.2.555. [DOI] [PMC free article] [PubMed] [Google Scholar]
- Stiles JK, Otieno LH, Chaudhury MF, Moloo SK. Upsurge of the tsetse fly Glossina swynnertoni at Nguruman, Kenya. Medical and Veterinary Entomology. 1994;8:199–200. doi: 10.1111/j.1365-2915.1994.tb00164.x. [DOI] [PubMed] [Google Scholar]
- Swynnerton CFM. The tsetse flies of East Africa: A first study of their ecology with a view to their control. Transactions of the Royal Entomological Society of London. 1936;84:1–579. [Google Scholar]
- Thompson JD, Gibson TL, Plewniak F, Jeanmougin F, Higgins DG. The ClustalX windows interface: Flexible strategies for multiple sequence alignment aided by quality analysis tools. Nucleic Acids Research. 1997;24:4876–4882. doi: 10.1093/nar/25.24.4876. [DOI] [PMC free article] [PubMed] [Google Scholar]
- Torr, S.J., Hargrove, J.W. & Vale, G.A. (2005) Towards a rational policy for dealing with tsetse. Trends in Parasitology (in press). [DOI] [PubMed]
- Wright S. Evolution in Mendelian populations. Genetics. 1931;16:97–159. doi: 10.1093/genetics/16.2.97. [DOI] [PMC free article] [PubMed] [Google Scholar]